


This article is an excerpt from the book Big Data Analytics: Disruptive Technologies for Changing the Game (MC Press, October 2012).
We are increasing the pace for Big Data creation. This article examines the forces behind this tsunami of Big Data. There are three contributing factors: consumers, automation, and monetization. More than each of these contributing factors, their interaction is speeding the creation of Big Data. With increasing automation, it is easier to offer Big Data creation and consumption opportunities to the consumers and the monetization process is increasingly providing an efficient marketplace for Big Data.
Sophisticated Consumers
The increase in information level and the associated tools has created a new breed of sophisticated consumers. These consumers are far more analytic, far savvier at using statistics, and far more connected, using social media to rapidly collect and collate opinion from others. We live in a world full of marketing messages. While most of the marketing is still broadcast using newspaper, magazine, network TV, radio, and display advertising, even in the conventional media, narrow casting is gradually becoming more prominent. This is seen in local advertisement insertions in magazines, insertion of narrow cast commercials using set-top boxes, and use of commuter information to change street display ads. The Internet world can become highly personalized. Search engines, social network sites, and electronic yellow pages insert advertisements specific to an individual or to a micro-segment. Internet cookies are increasingly used to track user behavior and to tailor content based on this behavior.
Email and text messages rapidly led toward increased interpersonal interactions. Communication started not only with marketers but also with third parties and friends. Communication expanded to bulletin boards, group chats, and social media, allowing us to converse about our purchase intentions, fears, expectations, and disappointments with small and large social groups. Unlike email and text, the conversations are on the Web for others to read, either now or later.
So far, we have been dealing only with single forms of communication. The next sets of sources combine information from more than one media. For example, Facebook conversations involve a number of media, including text, sound clips, photos, and video. Second world and alternate reality are becoming interesting avenues for trying out product ideas in a simulated world where product usage can be experimented with.
We often need experts to help us sort out product features and how they relate to our product usage. A large variety of experts are available today to help us with usage, quality, pricing, and value-related information about products. A number of marketers are encouraging advisor or ambassador programs using social media sites. These selected customers get a preview of new products and actively participate in evaluating and promoting new products. At the end of the day, people we know and trust sway our decisions. This is the biggest contribution of social networks. They have brought consumers together such that sharing customer experiences is now far more frequent than ever before.
How would a consumer deal with a poor service quality experience? Figure 1 shows typical behaviors in mature and emerging markets as studied by an IBM Global Telecom Consumer Survey conducted with a sample size of 10,177.1 In this survey, 78 percent of the consumers surveyed in the mature markets said they avoid providers with whom friends or family had bad experience. The percentage was even higher (87 percent) in growth markets. In response to a related question, survey participants said that they inform friends and family about poor experience (73 percent in mature markets and 85 percent in growth markets). These numbers together show a strong influence of social network on purchase behavior. These are highly significant percentages and are now increasingly augmented by social media sites (e.g., the "Like" button placed on Facebook). The same survey also found that the three most preferred sources for recommendation information are Internet, recommendations from family/friends, and social media.
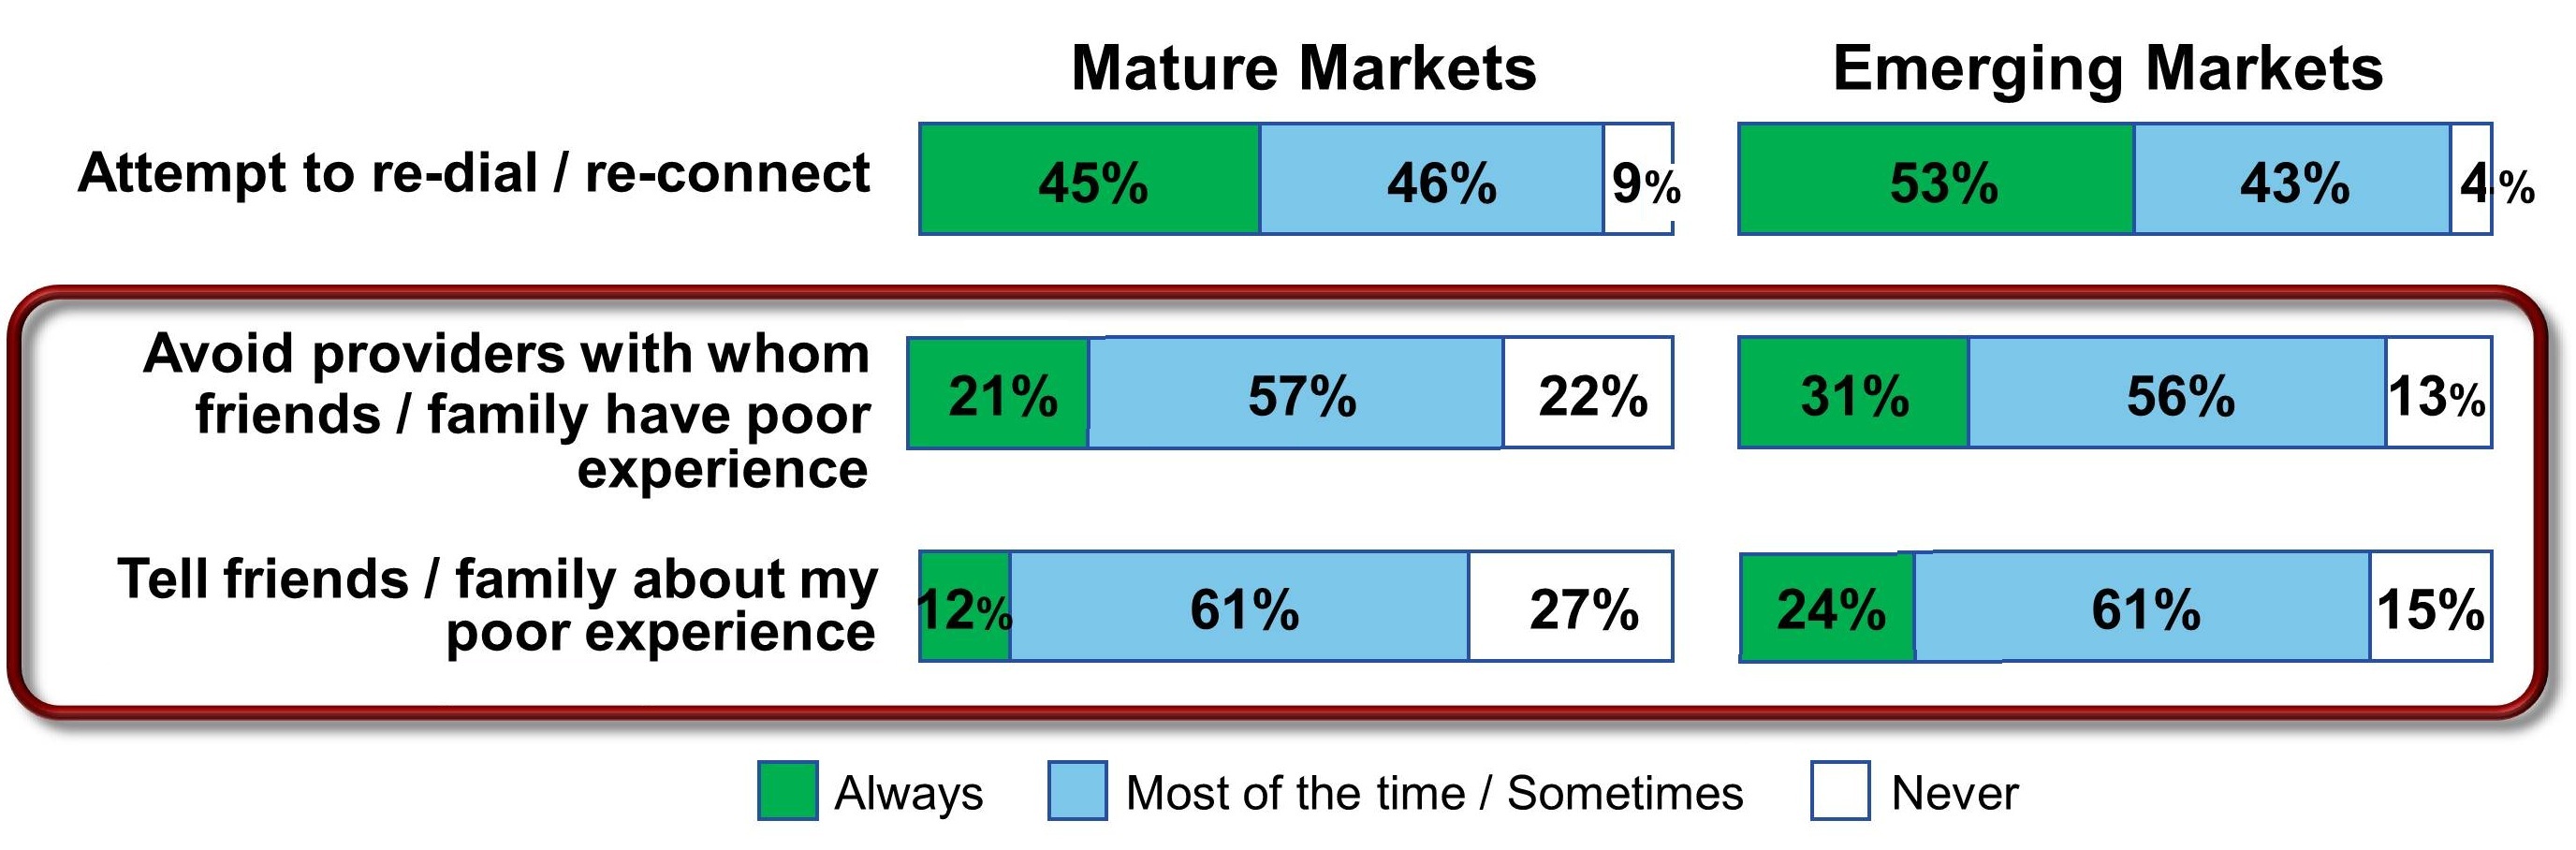
Figure 1: Behaviors in response to poor service quality experience (Source: 2011 IBM Global Telecom Consumer Survey, Global N = 10177; Mature Countries N = 7875)
In any group, there are leaders. These are the people who lead a change from one brand to another. Leaders typically have a set of followers. Once a leader switches a brand, it increases the likelihood for the social group members to churn as well. Who are these leaders? Can we identify them? How can we direct our marketing to these leaders?
In any communication, the leaders are always the center of the hub (see Figure 2). They are often connected to a larger number of "followers," some of whom could also be leaders. In the figure, the leaders have a lot more communication arrows either originating or terminating to them compared with others.
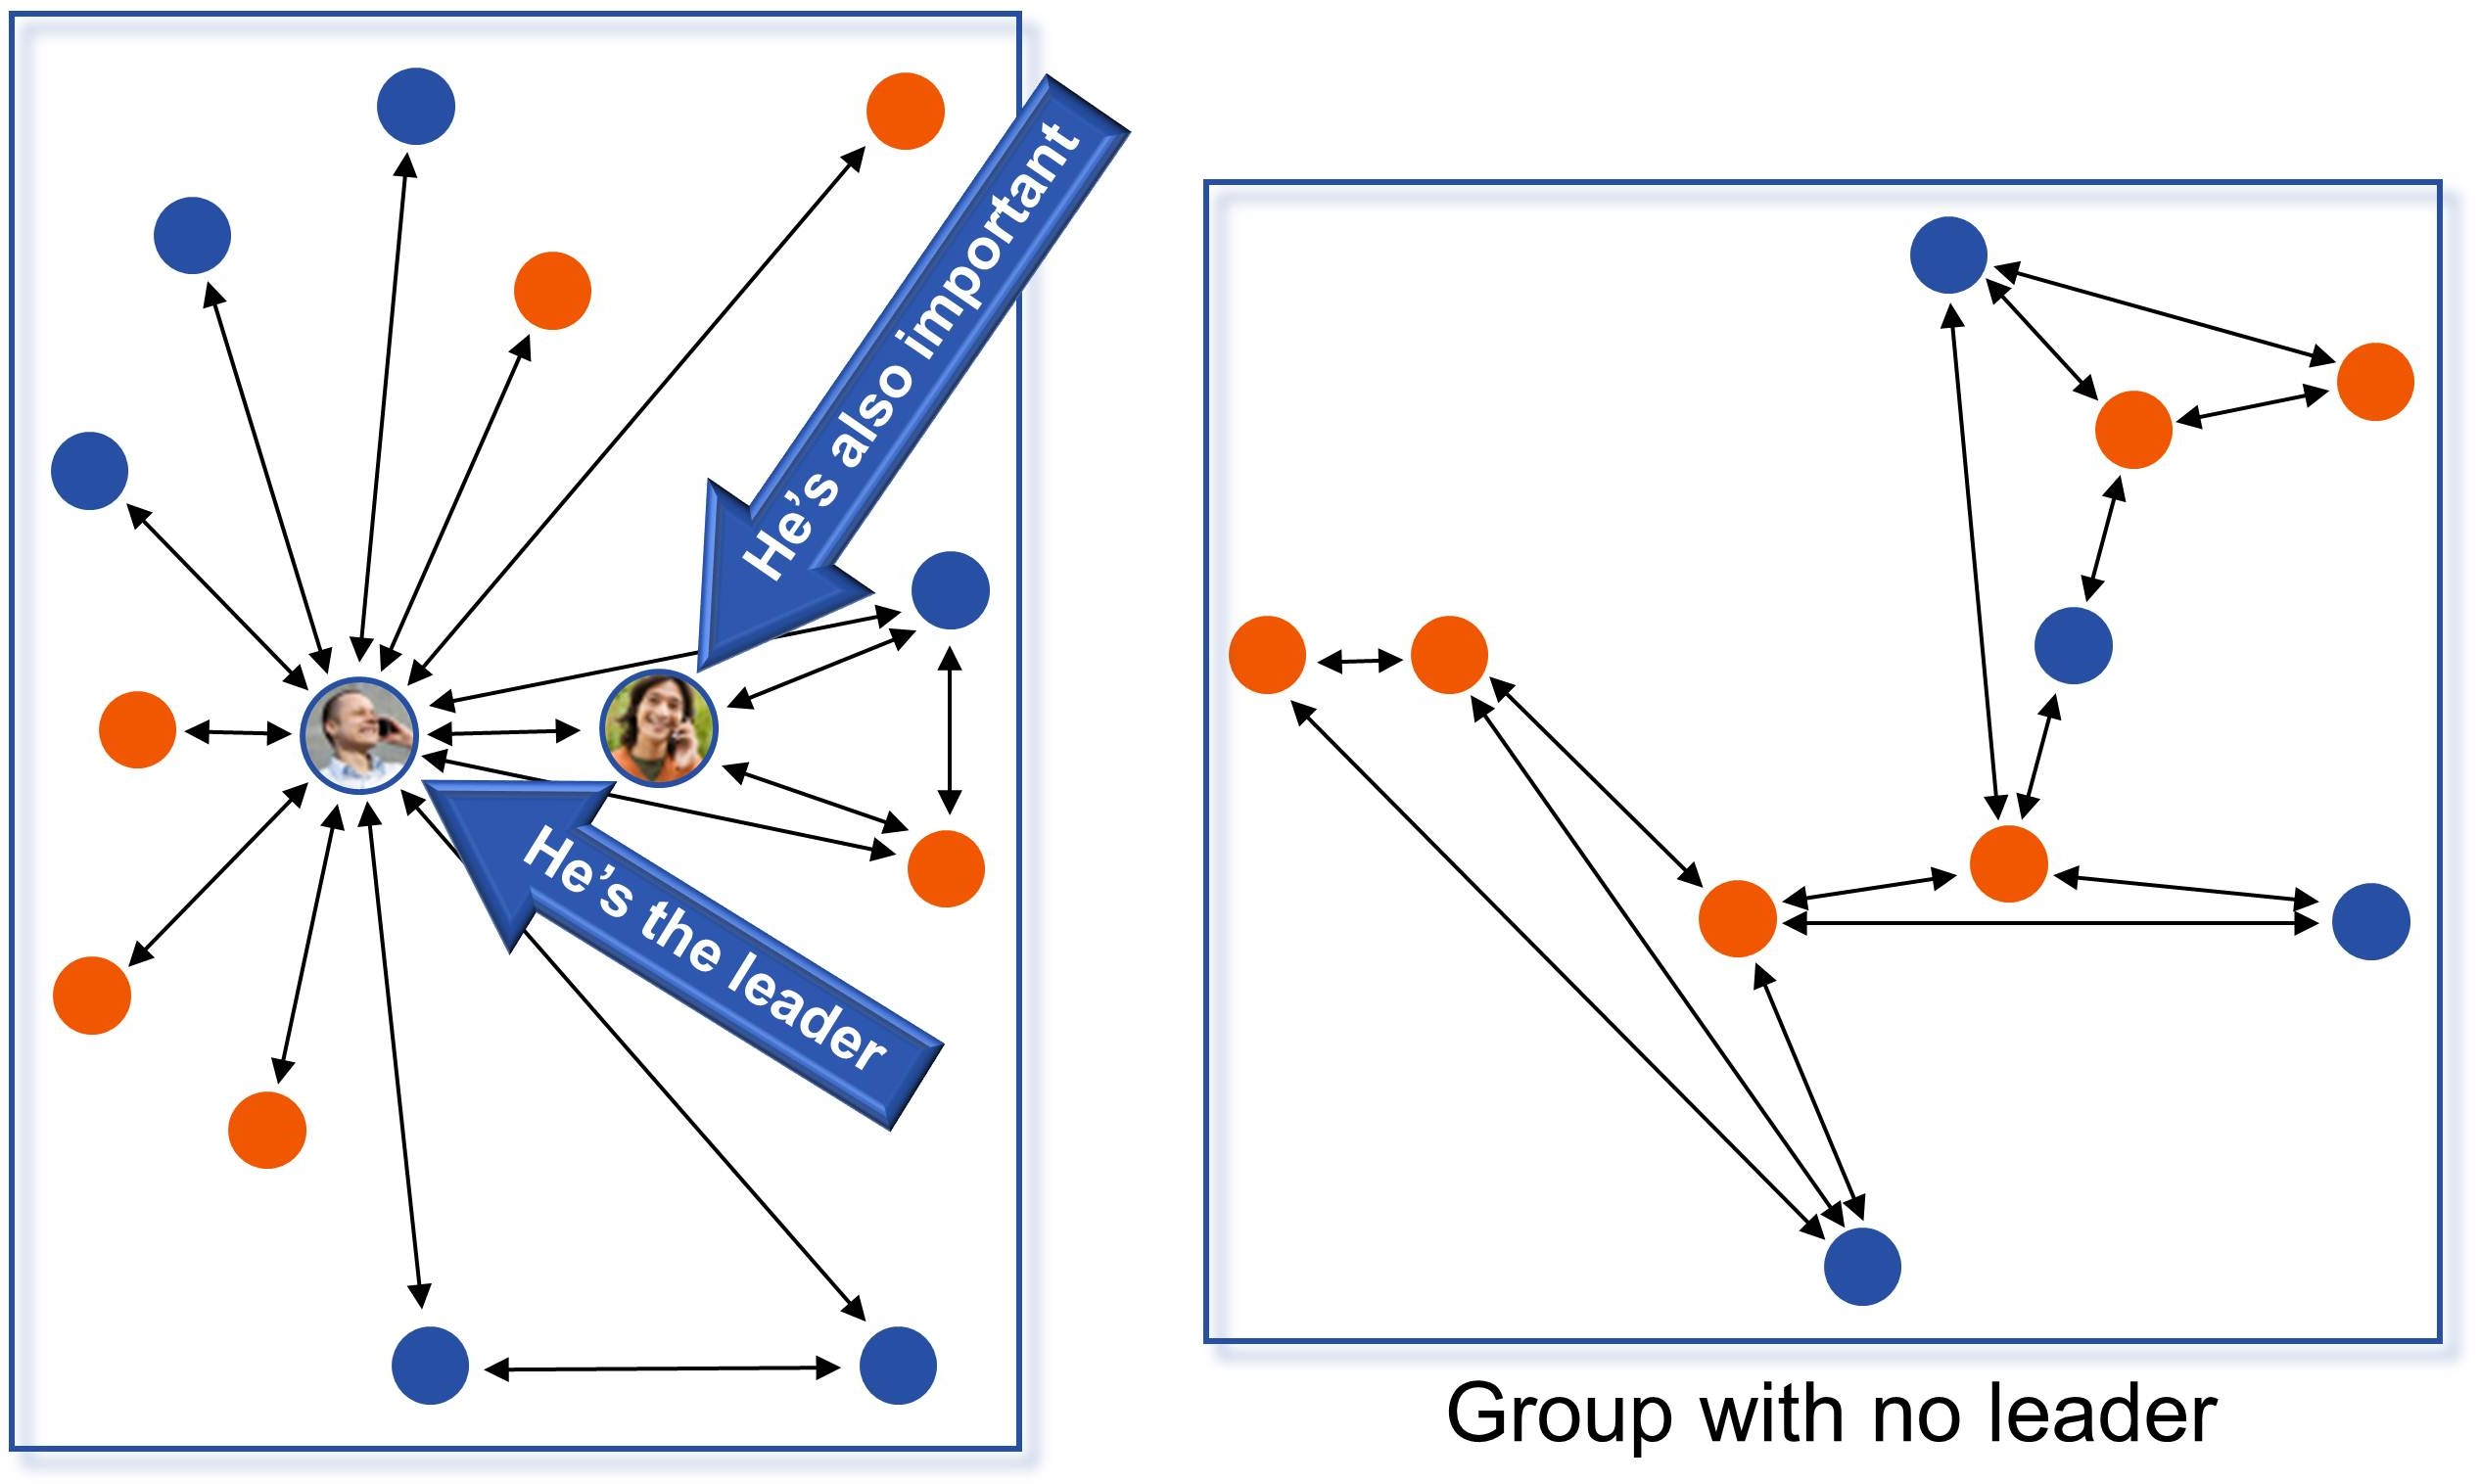
Figure 2: Leaders in a communications network
How do we identify the leaders? IBM Research conducted a series of experiments with CSPs.2 Call detail records, which carry information about person A calling person B, were analyzed. By synthesizing call information and abstracting communications networks, we discovered webs of communications across individuals. We also used the customer churn information to correlate churn among leaders to subsequent churn among followers. Here are some of the highlights from one of the experiments I helped conduct:
- Leaders were 1.2 times more likely to churn compared with non-leaders.
- There were two types of leaders: disseminating leaders who were connected to their group through outgoing calls, and authority leaders who were connected through a larger proportion of incoming calls.
- When a disseminating leader churned, additional churns were 28.5 times more likely. When an authority leader churned, additional churns were 19.9 times more likely.
- Typically, there was a very limited time between leaders' churn and the followers' churn.
Social groups can be inferred from any type of communication—emails, SMS texts, calls, Facebook friendships, and so on. It is interesting to see strong statistics associated with leaders' influence on the group.
There are many ways to utilize social networks to influence purchase and reuse:
- Studying consumer experience—A fair amount of this data is unstructured. By analyzing the text for sentiments, intensity, readership, related blogs, referrals, and other information, we can organize the data into positive and negative influences and their impact on the customer base.
- Organizing customer experience—We can provide reviews to a prospective buyer, so they can gauge how others evaluated the product.
- Influencing social networks—We can provide marketing material, product changes, company directions, and celebrity endorsements to social networks, so that social media may influence and enhance the buzz.
- Feedback to products, operations, or marketing—By using information generated by social media, we can rapidly make changes in the product mix and marketing to improve the offering to customers.
Society has always played a major role in our evaluation process. However, the Internet and social networking have radically altered our access to information. I may choose to "like" a product on Facebook, and my network now has instant access to this action. If I consider a restaurant worth its money, Yelp can help me broadcast that fact worldwide. If I hate the new cell phone service from a CSP, I can blog to complain about it to everyone.
Automation
Interactive Voice Response (IVR), kiosks, mobile devices, email, chat, corporate websites, third-party applications, and social networks have generated a fair amount of event information about the customers. In addition, customer interactions via traditional media such as call centers can now be analyzed and organized. The biggest change is in our ability to modify the customer experience using software policies, procedures, and personalization, making self-service increasingly customer friendly.
Sales and marketing have received their biggest boost in instrumentation from Internet-driven automation over the past 10 years. Browsing, shopping, ordering, and customer service on the Web not only has provided tremendous control to users but also has created an enormous flood of information to the marketing, product, and sales organization in understanding buyer behavior. Each sequence of Web clicks can be collected, collated, and analyzed for customer delight, puzzlement, dysphoria, or outright defection. More information can also be obtained about sequence leading up to a decision.
Self-service has crept in through a variety of means: IVRs, kiosks, handheld devices, and many others. Each of these electronic means of communication acts like a gigantic pool of time-and-motion studies. We have data available on how many steps customers took, how many products they compared, and what attributes they focused on, such as price, features, brand comparisons, recommendations, defects, and so on. Suppliers have gained enormous amounts of data from self-service and electronic sensors connected to products. If I use a two-way set-top box to watch television, the supplier has instant access to my channel-surfing behavior. Did I change the channel when an advertisement started? Did I turn the volume up or down when the jingle started to play? If I use the Internet to shop for a product, my click stream can be analyzed and used to study shopping behavior. How many products did I look at? Did I view the product description or the price when looking at the product? This enriched set of data allows us to analyze customer experience in the minutest detail.
What are the sources of data from such self-service interactions?
- Product—As products become increasingly electronic, they provide a lot of valuable data to the supplier regarding product use and product quality. In many cases, suppliers can also collect information about the context in which a product was used. Products can also supply information related to frequency of use, interruptions, usage skipping, and other related aspects.
- Electronic touch points—A fair amount of data can be collected from the touch points used for product shopping, purchase, use, or payment. IVR tree traversals can be logged, Web click streams can be collected, and so on.
- Components—Sometimes, components may provide additional information. This information could include data about component failures, use, or lack thereof. For example, a wireless CSP can collect data from networks, cell towers, third parties, and handheld devices to understand how all the components together provided a good or bad service to the customer.
Monetization
From a Big Data Analytics perspective, a "data bazaar" is the biggest enabler to create an external marketplace, where we collect, exchange, and sell customer information. We are seeing a new trend in the marketplace, in which customer experience from one industry is anonymized, packaged, and sold to other industries. Fortunately for us, Internet advertising came to our rescue in providing an incentive to customers through free services and across-the-board opt-ins.
Internet advertising is a remarkably complex field. With over $26 billion in 2010 revenue,3 the industry is feeding a fair amount of startup and initial public offering (IPO) activity. What is interesting is that this advertising money is enhancing customer experience. Take the case of Yelp, which lets consumers share their experiences regarding restaurants, shopping, nightlife, beauty spas, active life, coffee and tea, and others.4 Yelp obtains its revenues through advertising on its website; however, most of the traffic is from people who access Yelp to read customer experience posted by others. With all this traffic coming to the Internet, the questions that arise are how is this Internet usage experience captured and packaged and how are advertisements traded among advertisers and publishers.
Big Data Analytics is creating a new market, where customer data from one industry can be collected, categorized, anonymized, and repackaged for sale to others:
- Location—As we discussed earlier, location is increasingly available to suppliers. Assuming a product is consumed in conjunction with a mobile device, the location of the consumer becomes an important piece of information that may be available to the supplier.
- Cookies—Web browsers carry enormous information using web cookies. Some of this may be directly associated with touch points.
- Usage data—A number of data providers have started to collect, synthesize, categorize, and package information for reuse. This includes credit-rating agencies that rate consumers, social networks with blogs published or "Like" clicked, and cable companies with audience information. Some of this data may be available only in summary form or anonymized for the protection of customer privacy.
Terence Kawaja has been studying this market for a number of years and has characterized a number of markets and associated players. "Terence Kawaja has a new way for potential investors to visualize it," says Wall Street Journal writer Amir Efrati. "The market involves hundreds of small and large companies that help advertisers reach consumers and help website publishers, mobile-application developers, search engines, and other digital destinations generate revenue through advertising. Kawaja, who runs the investment firm LUMA Partners, spent months putting together six new graphics that show how 1,240 different companies fit into the following categories of online advertising: display, video, search engines, mobile, social, and commerce."5 I have replicated Kawaja's Social Media LUMA Scape in Figure 3. For the rest of the LUMA Scapes, visit Kawaja's website: www.lumapartners.com. A number of intermediaries play key roles in developing an advertising inventory, auctioning of the inventory to the ad servers, and facilitating the related payment process, as the advertisements are clicked and related buying decisions are tracked.
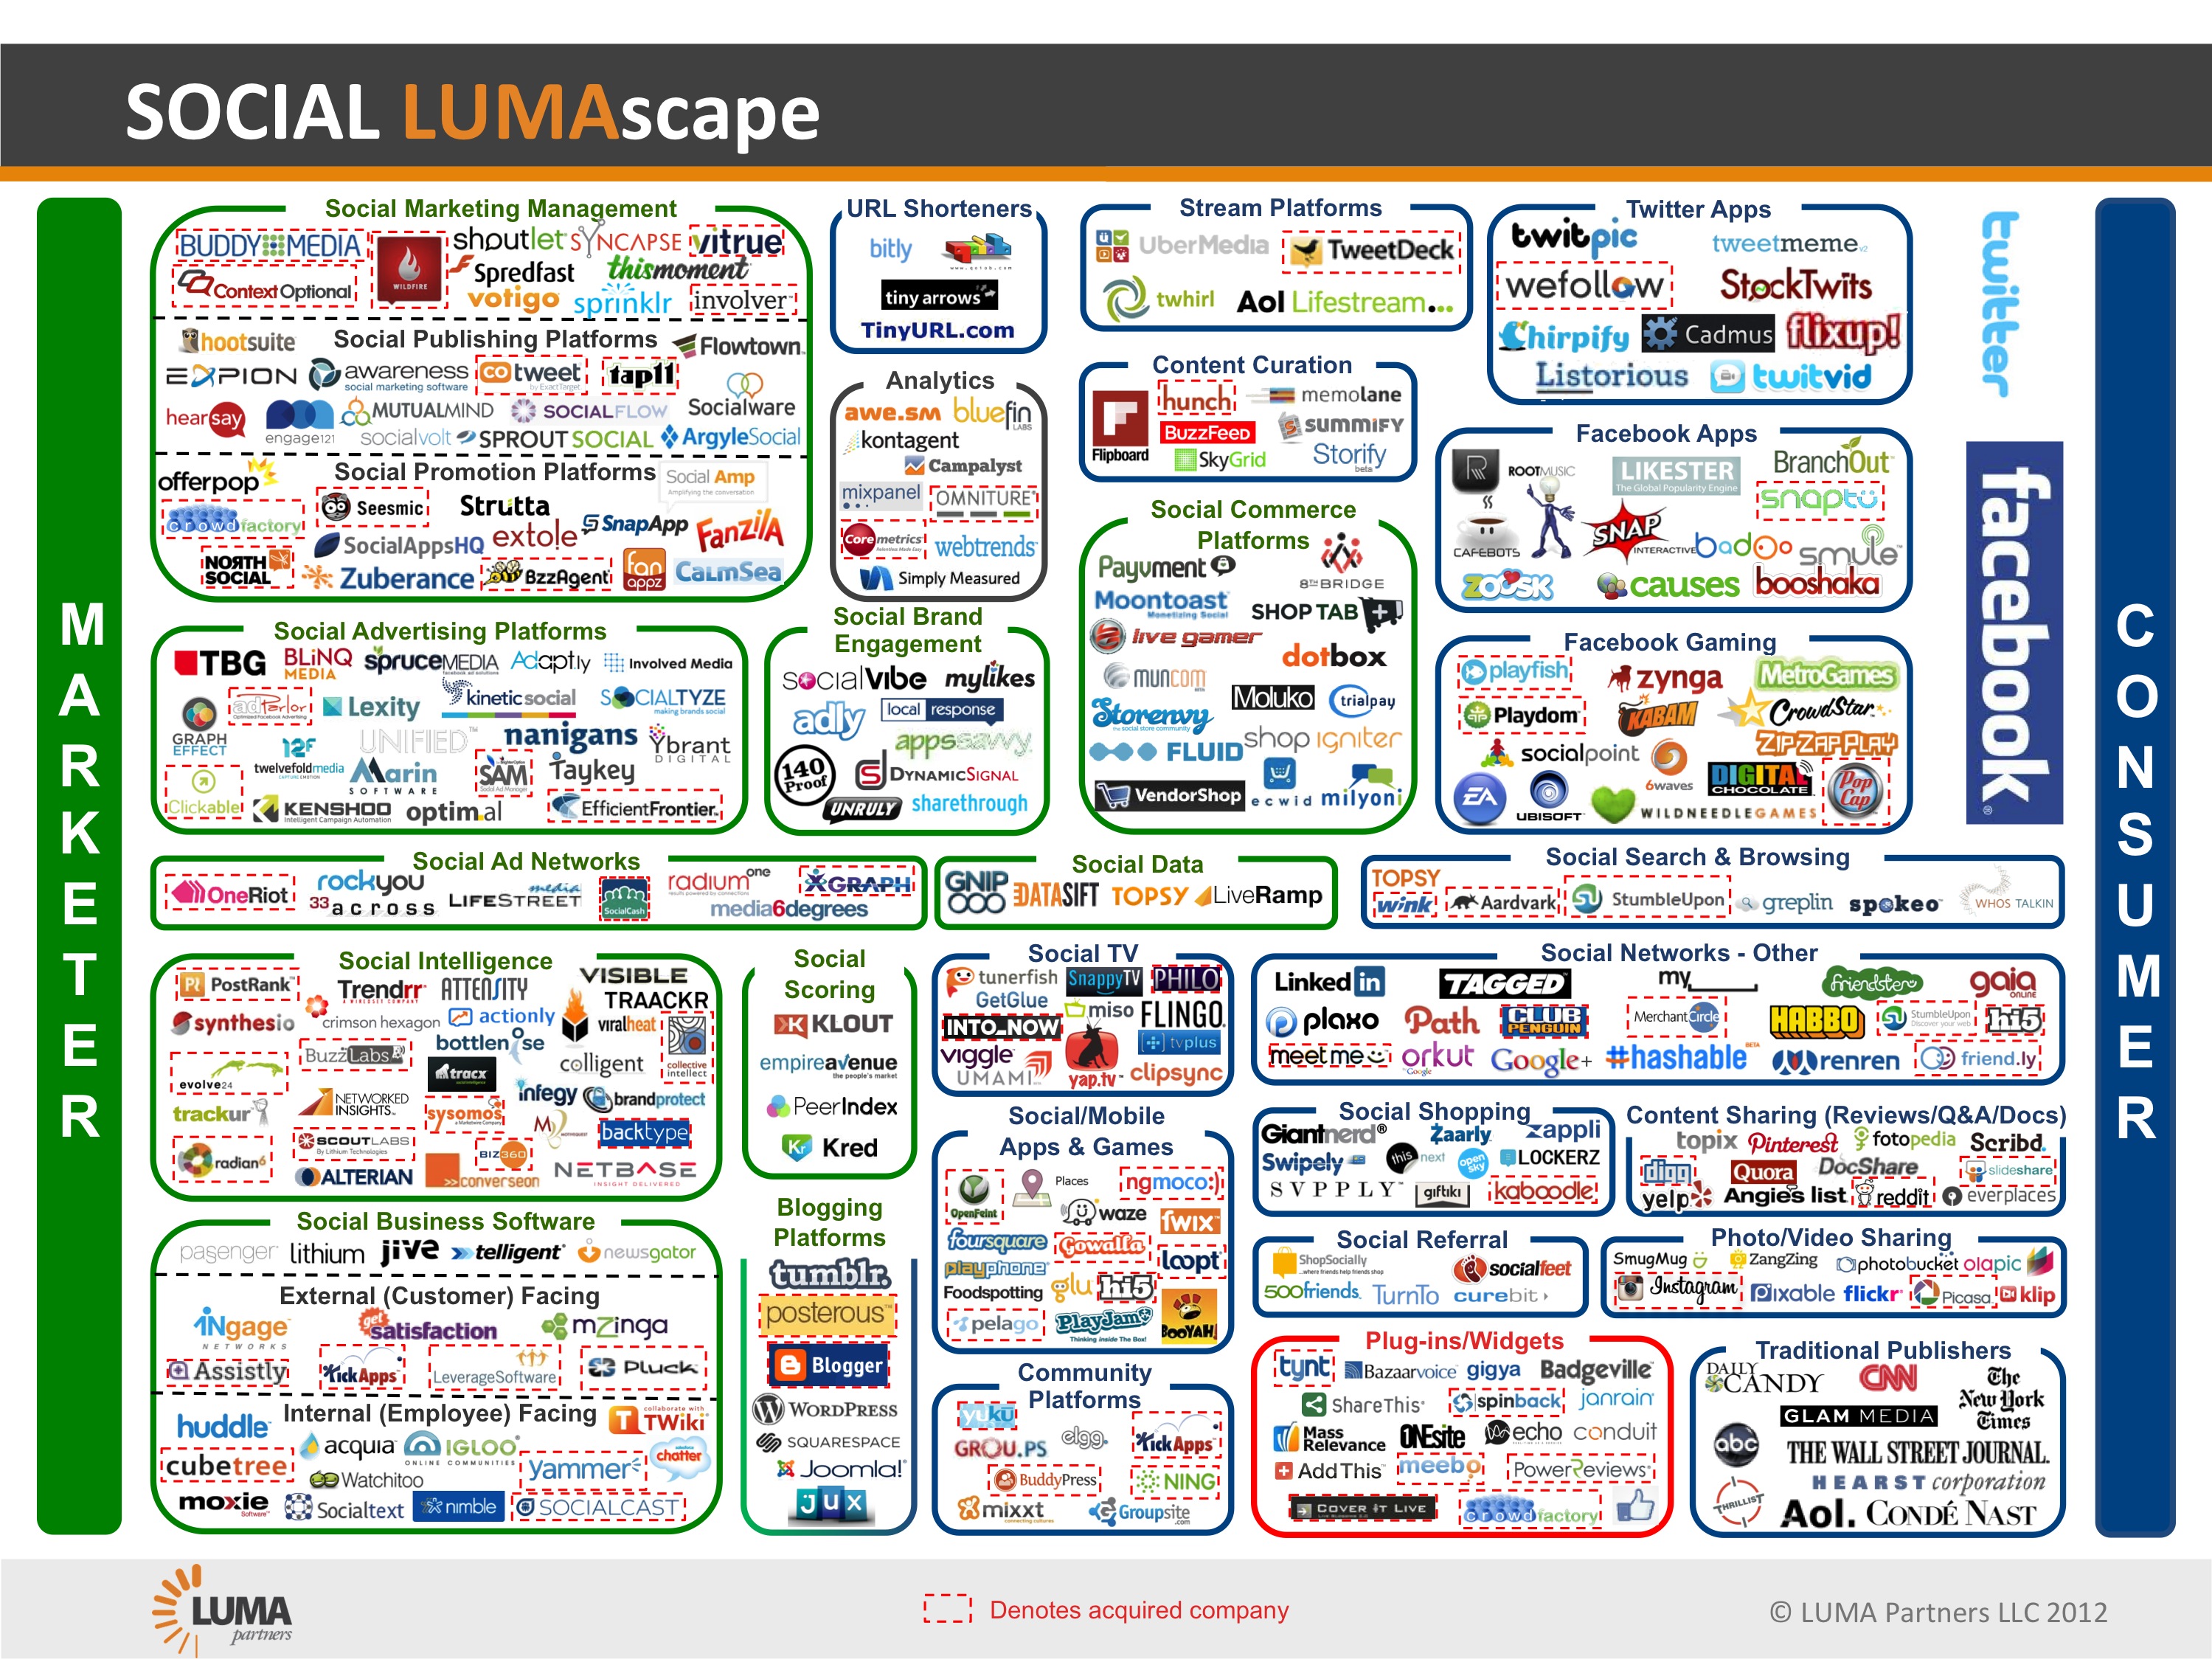
Figure 3: LUMA Scape for social media (reprinted with permission)
Notes
1. Rob Van Den Dam, Global Telecom Consumer Survey, IBM Institute for Business Value, 2011.
2. Ibid.
3. http://www.iab.net/about_the_iab/recent_press_releases/press_release_archive/press_release/pr-041311.
5. Amir Efrati, "Online Ads: Where 1,240 Companies Fit In," Wall Street Journal, June 6, 2011.

Dr. Arvind Sathi is the Global Communication Sector Lead Architect for IBM's Information Agenda team. He received his PhD in Business Administration from Carnegie Mellon University and worked under Nobel Prize winner Dr. Herbert A. Simon. Dr. Sathi is a seasoned professional with more than 20 years of leadership in Information Management architecture and delivery. His primary focus has been in the delivery and architecture oversight of IT projects to communications organizations. He has extensive experience with many domestic and international communications service providers and other services industries.
Before joining IBM, Dr. Sathi was the pioneer in developing knowledge-based solutions for CRM at Carnegie Group. At BearingPoint, he led the development of Enterprise Integration, MDM, and Operations Support Systems/Business Support Systems (OSS/BSS) solutions for the communications market and also developed horizontal solutions for communications, financial services, and public services. At IBM, Dr. Sathi has led several Information Management programs in MDM, data security, business intelligence, and related areas and has provided strategic architecture oversight to IBM’s strategic accounts. He has also delivered a number of workshops and presentations at industry conferences on technical subjects including MDM and data architecture, and he holds patents in data masking.
MC Press books written by Arvind Sathi available now on the MC Press Bookstore.
 |
Big Data Analytics Get a practitioner’s advice on how to succeed with Big Data analytics. List Price $16.95 Now On Sale
|
|
 |
Customer Experience Analytics Improve customer relationships, products, and processes with CEA. Now On Sale
|


 More than ever, there is a demand for IT to deliver innovation. Your IBM i has been an essential part of your business operations for years. However, your organization may struggle to maintain the current system and implement new projects. The thousands of customers we've worked with and surveyed state that expectations regarding the digital footprint and vision of the company are not aligned with the current IT environment.
 TRY the one package that solves all your document design and printing challenges on all your platforms. Produce bar code labels, electronic forms, ad hoc reports, and RFID tags – without programming! MarkMagic is the only document design and print solution that combines report writing, WYSIWYG label and forms design, and conditional printing in one integrated product. Make sure your data survives when catastrophe hits. Request your trial now! Request Now.
 Forms of ransomware has been around for over 30 years, and with more and more organizations suffering attacks each year, it continues to endure. What has made ransomware such a durable threat and what is the best way to combat it? In order to prevent ransomware, organizations must first understand how it works.
 Disaster protection is vital to every business. Yet, it often consists of patched together procedures that are prone to error. From automatic backups to data encryption to media management, Robot automates the routine (yet often complex) tasks of iSeries backup and recovery, saving you time and money and making the process safer and more reliable. Automate your backups with the Robot Backup and Recovery Solution. Key features include:
 Business users want new applications now. Market and regulatory pressures require faster application updates and delivery into production. Your IBM i developers may be approaching retirement, and you see no sure way to fill their positions with experienced developers. In addition, you may be caught between maintaining your existing applications and the uncertainty of moving to something new.
 IT managers hoping to find new IBM i talent are discovering that the pool of experienced RPG programmers and operators or administrators with intimate knowledge of the operating system and the applications that run on it is small. This begs the question: How will you manage the platform that supports such a big part of your business? This guide offers strategies and software suggestions to help you plan IT staffing and resources and smooth the transition after your AS/400 talent retires. Read on to learn:
LATEST COMMENTS
MC Press Online