


DB2 for i5/OS: A Perfect Platform to Implement the Proposed Methodology
DB2 for i5/OS has all the major components required to deploy robust business intelligence solutions. So let's talk about DB2's built-in technologies that provide the plumbing necessary to implement the methodology outlined in the first article. For each step in the proposed methodology, we will highlight the built-in System i capabilities that make it extremely easy and cost-efficient to implement the given step. Only where necessary will we discuss software products that are not part of a typical i5/OS installation. For example, to implement the data modeling step, we picked IBM Rational Data Architect.
Create and Refine the Data Model and Design the Data Warehouse
As mentioned, a data model is used to represent the business entities, defining what they look like and how they relate to one another. The technical and business leaders need to agree on common definitions and entities. The decisions and models need to be documented and available for refining and tuning. The IBM Rational Data Architect (RDA) is a tool that is well-suited to aid in this iterative process. RDA is a data-modeling tool designed to assist data architects in understanding information assets and their relationships and dependencies, and then map assets to each other. With RDA, you can create new schemas or automatically generate mapping models of existing schemas. The mapping models document entities and relationships. In addition, you can define a set of transformations using built-in functions and generate SQL scripts that can be deployed directly to the target System i machine. Figure 1 illustrates the RDA workbench with the Data Perspective open.
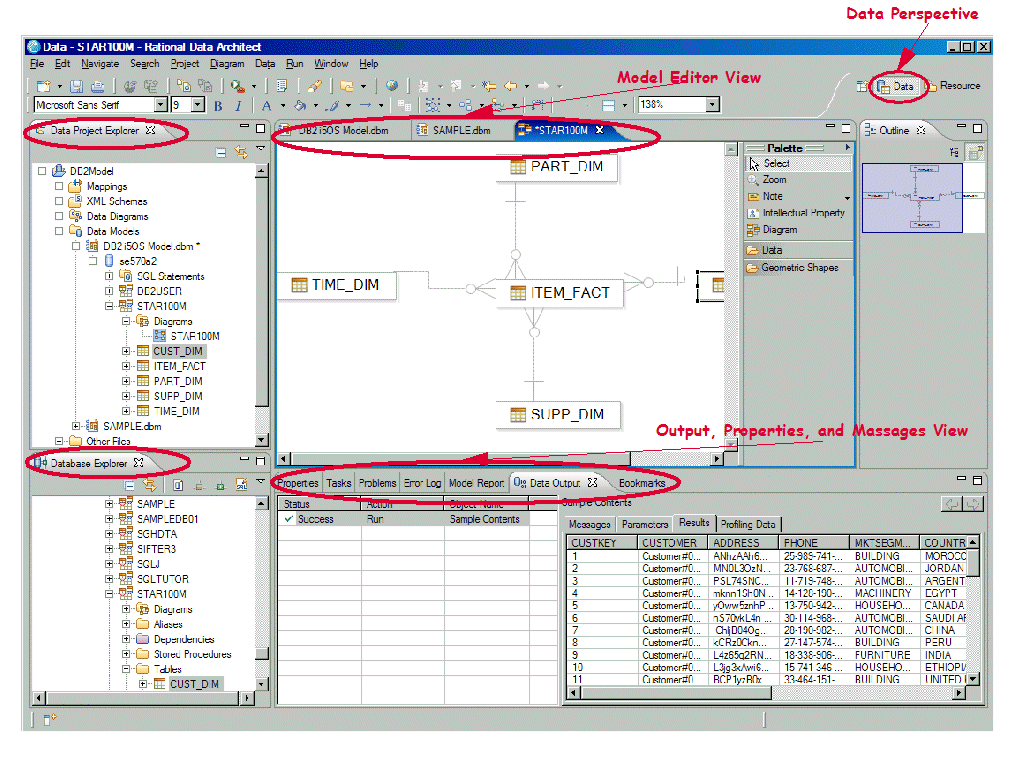
Figure 1: This is what the RDA Data Perspective looks like. (Click images to enlarge.)
The Data perspective harbors the following views that a data architect would use:
Data Project Explorer View
This view is used to work locally with database objects. It allows you to perform the following tasks:
- Create and modify data design projects that include both logical and physical data models, create scripts, etc.
- Transform logical data models to physical data models
- Generate DDL scripts for data models or individual database objects
- Copy database objects from Database Explorer
- Create SQL statements progamatically using the syntax-aware SQL editor or graphically with the SQL Builder wizard.
Database Explorer View
With this view, you can perform the following tasks:
- Create database connections
- View and browse database objects
- Execute routines such as stored procedures and user-defined functions
- Generate DDL statements
Model Editor View
This view is used to visualize and edit objects that are contained in data projects. It can be used to do the following:
- Add or modify data model objects by using the palette or the diagram surface
- Add notes or text objects to the diagram to document information about model objects or relationships
- Add geometric shapes to the diagram that contain text or that visually group diagram objects together
The Model Editor view in Figure 1 shows the physical data model for our sample data mart that resides in STAR100M schema on DB2 for i5/OS. The model has been created from the existing schema using the RDA's reverse engineering wizard.
Output, Properties, and Messages View
This view is the main communications area of the workbench. It has several tabbed panels containing, among others, the following views:
- Data Output View includes an action list and the result of the action. For example, in Figure 1, the Result tab displays the sample content for a table.
- Properties View displays the basic properties of a selected resource, such as database object or routine.
Design the Data Mart
Typically, data marts are implemented using the dimensional data model. In this model, the schema is made up of dimensions surrounding a central fact table. Other names for the dimensional model are the "star join" or "snowflake schema"; this is because of the shape formed by the tables in the model.
Dimension tables contain descriptive information about a given aspect of the business. For example, time dimension contains attributes related to time, such as month, day, and so on. Often, the dimension attributes constitute a hierarchy. For example, one possible hierarchy in the time dimension is year->quarter->month->day.
The fact table contains the basic numerical transaction-level data from the business. The values stored in the fact table are often referred to as "measures" or "additive facts." These measures occur at the intersection of all the dimensions.
A sample star schema is illustrated in Figure 2.
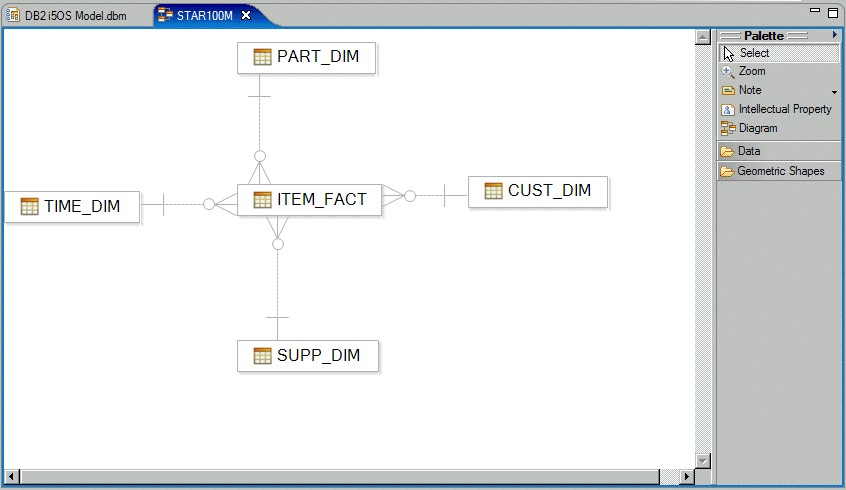
Figure 2: Here's an example of a star schema.
Figure 2 shows one central fact table named ITEM_FACT and four dimension tables: TIME_DIM, PART_DIM, CUST_DIM, and SUPP_DIM.
DB2 for i5/OS facilitates the efficient implementation of a star schema data model through the following built-in functionality:
Materialized Query Table (MQT)
An MQT is a DB2 table that contains the results of a query, along with the query's definition. An MQT can also be thought of as a materialized view or automatic summary table that is based on an underlying table or set of tables. These underlying tables are referred to as the "base" tables. By running the appropriate aggregate query one time (by using the base tables and then storing the results so that they are accessible on subsequent requests), you can enhance data processing and query performance significantly.
MQTs are a powerful way to improve response time for complex SQL queries, especially queries that involve some of the following:
- Aggregated or summarized data that covers one or more subject areas
- Joined and aggregated data covering a set of tables
- A commonly accessed subset of rows (that is, a specific piece of data)
Though MQTs can be directly specified in a user's query, their real power comes from the query optimizer's ability to recognize the existence of an appropriate MQT implicitly and to rewrite the user's query to use that MQT. The query accesses the MQT (instead of accessing one or more of the specified tables). This shortcut can drastically minimize the amount of data read and processed (Figure 3).
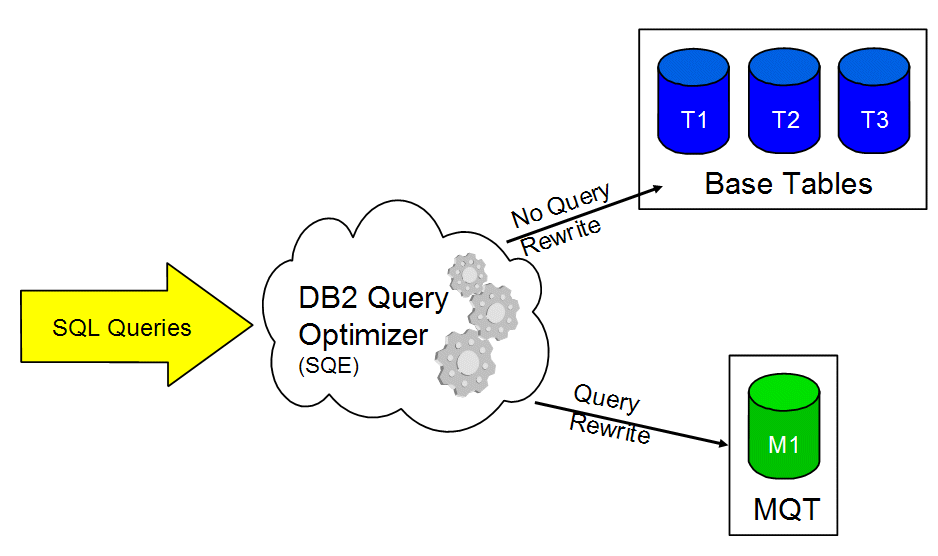
Figure 3: Here's your Materialized Query Table in action.
The data marts that use the star schema data model are very good candidates for MQT creation and usage. The design process involves identifying hierarchies and grouping criteria. Consider for example the time hierarchy described at the beginning of this section. Let's assume there are 100 million rows in the central fact table that represent three years of evenly distributed sales data. We can identify the following distinct levels in the hierarchy:
- 3 years
- 12 quarters (3 years x 4 quarters)
- 36 months (3 years x 12 months)
- 156 weeks (3 years x 52 weeks)
- 1095 days (3 years x 365 days)
Executing a query that groups all 100 million rows by the most-detailed level (Day), results in only 1095 distinct groups. Yet, continually processing all 100 million rows is time-consuming and resource-intensive. This is where designing an MQT is valuable.
By providing an MQT that represents all the data grouped by Year / Quarter / Month / Week / Day, the query optimizer can rewrite the query to use the MQT instead of the base transaction table. Rather than reading and processing 100 million rows, the database engine reads and processes only 1095 rows from the MQT, resulting in a significant boost in performance.
Look-ahead Predicate Generation (LPG)
Queries executed against the star schema data model may pose performance challenges to traditional relational databases. The problem is that, in this environment, the selection criteria are typically defined through the dimension tables. Conversely, there is no local selection criteria defined for the fact table. So a very large number of rows in the fact table (often billions of rows) would have to be accessed to produce the join result. This process will result in high resource utilization (both CPU and I/O) and very long response times. Luckily, DB2 has in its arsenal an innovative and extremely efficient strategy to process such a request: Look-ahead Predicate Generation (LPG).
With LPG, selection on the fact table is derived from local selection on some or all the dimension tables. In other words, the query optimizer can look ahead to generate local selection predicates for the fact table from the local selection defined for the dimension tables. Then, the database can select a narrow range of rows in the fact table by finding the intersection of some or all of the dimension table's local selection and join keys. These concepts are illustrated in Figure 4.
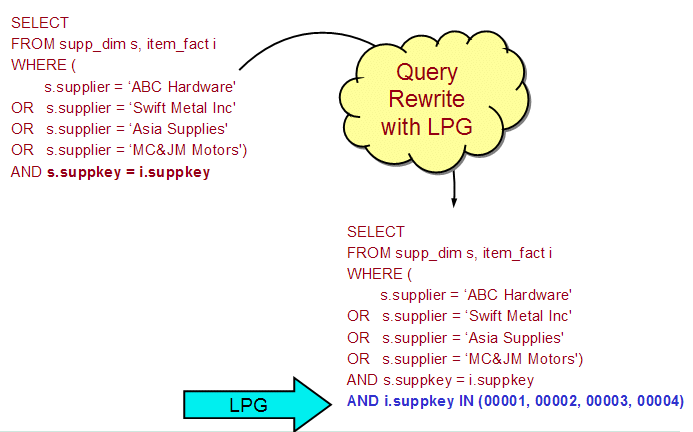
Figure 4: This example shows Look-ahead Predicate Generation (LPG).
In Figure 4, the original query has been rewritten by the DB2 query optimizer to transform the local selection predicates in SUPP_DIM table into a list of corresponding keys in the ITEM_FACT table. Let's assume that there is an index over the SUPPKEY column in the ITEM_FACT table. Now, the optimizer can convert the table scan access method for ITEM_FACT to, in this case, the much more efficient key-row positioning access method that will read only the rows required to complete the join. The performance improvement can be quite dramatic.
LPG is typically used with star or snowflake join queries; however, it can be used with any join query.
Select the Data Mart Tool
In this step, you evaluate the tools and select which tool the users will use to access, analyze, and visualize the information. IBM has recently announced the availability of DB2 Web Query for System i , which is the strategic replacement for the ubiquitous Query/400. We believe that fairly soon a lot of the System i customers will have this product installed on their machines.
DB2 Web Query is a modern query and reporting tool that runs natively in i5/OS. The product features are grouped into several tiers. The fundamental functionality such as Report Assistant, Graph Assistant, Query/400 Adapter, and Power Painter are included in the base product (5733-QU2). The DB2 Web Query functionality can further be enhanced by purchasing from IBM optional features such as OLAP, Developer Workbench, and Active (offline and disconnected) Reports. Finally, additional features such as Report Caster can be obtained directly from DB2 Web Query parent company Information Builders.
Let's take a quick look at a couple of the most important features from the BI point of view:
Report Assistant
This browser-based tool allows you to create new queries as well as modify existing query definitions, including imported Query/400 queries. A graphical interface with drag-and-drop functionality is used to design reports in which dimensions can be sorted and grouped and aggregation functions can be applied to measures. You can further enhance the visual appeal of the report by applying headings, footings, subtotals, page breaks, etc. The reports can be parameterized and chained for drill-down capability. The tool also sports an impressive list of output formats, including PDF, MS Excel with and without formulas, as well as DB2 files.
Figure 5 illustrates a typical Report Assistant design session.

Figure 5: Here's a typical Report Assistant session.
In Figure 5, the list of measures and dimensions (meta data) for our sample star schema is presented in the Available Fields panel. The data entities can be dragged from this panel and dropped into Sort by, Summary, or Sort across panels. The Sort by panel contains the list of dimensions and measures used for grouping, sorting, and ranking. The Summary panel contains the list of measures that are used for aggregation. The Field Options panel is used to specify sort attributes as well as select options such as font, traffic light definition, and so forth. The report definition can be saved so that other authorized users can run it at their convenience. By default, the report results are rendered in a Web browser, as shown in Figure 6.
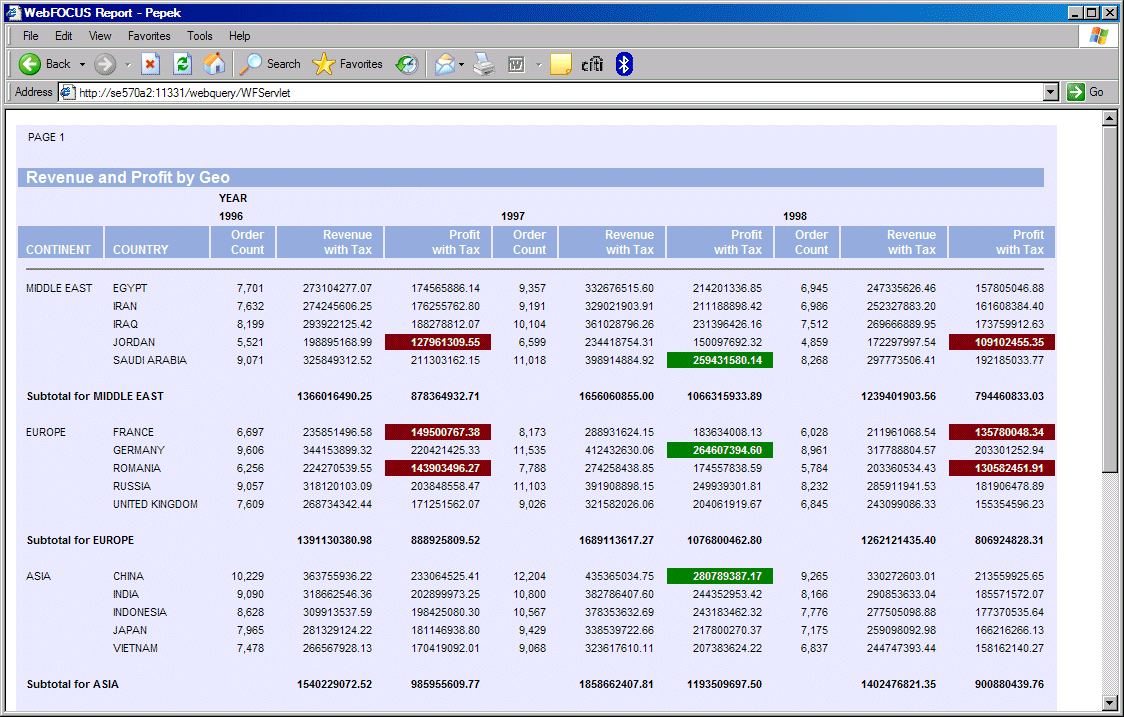
Figure 6: Report results are rendered in a Web browser.
The report in Figure 6 presents revenue and profit by country subtotaled by geography. The data is sorted across by year. The traffic lights are used to highlight profits greater than 250 million (green light) or less than 150 million (red light). The measures are formatted with the currency sign and commas.
OLAP Module
This module allows you to slice and dice data across all dimensions and measures so that you can interact with reports dynamically. A standard report created with Report Assistant, such as the one shown in Figure 6, can be OLAP-enabled by virtually one mouse-click. All you need to do is to enable the OLAP functionality on the Report Assistant GUI. Before activating this feature, however, the hierarchies within dimensions must be known to the DB2 Web Query engine. The Developer Workbench is used to define these hierarchies. Figure 7 shows the hierarchies that we defined for our sample star schema database:
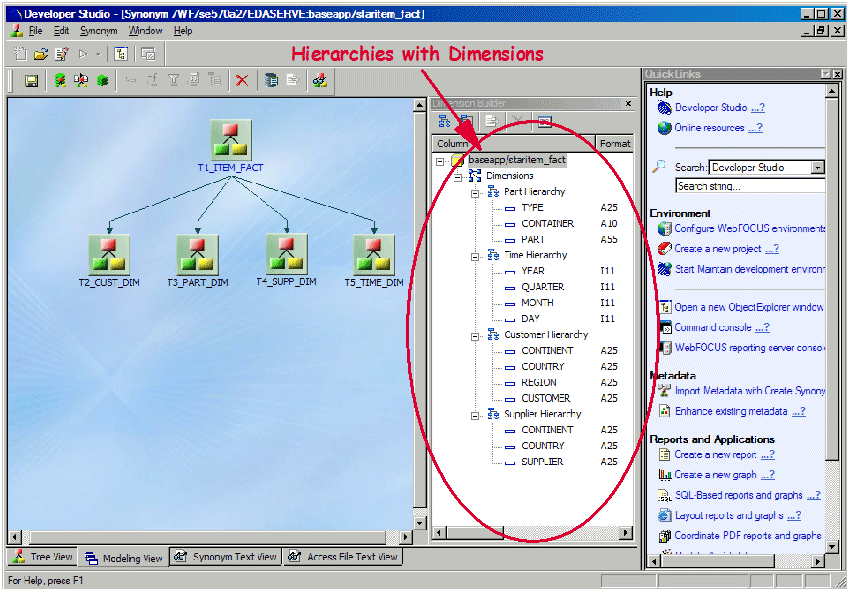
Figure 7: Define hierarchies in Developer Workbench.
Once the hierarchies are defined, all subsequent reports that query the sample database can be easily OLAP-enabled. For example, the OLAP-enabled version of the previously discussed Revenue and Profit by Geo report is illustrated in Figure 8.
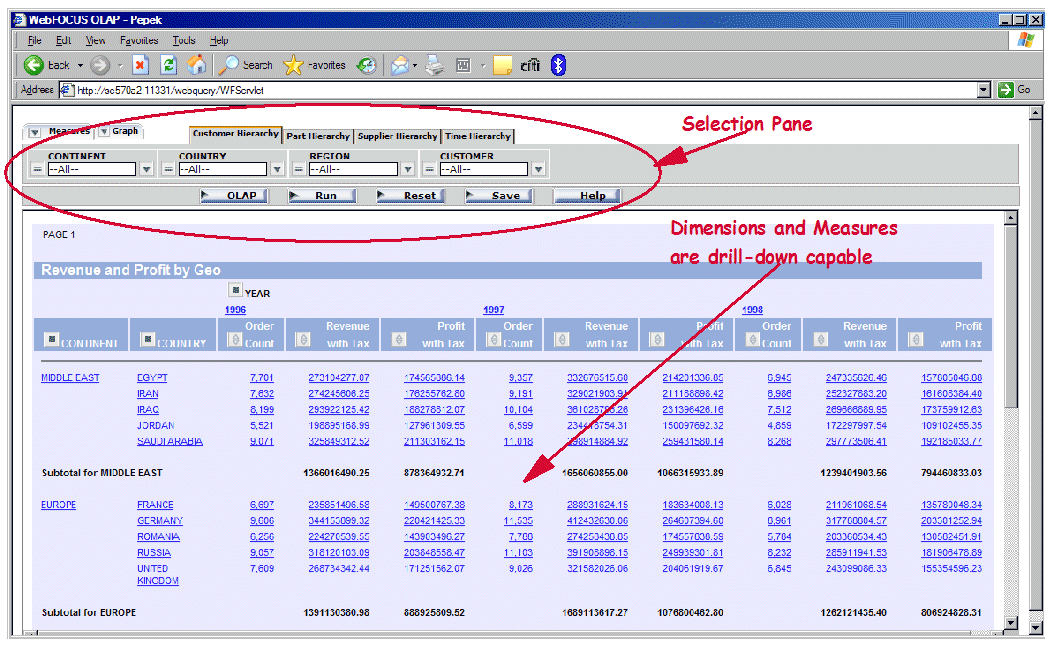
Figure 8: This report is OLAP-enabled.
Notice in Figure 8 the presence of the Selection Pane. This pane contains tabs for all the dimensions. Each tab, in turn, contains the hierarchy of the data entities as defined through the Developer Workbench. You can easily specify the selection criteria by using the pull-downs. The pull-downs list all distinct values for a given data entity (column). Notice also that the dimensions and measures are drill-down-capable. For example, by clicking Egypt, we obtain the list of all suppliers from this country along with their revenue and profit. In addition, column headings have either a blue square or an arrow. The blue square allows you to drag and drop the column to rearrange its position on the report or pivot it. The arrows allow you to sort the measures (or other numeric columns).
Source the Data for the Data Warehouse and the Data Mart
In this step, we focus on capturing data from the transactional systems and loading it into the data warehouse. And if the BI architecture dictates, the process can also involve capturing data from the data warehouse and loading it into the data marts. In total, the process is referred to as extract, transform, and load (ETL), representing the major functions required. In addition to utilizing one of the many ETL solutions available, it is also possible to develop your own ETL application, especially given the very open nature of DB2 for i5/OS. To read and write data directly to or from a table, you can employ SQL requests that are dynamic, static, and/or embedded in a high-level language program. You can employ DRDA, ODBC, JDBC, or CLI connectivity options. You can write standard SQL stored procedures or external stored procedures in one of the many languages supported by i5/OS, such as RPG, COBOL, C, C++, or Java.
To support a process that involves capturing only changes (i.e., transactions) to the source tables, i5/OS journaling (i.e., database logging) is the starting point. As the rows in the table are inserted, updated, or deleted, the transactional information is placed in a local journal receiver. The ETL process can extract the information from the journal receiver and apply it to the target table in the data warehouse or data mart. Given the common use of another system or logical partition (LPAR) to support the BI solution, the process must also involve transporting the changes from the operational system to the data warehouse system. The good news is that i5/OS provides a very elegant answer—namely, remote journaling. The remote journaling support built into i5/OS provides the transportation mechanism to send the journal entries from the local receiver to a receiver on the data warehouse system or LPAR. This process is fast and efficient, allowing the ETL process to run mainly on the data warehouse system, thus avoiding additional overhead on the line-of-business transactional system.
For large amounts of data, parallelism provides benefits in the area of throughput and performance. When transforming and loading large sets of rows, an application that employs parallel processing will be required. System i running i5/OS has the ability to handle multiple concurrent jobs or threads, allowing very scalable and efficient parallel processing, especially when two or more processors are available.
In addition to the other popular ETL solutions available in the marketplace, IBM offers a robust and scalable set of tools within WebSphere Datastage and WebSphere Qualitystage.
Tune the Data Warehouse and Data Mart
In this step, we evaluate the ETL system's performance, as well as the analysis, query, and reporting mechanisms. This involves implementing a proper indexing strategy as well as evaluating the potential for implementing materialized query tables. DB2 for i5/OS provides a wide range of capabilities that are vital for a well-performing BI solution. We will now briefly cover the most important aspects of the tuning process:
Indexing
On any platform, good database performance depends on good design. And good design includes a solid understanding of indexes and column statistics: the quantity to build, their structure and complexity, and their maintenance requirements.
DB2 for i5/OS provides two types of indexes that can be used in a number of sophisticated access methods:
Radix Index—A radix index is a multilevel, hybrid tree structure that allows a large number of key values to be stored efficiently while minimizing access times. A key compression algorithm assists in this process. The radix tree structure is very good for finding a small number of rows because it is able to find a given row with a minimal amount of processing. For example, an index created over the customer number field would be considered the perfect index to find individual customer data because it allows the database to zero in on the rows it needs and perform a minimal number of I/Os.
Encoded Vector Index (EVI)—EVI is the result of an IBM research initiative so far available exclusively on DB2 for i5/OS. It provides functionality superior to traditional bitmap indexes on other database platforms while at the same time eliminating inherent bitmap deficiencies. An EVI is a data structure that is stored as basically two components: the symbol table and the vector. The symbol table contains a distinct key list, along with statistical and descriptive information about each distinct key value in the index. The symbol table maps each distinct value to a unique code. The other component, the vector, contains a byte code value for each row in the table. This byte code represents the actual key value found in the symbol table and the respective row in the database table. The optimizer can use the symbol table to obtain statistical information about the data and key values represented in the EVI. If the optimizer decides to use an EVI to process the local selection of the query, the database engine uses the vector to build a dynamic bitmap, which contains one bit for each row in the table. DB2 can use several dynamic bitmaps to perform ANDing and ORing to satisfy an ad hoc query. EVIs are ideally suited for the BI environment because they work best where there is a need for data aggregation and dynamic drill-down capability.
The DB2 for i5/OS optimizer can effectively use both types of indexes to create efficient access plans. So how would you know what indexes to create? The simplest answer is to rely on the optimizer feedback and its index advice function.
Index Advisor
DB2 continually generates, collects, and groups index advice based upon the queries being executed. The index advice contains a recommendation for a permanent index that possibly would improve performance. This index advice information is available for a system or database administrator through several interfaces:
- Database monitor SQL traces
- Visual Explain
- SQL Plan Cache
- iSeries Navigator's Index Advisor facility
We cover database monitor, Visual Explain, and SQL Plan Cache in the next section. Here, we outline a simple scenario that utilizes the iSeries Navigator's Index Advisor. While using the OLAP Revenue and Profit by Geo report (covered above), we noticed visibly slower performance when drilling down along the time dimension. To see if there is any index advice for table TIME_DIM in schema STAR100M, in the main iSeries Navigator Window, we right-click the icon representing the database on our system and from the context menu select Index Advisor-> Condense Advised Indexes. This produces the dialog shown in Figure 9, where we quickly locate the two indexes advised for TIME_DIM table. Now, we can right-click one of the entries pertaining to that table to create the necessary index.
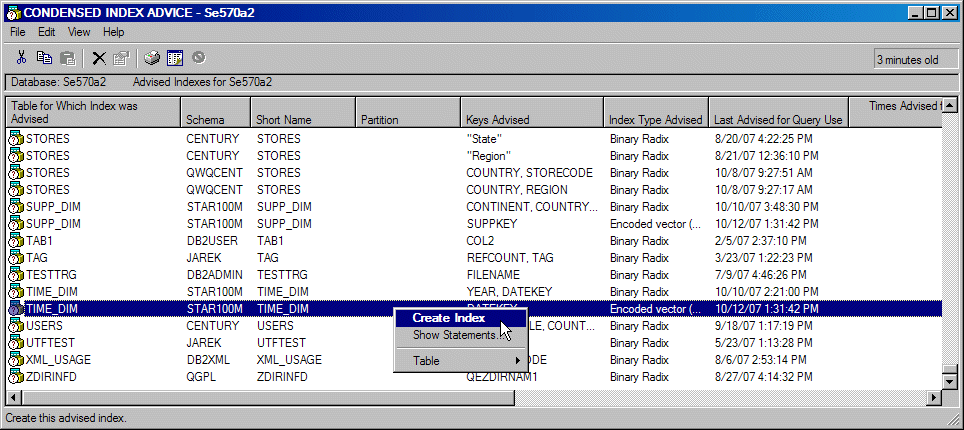
Figure 9: Locate indexes with Condensed Index Advice.
The SQL performance tuning is both science and art. IBM Rochester offers an excellent four-day workshop that covers all aspects of SQL performance for DB2 for i5/OS.
Monitor Usage and Maintain the Data Warehouse and Data Mart
Monitoring and maintaining the BI solution and its use are key to providing ongoing value and return on investment. Every time an SQL statement is executed on DB2, the database engine collects statistics that describe the performance characteristics of a given statement. This data can then be presented to the system or database administrator through one of various feedback mechanisms. The rich set of feedback options available with DB2 for i5/OS is shown in Figure 10.
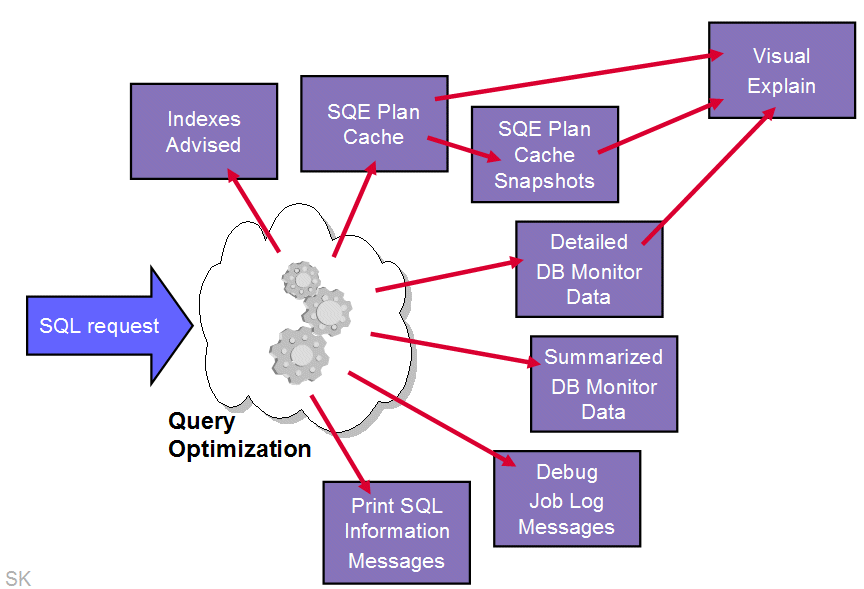
Figure 10: You can choose from a variety of DB2 feedback mechanisms.
Let's examine several feedback utilities that provide analysts with detailed insights into the DB2 engine workings.
SQE Plan Cache
SQE Plan Cache is an internal DB2 for i5/OS structure that caches query implementation plans (access plans) for queries optimized by the SQE Optimizer. Here are the most important features of the SQL Plan Cache:
- It's always "on" and is less invasive than other tools such as database monitor.
- It allows more reuse of existing plans, regardless of interface for identical SQL statements.
- It has room for about 6,000–10,000 SQL statements
- Plans are stored in a compressed mode.
- Up to three plans can be stored per SQL statement.
- Access is optimized to minimize contention on plan entries across the system.
- Cache is automatically maintained to keep most active queries available for reuse.
- It offers a foundation for a self-learning query optimizer to interrogate the plans to make wiser costing decisions.
The content of the cache can be viewed and analyzed through the iSeries Navigator GUI interface. You can use this interface to identify the most commonly run queries and understand their performance characteristics. In addition, the information in the cache can be captured and stored in a so-called SQE Plan Cache snapshot. A snapshot is basically a database monitor file that can be saved, restored, and analyzed with database monitor tools. The snapshot can be taken either manually though iSeries Access GUI or programmatically through a stored procedure or an exit program. For example, you can use the exit point QIBM_QWC_PWRDWNSYS to call QSYS2.DUMP_PLAN_CACHE each time the PWRDWNSYS command is issued. The periodically taken snapshots can then be used for trend analysis or performance tuning.
Database Monitor
The detailed Database Performance Monitor is an integrated tool used to collect database-specific performance information for SQL requests being run on DB2. The collected data is stored in a database table. The reports or queries can then be run against the collected data to analyze query access plans and the performance behavior of the database requests. Here's a list of typical questions that can be answered by analyzing database monitor traces:
- Which queries are the most time-consuming?
- How many queries rebuild access plans?
- Which queries are performing full table scans?
- How many temporary indexes have been created over a particular table?
- Which user is running the longest-running queries?
- Has the implementation of a particular query changed with the application of a PTF or a new release? (This is a before/after comparison of the monitor data.)
Visual Explain
Visual Explain provides a graphical representation of the access plan chosen by the optimizer to implement a given SQL request. The request is broken into the individual steps necessary to execute that request. Each access method is represented by an icon. The icons are arranged into a graph that represents the sequence in which individual steps are executed. In addition, Visual Explain includes information about the database objects that are considered and chosen by the query optimizer. The detailed graph representation of the query makes it easy to understand which access method for which database object contributes the most to the total query execution cost.
Here's a simple walkthrough that shows how we could use the DB2 feedback tools to perform the performance trend analysis. Let's suppose the data in our sample data mart is refreshed daily. Before new data is loaded, we use the System i Navigator to take the SQE Plan Snapshot and store it in the database monitor format. To limit the amount of data stored in the snapshot and thus make it more manageable, we filter the statements in the SQE Plan Cache so that only statements that run against the STAR100M schema are saved. Periodically, we use the Analyze Snapshot dialog to compare performance signatures for two or more snapshots. This is shown in Figure 11.
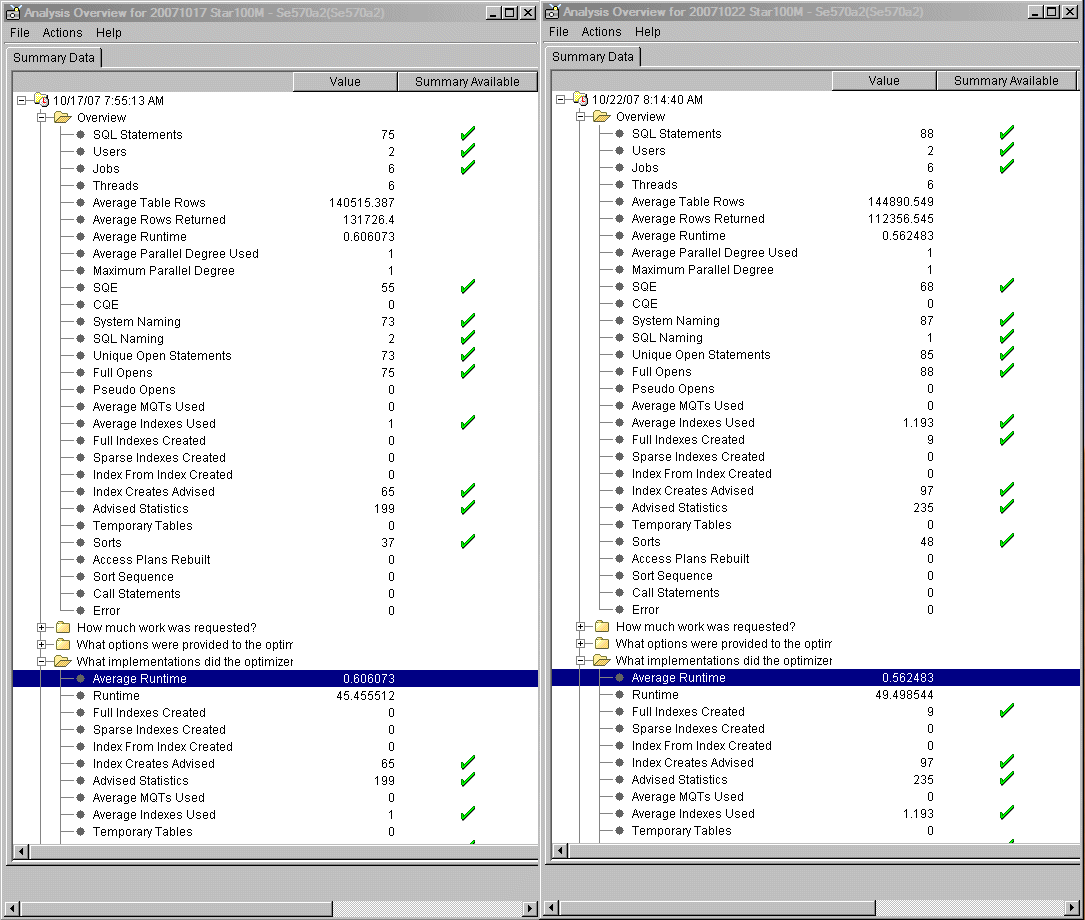
Figure 11: Compare two SQE Plan Cache snapshots.
In Figure 11, the analyses of two snapshots are compared side by side. This allows us to visualize the most important aspects of the SQL workloads run against the STAR100M schema over a period of time. We can check the total number of different statements executed, the average response times, the total elapsed CPU times, the average number of rows in tables queried, and so forth. This allows us to quickly pinpoint any problem areas.
In addition, we can use the Compare Snapshots feature to compare the workloads statement by statement. This is illustrated in Figure 12.
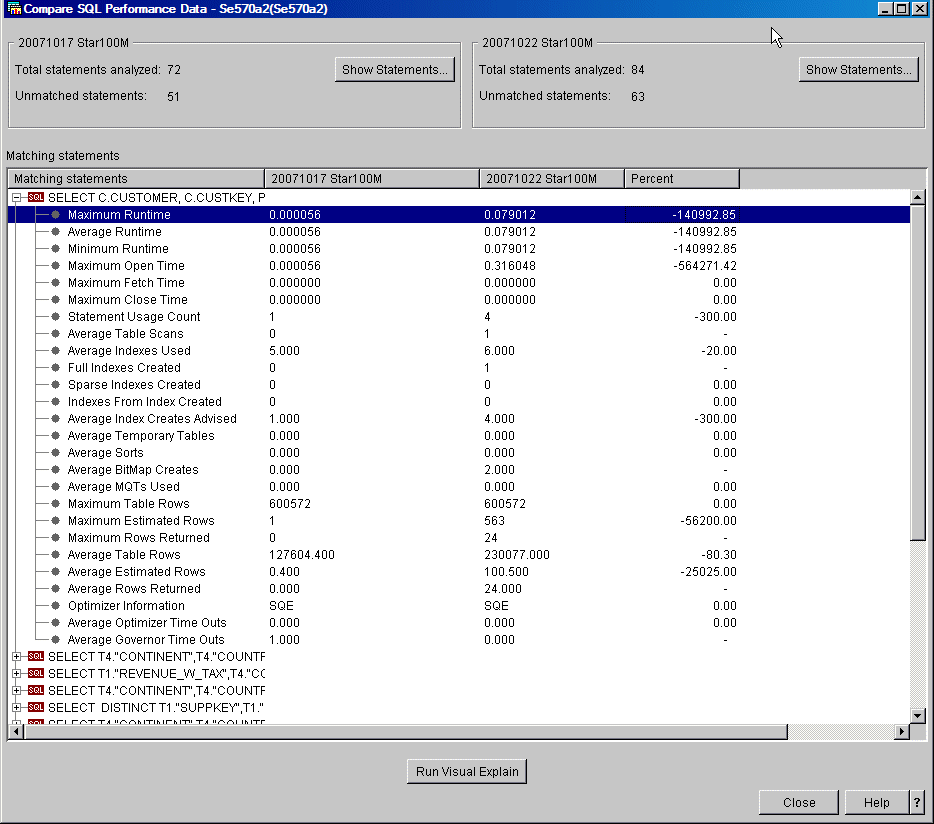
Figure 12: Here's an example of an SQL performance comparison for two snapshots.
The dialog in Figure 12 shows those statements for which the performance worsened (or improved) over the time. In this case, the performance of the first statement on the list is slower by several orders of magnitude. This obviously raises a red flag. To further analyze the problem, we click the Run Visual Explain button, which renders the Visual Explain graphs for both periods under consideration. This is shown in Figure 13.

Figure 13: Compare access plans in Visual Explain.
A quick analysis of the access plans in Figure 13 allows us to identify the problem. The access plan has changed. The access method for the TIME_DIM has changed from Index Probe to Table Scan. A check of the meta data for that object shows that an index that was previously used for the Index Probe access method does not exist any more. The Index Advise feature available directly from the Visual Explain dialog tells us what index to create.
Isn't performance monitoring and tuning on DB2 for i5/OS easy?
Go Forth
With a good methodology and the support of a robust and scalable data-centric infrastructure, you are on the way to providing real business value. System i for BI provides distinct advantages because of its integration of world-class hardware, the i5/OS operating system, and the DB2 for i5/OS database management system. These easy-to-install, easy-to-maintain, and easy-to-upgrade attributes allow you to get on with solving business problems.
Additional Material
The following publications can be helpful to those who want to learn more about the topics covered in this article:
- "Putting Business Intelligence at Your Fingertips, Part I," MC Press
- "The power of Rational Data Architect," IBM developerWorks
- "Creating and using materialized query tables (MQT) in IBM DB2 for i5/OS," white paper
- "The Power and Magic of LPG," MC Press
- "Star Schema Join Support within DB2 UDB for iSeries," white paper
- Getting started with DB2 Web Query for System i, SG24-7214, ITSO Redbook
- OnDemand SQL Performance Analysis Simplified on DB2 for i5/OS in V5R4, SG24-7326, ITSO Redbook


 More than ever, there is a demand for IT to deliver innovation. Your IBM i has been an essential part of your business operations for years. However, your organization may struggle to maintain the current system and implement new projects. The thousands of customers we've worked with and surveyed state that expectations regarding the digital footprint and vision of the company are not aligned with the current IT environment.
 TRY the one package that solves all your document design and printing challenges on all your platforms. Produce bar code labels, electronic forms, ad hoc reports, and RFID tags – without programming! MarkMagic is the only document design and print solution that combines report writing, WYSIWYG label and forms design, and conditional printing in one integrated product. Make sure your data survives when catastrophe hits. Request your trial now! Request Now.
 Forms of ransomware has been around for over 30 years, and with more and more organizations suffering attacks each year, it continues to endure. What has made ransomware such a durable threat and what is the best way to combat it? In order to prevent ransomware, organizations must first understand how it works.
 Disaster protection is vital to every business. Yet, it often consists of patched together procedures that are prone to error. From automatic backups to data encryption to media management, Robot automates the routine (yet often complex) tasks of iSeries backup and recovery, saving you time and money and making the process safer and more reliable. Automate your backups with the Robot Backup and Recovery Solution. Key features include:
 Business users want new applications now. Market and regulatory pressures require faster application updates and delivery into production. Your IBM i developers may be approaching retirement, and you see no sure way to fill their positions with experienced developers. In addition, you may be caught between maintaining your existing applications and the uncertainty of moving to something new.
 IT managers hoping to find new IBM i talent are discovering that the pool of experienced RPG programmers and operators or administrators with intimate knowledge of the operating system and the applications that run on it is small. This begs the question: How will you manage the platform that supports such a big part of your business? This guide offers strategies and software suggestions to help you plan IT staffing and resources and smooth the transition after your AS/400 talent retires. Read on to learn:
LATEST COMMENTS
MC Press Online