


Version 1.1.2 of DB2 Web Query is teeming with product improvements. New features such as InfoAssist, the JD Edwards adapter, and RIA can help you create eye-popping reports.
On December 10, 2010, a new and improved version of DB2 Web Query for i was made generally available to the IBM i community. Packaged as 1.1.2, this exciting new release is chock-full of improvements and goodies that will make your experience using this product even more enjoyable than before. A major emphasis in this release was to improve the "out of the box" experience by making the development tools easier to use while improving query performance, but other areas were addressed as well. In fact, there are so many new features that I cannot describe them all in this article. So I am going to focus on the following major product improvements:
- InfoAssist development tool
- JD Edwards application adapter
- Performance improvements
- Join improvements
- Option to select output format at run time
- New output formats
- Ability to create rich Internet applications
- Simplified work management
- DB2 Web Query extensions (from IBM Lab Services)
As with all other DB2 Web Query product upgrades, this release is available at no charge for those customers that are current on their DB2 Web Query Software Maintenance Agreement.
InfoAssist Development Tool
For those of you wondering why IBM has a separate Software Maintenance Agreement (SWMA) for DB2 Web Query, the answer lies in our commitment to continually reinvest in the product and deliver enhancements that improve and evolve the product. The proof of this can be found in the introduction of InfoAssist, an exciting new development tool that is so much fun to use, you just might have a hard time putting it away to work on other projects.
InfoAssist is the strategic DB2 Web Query development tool that combines most of the features of Report Assistant and Graph Assistant (as well as many of the features in Power Painter) into a single integrated development tool. It is a Web-based development tool that uses Bindows libraries and Asynchronous JavaScript and XML (AJAX) technology to provide a Rich Internet Application (RIA) for report development. With InfoAssist, you can create simple queries—as well more sophisticated reports, charts, and dashboards—from multiple sources. You can convert reports to charts and vice versa as well as instantly convert both charts and reports into documents to create business intelligence dashboards.
Because InfoAssist is the strategic DB2 Web Query development tool going forward, it will receive all the new features and functions. It is important to understand that those same enhancements may not be included in future releases of Report Assistant, Graph Assistant, and Power Painter.
Improved Interface
The first thing that you will notice about the InfoAssist tool is the general user interface: it is a vast improvement over its predecessors. Similar to the Microsoft Office products, it uses a ribbon graphical user interface (GUI) that provides a way to pack many options and features into a simple interface. Also referred to as a "Multi-Level Cluster toolbar," the concept of a ribbon GUI is to provide a toolbar with various high-level control elements. Each element, when selected, reveals a secondary set of icons within icon groups that are functionally relevant to the element selected. This "ribbon" design reduces the overall number of clicks, keystrokes, and mouse movements that are required to build a report.
Consider the two screenshots shown below. In Figure 1, the report developer has selected the Format control element; therefore the underlying ribbon exposes settings that relate to report format options, such which output type to direct the output to, the destination type (report or graph), and navigation features such Pages on Demand and Table of Contents.
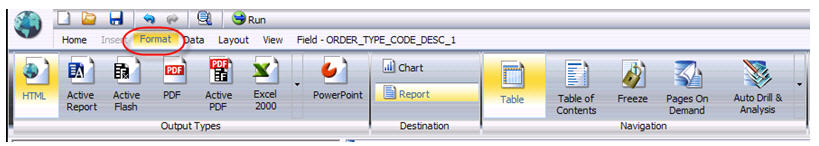
Figure 1: The "ribbon" feature shows the options relevant to the menu item selected. (Click images to enlarge.)
In Figure 2, the developer has switched to the Data control element; thus, the underlying ribbon changes to reveal data-specfic options such as creating define and compute fields, specifying file join specifications, and adding report filtering options.
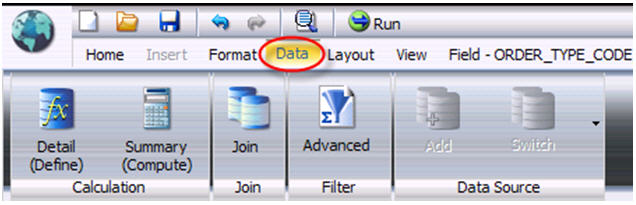
Figure 2: This example of the ribbon feature shows a different selection and therefore a different list of options.
With this approach, the developer is quickly and easily able to find specific features and settings. In the previous development tools, those settings might have been buried deep in a hidden Properties panel, and the developer might have had difficulty finding them.
Visual Design
The report development experience for InfoAssist will be a more enjoyable one for many. Because it employs a visual design that is often referred to as "What You See Is What You Get" (WYSIWYG), report developers can build reports by dragging and dropping columns into the Interactive Design View pane and instantly see the results. As shown in Figure 3, they can even create instant reports with minimal effort by holding down the keyboard's Ctrl key, selecting multiple columns, and dragging them over.
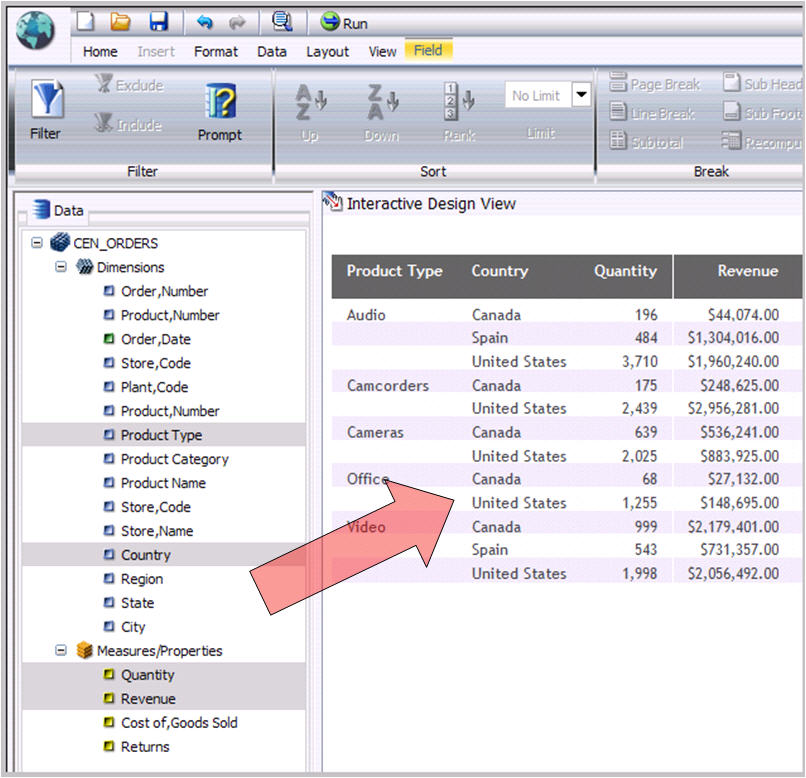
Figure 3: The WYSIWYG, drag-and-drop capability makes creating reports easy.
Based on the data type of the column, InfoAssist will automatically attempt to define the sort and measure columns of the report. For example character fields are assumed to be the Sort By (dimension) columns in the report, while numeric fields are assumed to be measures that are summed by each of the Sort By columns. However, if this is not the desired outcome (for example, you would like to sort by a numeric field), you can easily modify the report accordingly.
Transforming Reports to Charts
If you have ever created a report with various columns and selection criteria and later wished you had used those same specifications to create a graph instead, you will love the transform feature. As shown in Figure 4, such a transformation is but a mere click away by selecting the Chart icon.
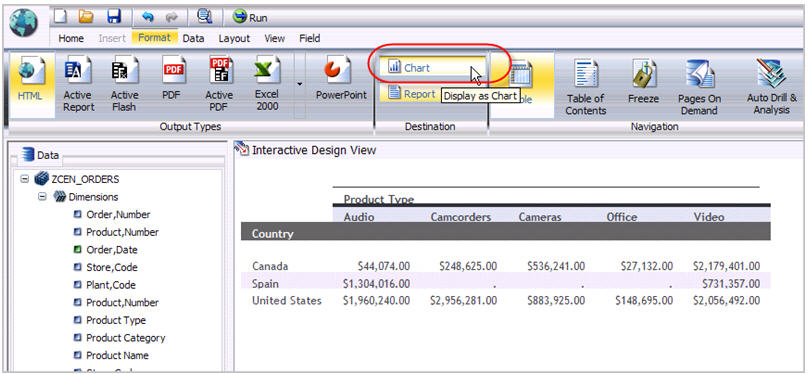
Figure 4: It's simple to create a graph from your report data.
Once the interactive design view is refreshed, you see the report converted into a bar chart, as shown in Figure 5. This chart can be easily changed to a different type, such as a pie or line chart, by clicking on the appropriate icon in the Format ribbon.
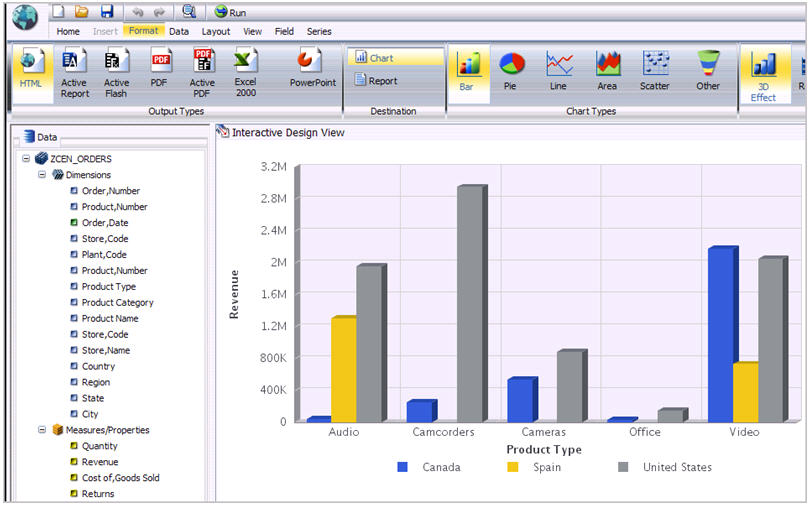
Figure 5: Choose the type of chart you'd like to see.
Conversely, graphs can be instantly converted to reports by utilizing the Report icon. In addition, the developer can create a dashboard by converting both graphs and reports to documents, inserting new reports/graphs, or referencing existing ones. An example of a dashboard created in the manner is shown in Figure 6.
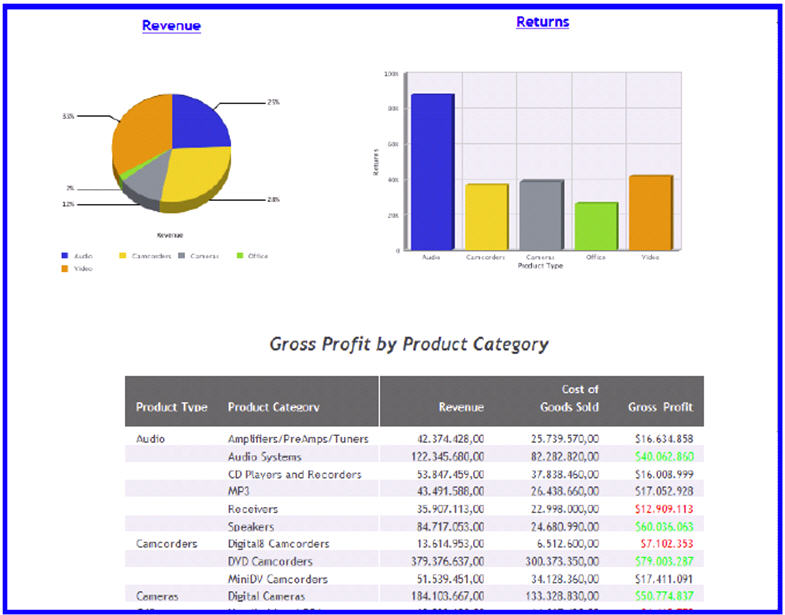
Figure 6: Create a dashboard that shows your data in a variety of ways.
Table of Contents
An InfoAssist feature that I think end users will really like is the Table of Contents. When run, a report (with this setting activated) will display a Table of Contents pop-up menu. As demonstrated in Figure 7, this menu displays each of the sort fields in a collapsed mode and allows the user to expand, select, and "jump" to a specific sort value in the report. When you jump to a specific sort value in the report, that value will even blink to draw your eyes to that area of the report.
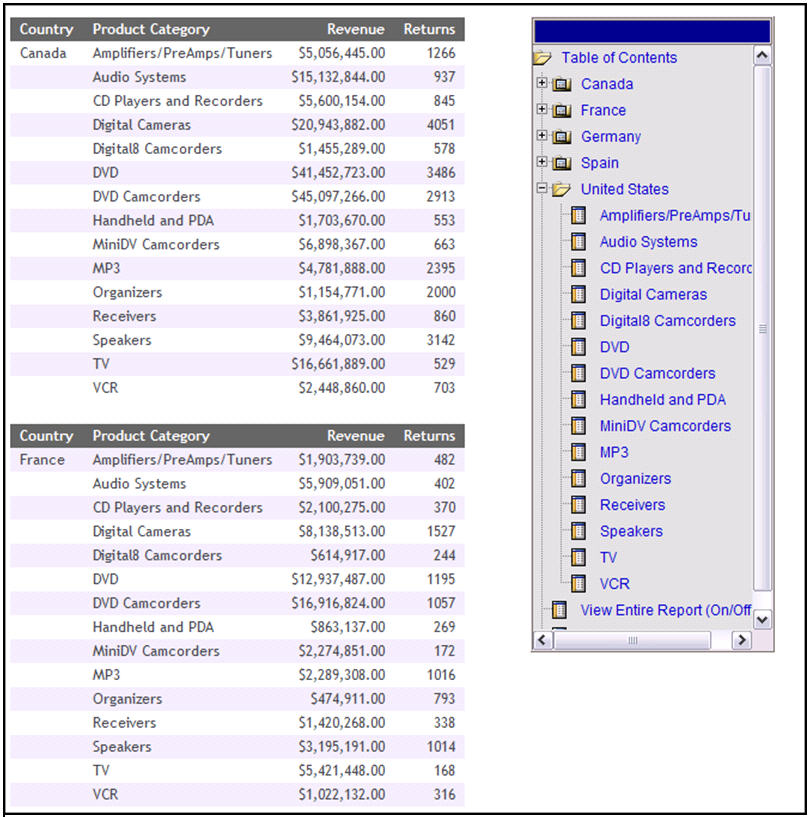
Figure 7: The Table of Contents displays the sort values.
From the Table of Contents, users can also select options to view the entire report or to remove the table of contents.
Other InfoAssist Features
Other new features that users will find immensely useful are advanced row filtering, data visualization bars, and graph reference lines (to show goals, objectives, etc). I could go on and on, but in summary, this new tool can be described as powerful yet so simple and fun to use!
JD Edwards Application Adapter
On the IBM i platform, there are literally thousands of clients that run the Oracle JD Edwards applications OneWorld and EnterpriseOne using DB2 for i as the back-end database. Consequently, we have had many requests from these clients to simplify data access of these applications from DB2 Web Query. While it was certainly possible to create DB2 Web Query reports, graphs, and dashboards over JDE data, it was up to the administrator to manually apply the specific JDE business logic to the DB2 Web Query metadata. This included the following:
- Decimal notation
- User Defined Codes (UDCs)
- Date conversions
- Column titles
- Security
Manually applying this logic to the metadata of potentially hundreds of JDE tables and views was a daunting task for many administrators. Enter version 1.1.2 and the new JDE data adapter! This adapter supports both JDE World (versions 7.x–9.x) and EnterpriseOne (all supported versions) and allows the administrator to reference JDE catalogs to create what is referred to as a DB2 Web Query "metadata repository." Information in this metadata repository is then used during an automated conversion process to update existing DB2 Web Query metadata files. The result is metadata with columns that have JDE-specific logic and the JDE-specific security model applied. Administrators and report developers no longer need to apply this logic manually!
Change in Default Behavior to Improve Performance
In version 1.1.1 of DB2 Web Query, there are instances where default settings and inherent processes, without manual intervention from an administrator or report writer, caused the "out of the box" experience to be less than optimal for some queries. In 1.1.2, we've addressed many of those offending issues to create a better out-of-the-box experience—mostly performance-related.
A major contributing factor for less-than-optimal report performance was the result of a condition called the "multiplicative effect." The multiplicative effect is a form of a Cartesian product that is an aggregation from two or more tables, resulting in multiple matching rows; when the Cartesian product occurs, the result could be what is best described as "plausible yet incorrect" results. The multiplicative effect can be rather hard to detect because it can occur for even seemingly simple queries and the data may look right at first glance. To provide an extra layer of protection against this, DB2 Web Query tended (by default) to pull all of the data in from each of the joined files and performed the merging and filtering in the reporting server component, where it had the ability to handle this condition and provide the correct results. However, this extra layer of protection comes at a price in performance, because in almost all cases, joins handled by DB2 for i will yield better performance. Report developers did have the ability to override this default protection by selecting an option in the development tools to use SQL joins and suppress the multiplicative effect protection. By specifying this setting, DB2 Web Query pushed the join logic down to the database engine, clearing the way for better query performance.
While the multiplicative effect is still out there (and is something you need to be aware of), the product now turns this protection setting off by default, allowing queries to run faster. However, if you have reports that are based on multiple table joins, you should always check your reports to verify that the multiplicative effect is not occurring! You can do this by toggling the SQL join setting and comparing the run results.
Performance and SQL Translation
Joining tables is not the only database function that the DB2 Web Query reporting server will sometimes perform over DB2. For better performance, row selection (filtering), aggregation, and sorting are other processes that are best handled by DB2, but depending on the report specifications, the reporting server will sometimes attempt to perform these tasks. The DB2 Web Query development team is working to identify the most common "culprits" that lead to this behavior and address them.
Substring, Concatenation, and Date Difference Functions
In 1.1.2, we have made great strides in this area by fixing string functions such as substring and concatenation. If you were performing selection against a database column and using one of those functions, the result was often a full table scan while the reporting server performed the filtering. These functions will now use SQL functions to perform these tasks, thereby pushing the logic down to DB2 and resulting in faster-running queries. In addition, the DATEDIF function (which returns the difference between two dates) now generates SQL functions to perform the necessary arithmetic.
Legacy Date Conversion
Another example of improved SQL translation that many customers will benefit from is legacy date conversion. The practice of storing dates values as numeric and/or character data types is a very, very common one (mainly because the date data type was not available in early releases of OS/400). Because DB2 Web Query does not know these fields are dates, you need to create define/virtual fields in your metadata or reports to convert them to dates. Prior to 1.1.2, DB2 Web Query was not using SQL functions to perform this conversion. Consequently, this logic was perform by the reporting server, not the database engine. If these converted fields were used as sort or join fields, then that would in turn mean a loss in DB2 optimization. The result, again, was a query that was not achieving maximum performance. In 1.1.2, the DATECVT function now uses SQL functions to translate many legacy date formats, thereby greatly improving performance of reports that use these converted date fields.
Decomposed Date Columns
A very useful feature in the synonym editor of the DB2 Web Query Developer Workbench is "Decompose Date." This feature breaks down your date fields into individual virtual columns for year, quarter, month, and day. Prior to 1.1.2, these decomposed date fields were not making use of SQL functions, but they are now! To take advantage of this improvement, you need to delete any existing decomposed fields in your metadata and run the decompose feature over the date fields again.
Improved Join Support
Another point of emphasis in this release was to improve the tool's database join support. Specifically, this meant beefing up support and functionality for left outer joins (for those reports in which you need to include both matching and non-matching rows) and providing the ability to create what many of us refer to as "exception" joins (when you want to include only non-matching rows in a report). Exception joins can now be implemented without the need for an SQL view. Simply specify a left outer join, and in your selection criteria, test a secondary file column for a null value.
User-Selected Output Format at Runtime
Another common request for enhancement was the ability for users to specify their preferred output format at run time. This decision had to be made during report development, so, for example, if Chris in the sales department wanted his report output in HTML format while Sue in accounting preferred a spreadsheet, the developer had to make two copies of the report, one for each output format. This requirement has been greatly simplified in version 1.1.2, which supports an output format option named "User." This option (shown in Figure 8) delays this decision until run time and eliminates the need for duplicate report definitions.
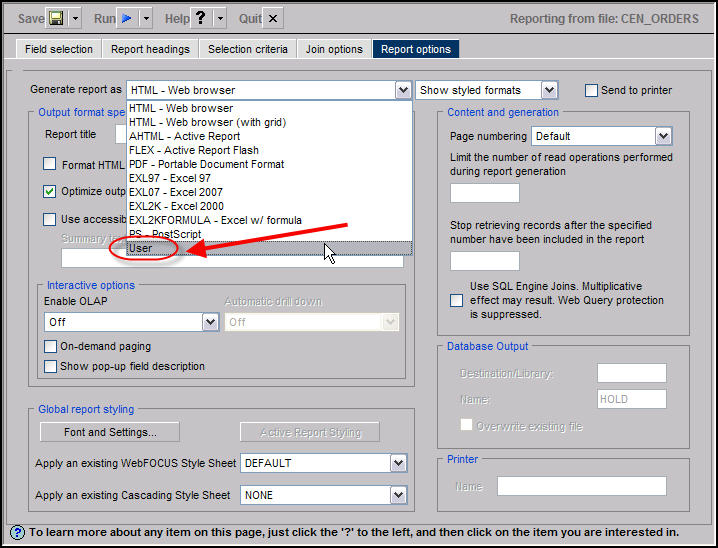
Figure 8: With the "User" option, users can choose different ways to view a report.
Now when the report is run, users are presented with a prompt control from which they can select their preferred output format from a drop-down list. An example is shown in Figure 9.
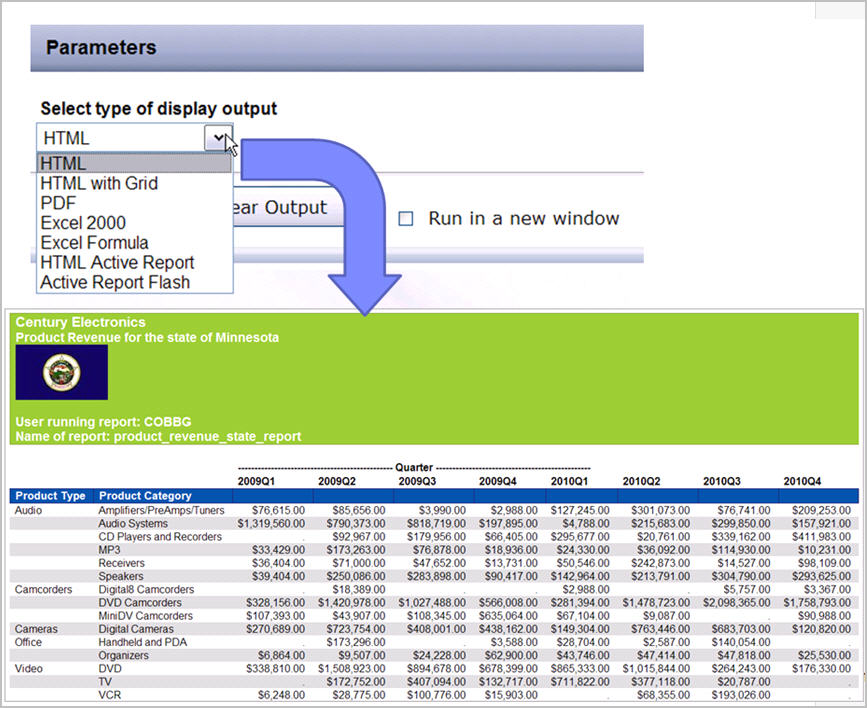
Figure 9: This user has chosen to see the report in HTML format.
New Output Formats
The list of supported output formats was expanded in 1.1.2 to include Active Flash, Active PDF, and Excel pivot tables. Active Flash and Active PDF are based on the Adobe Flex technologies and offer sharper graphics with higher resolutions and some animation. These types of outputs are especially useful when creating reports and graphs that will be seen by upper-level management. Examples are shown in Figure 10.
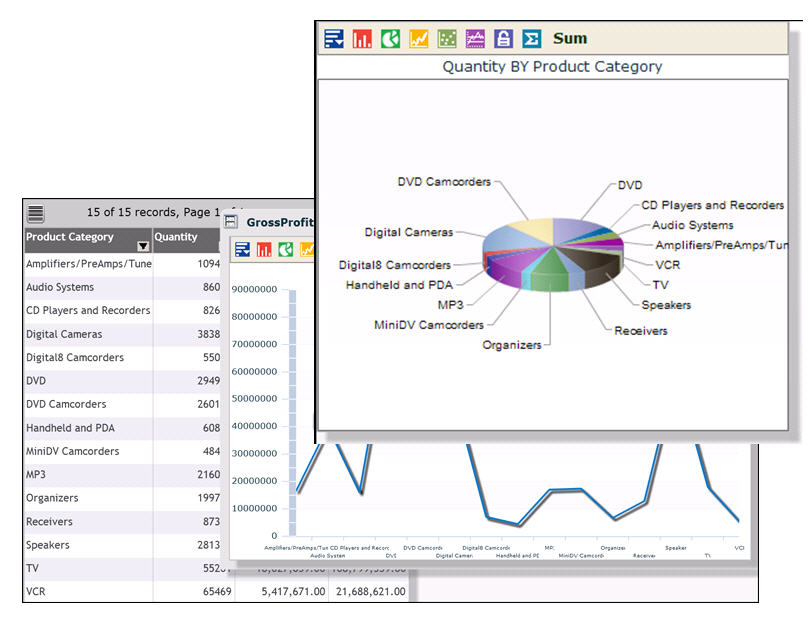
Figure 10: Output formats now include Active Flash, Active PDF, and Excel pivot tables.
Rich Internet Applications (RIAs)
One of the new enhancements was a fairly late discovery for me, and it's one that I am particularly excited about. This "hidden gem" is the ability to generate RIAs with DB2 Web Query. An RIA enables you to create an interactive Web page experience inside a browser. Enhancements made to DB2 Web Query Developer Workbench (specifically the HTML Composer tool) now allow you to use rich and powerful graphics and themes to create these RIAs in DB2 Web Query. Two RIA controls that will really jazz up your reporting environment are the accordion and window controls. When you create an accordion control, three pages are generated: the first one is expanded by default, and the remaining two are collapsed. As a developer, you can insert reports and graphs in each of the pages, allowing users to select a specific page to see the report or graph on that page.
Similarly, a window control allows you to insert a report or graph in a window (which remains in the foreground). The user can resize the window, minimize it, maximize it, and drag it to another area on the screen. It provides a useful way for users to position and size windows just as they want, allowing them to view multiple reports at once and perform size-by-side comparisons and analysis!
Consider Figure 11. This example has an accordion control with four pages and two window controls. When the user selects this HTML file to run, the report in page one of the accordion control is displayed as are the graphs in the two window controls.
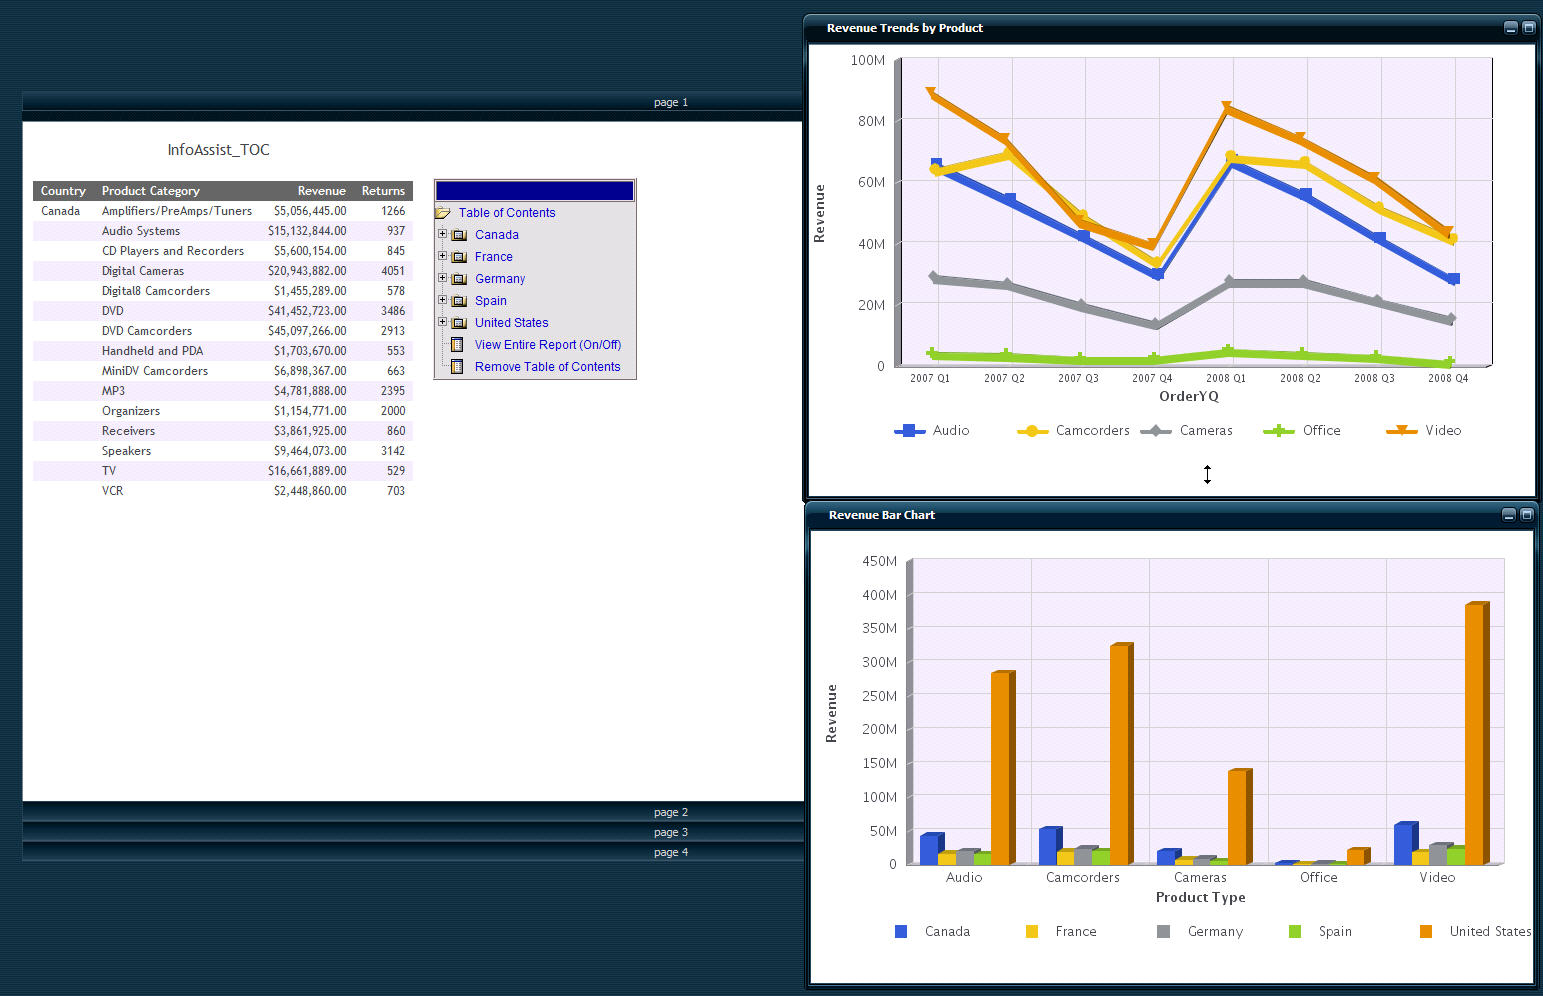
Figure 11: Jazz up reports with accordion and window controls.
However, because this HTML file was built with the RIA controls, users have the ability to change things around to suit their needs. As shown in Figure 12, the user clicked on page 4 of the accordion to display another report on that page, minimized the graph in the upper window control, and moved the graph in the lower window control toward the top of the screen.
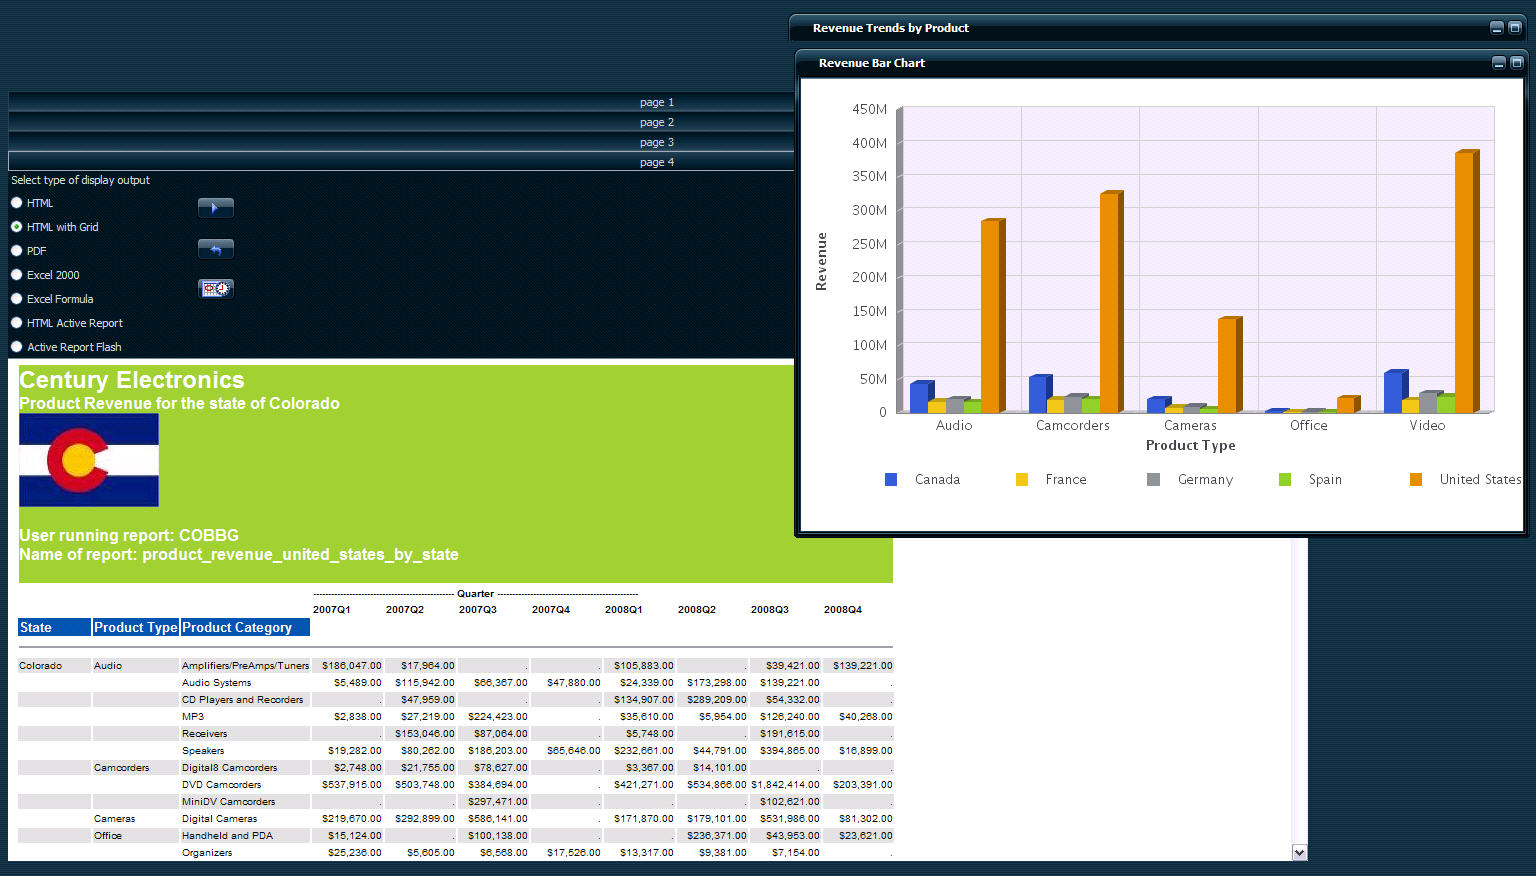
Figure 12: Rearrange the view to show up the way you want it.
Simplified Work Management
Yet another common request that we implemented in this release was to create a dedicated subsystem that all of the DB2 Web Query jobs could run within. While your users may not fully appreciate the benefits of work management simplifications, you administrators out there surely will! Those benefits include the following:
- Allows you easily allocate and adjust system resources—For example, if you have other long-running and high-priority jobs that are hogging the system resources and not allowing your reports to run, you can simply bump the priority of the class object (QWEBQRYCLS), and all jobs in the subsystem will use the new run priority.
- Simplifies starting and stopping of DB2 Web Query jobs—The STRWEBQRY command will start the subsystem and all of the jobs. Similarly, the ENDWEBQRY command will end the jobs and bring down the subsystem.
- Provides one place to look for all DB2 Web Query jobs
- Provides more control of monitoring system resources being consumed by DB2 Web Query jobs
Figure 13 shows an example of the jobs that run in the QWEBQRY subsystem.
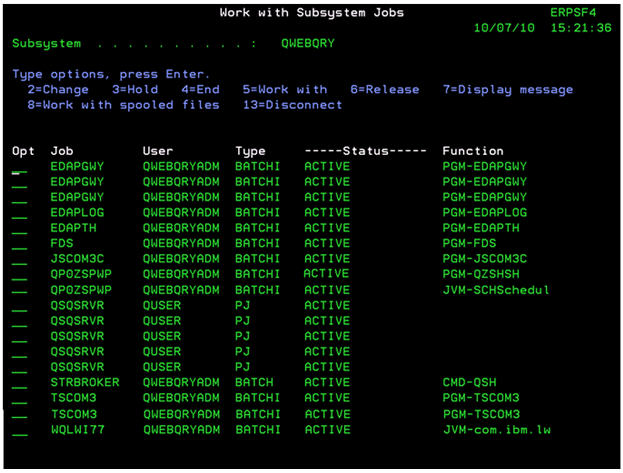
Figure 13: These types of jobs run in the QWEBQRY subsystem.
Notice that the prestart server side CLI jobs named QSQRSRVR also run in this subsystem. These are the jobs that perform the actual database requests.
Note: There are still three WQLWI77 jobs that will run in the QHTTPSVR subystem.
Lab Services Offerings to Simplify Integration and Fill In Functionality Gaps
While not part of the DB2 Web Query product offering, I am excited about some of the new assets that the IBM STG Lab Services team has delivered to greatly extend the ability to call and integrate reports and graphs from various interfaces. These assets are extensions built on top of DB2 Web Query and make heavy use of the DB2 Web Query Software Development Kit (SDK). So what are the benefits of these extensions? In a nutshell, they greatly simplify the integration of DB2 Web Query functions into existing or customized applications—in some cases without requiring coding at a 3GL programming level. There are currently two extension offerings: the Integration Toolkit Extension and the 5250 Reporting Extension.
Integration Toolkit Extension
The DB2 Web Query Integration Toolkit Extension provides a URL-based interface to integrate DB2 Web Query reports and graphs into custom applications. This interface greatly simplifies integration, providing an easy-to-use interface to the DB2 Web Query SDK functions from any application.
Here's how it works: each DB2 Web Query report and graph has a unique URL. All your application has to do is invoke the URL that represents the report you want to run. If your report has input parameters, you simply pass the parameters in the URL string. From an integration perspective, it really doesn't get much easier than that!
Often these URLs can be fairly lengthy and can exceed the length limitations of several interfaces, such as the STRPCCMD command. So, for example, if you wanted to run a report from a 5250 application (written in CL and RPG) and have the results displayed immediately by launching the Web browser, you could do this by passing the URL string to the STRPCCMD like in the following code example:
CHGVAR VAR(&PCCMD) VALUE('START' *BCAT &URL *TCAT '"')
STRPCCMD PCCMD(&PCCMD) PAUSE(*NO)
The PCCMD parameter of the STRPCCMD cannot exceed 123 characters, so any URL longer than this maximum cannot be passed to the command. To address this limitation, the Integration Toolkit Extension has a "tiny URL" implementation. Rather than specifying the full URL, the extension allows you to pass a tiny URL (that represents the longer version).
Another nice feature is the Integration Toolkit Extension's ability to detect if a report requires input parameters and (if none were passed in the URL) to build an auto-prompt drop-down list or text box to prompt the user for the input parameter value at run time.
Bottom line: You can spend a great deal of time during the integration process finding, researching, and dealing with these types of challenges. The Integration Toolkit Extension will save you time and effort because it already has solutions in place.
5250 Reporting Extension
The DB2 Web Query 5250 Reporting Extension allows DB2 Web Query reports to be executed from a 5250 command line by invoking the command RUNWQFEX. This command can be executed to run a report using any of the supported output formats and send the results to an email address, a specified directory on the IFS, or even a remote location using the FTP option. While the base DB2 Web Query product does include a RUNWEBQRY command, it's limited to the output options database file and spooled file. The RUNWQFEX command in the Reporting Extension has no such limitations: you can direct output to all the supported DB2 Web Query formats, including HTML, Active Reports, PDF, and Excel spreadsheets.
Again, I would like to point out that these extensions, while extremely useful and easy to use, are not part of the formal product offering. If you are interested in obtaining one or more of these extensions, you can contact the Lab Services team by sending an email to
A Basketful of Gifts!
As you can see, this new release is packed full of gifts and goodies (and fittingly enough, its GA date was right before the holiday season!). So I encourage you to upgrade to this new version and take advantage of all the enhancements!
I would also like to invite you to visit our IBM developerWorks Web site for DB2 Web Query. We launched this Web site in 2008 in order to provide a way for customers to reach out to the experts, ask questions, access technical documentation, and get tips and techniques with the goal of building up their DB2 Web Query skill base. Questions can be posted to the forum, which is patrolled by several experts on a daily basis. Every effort is made to answer questions posted. While it is not intended to be a support site, it does provide a way for you to ask questions to determine if a specific requirement can be done, and if so, how. This site also has links to our KnowledgeBase database (with technical notes and tips), a Wiki that contains our repository of DB2 Web Query articles and white papers, and links to download all of our DB2 Web Query manuals (installation, functions, new features, etc.). If you have read this article to this point, I would say it's definitely a Web site that you will want to bookmark!
as/400, os/400, iseries, system i, i5/os, ibm i, power systems, 6.1, 7.1, V7,


 More than ever, there is a demand for IT to deliver innovation. Your IBM i has been an essential part of your business operations for years. However, your organization may struggle to maintain the current system and implement new projects. The thousands of customers we've worked with and surveyed state that expectations regarding the digital footprint and vision of the company are not aligned with the current IT environment.
 TRY the one package that solves all your document design and printing challenges on all your platforms. Produce bar code labels, electronic forms, ad hoc reports, and RFID tags – without programming! MarkMagic is the only document design and print solution that combines report writing, WYSIWYG label and forms design, and conditional printing in one integrated product. Make sure your data survives when catastrophe hits. Request your trial now! Request Now.
 Forms of ransomware has been around for over 30 years, and with more and more organizations suffering attacks each year, it continues to endure. What has made ransomware such a durable threat and what is the best way to combat it? In order to prevent ransomware, organizations must first understand how it works.
 Disaster protection is vital to every business. Yet, it often consists of patched together procedures that are prone to error. From automatic backups to data encryption to media management, Robot automates the routine (yet often complex) tasks of iSeries backup and recovery, saving you time and money and making the process safer and more reliable. Automate your backups with the Robot Backup and Recovery Solution. Key features include:
 Business users want new applications now. Market and regulatory pressures require faster application updates and delivery into production. Your IBM i developers may be approaching retirement, and you see no sure way to fill their positions with experienced developers. In addition, you may be caught between maintaining your existing applications and the uncertainty of moving to something new.
 IT managers hoping to find new IBM i talent are discovering that the pool of experienced RPG programmers and operators or administrators with intimate knowledge of the operating system and the applications that run on it is small. This begs the question: How will you manage the platform that supports such a big part of your business? This guide offers strategies and software suggestions to help you plan IT staffing and resources and smooth the transition after your AS/400 talent retires. Read on to learn:
LATEST COMMENTS
MC Press Online