


Inspecting application data has evolved a bit since the 5250 green-screen days.
There once was a time in the midrange computing world when developers tasked with tracing the source of data showing on a particular application screen could follow a fairly rote process to identify it. With the primary interface being a 5250 green-screen, the developer could start by locating the DDS display file for the underlying screen, use SDA to find the appropriate record format and field name(s), and then look at the associated RPG code to see how those particular display fields are populated. He or she could then begin making program adjustments as needed.
But today it's a rarity to find IBM i sites running their business applications exclusively on 5250 screens. Most companies now have at least some web presence in their systems arsenal, whether it be a dashboard display for internal executives, a browser-based application for external suppliers or customers to look up order status, or, say, a mobile-friendly web app for salespeople to interact with your IBM i data.
So when one of your users comes to you looking for details about the source of information behind one of these applications running in a browser, requiring you to peer into underlying program code, where do you begin to trace that? One fantastic option is the integrated development tool included in the freely available Google Chrome browser. Even if you had no direct involvement in the front-end user interface design to begin with, the Chrome DevTools can assist you in determining where the data showing on any browser page is coming from.
Accessing the DevTools
Among the more pleasing aspects of Chrome DevTools is the installation process—there isn't one! That is, once you've downloaded the Google Chrome Browser, the DevTools are built right in. You can access the utility in Windows by using the F12 key shortcut, or on a Mac using Command-Option-I. This will open up DevTools and place you in what's known as the Console, where exception messages are displayed and a command line interface exists for developers to enter code that can be executed directly in the browser.
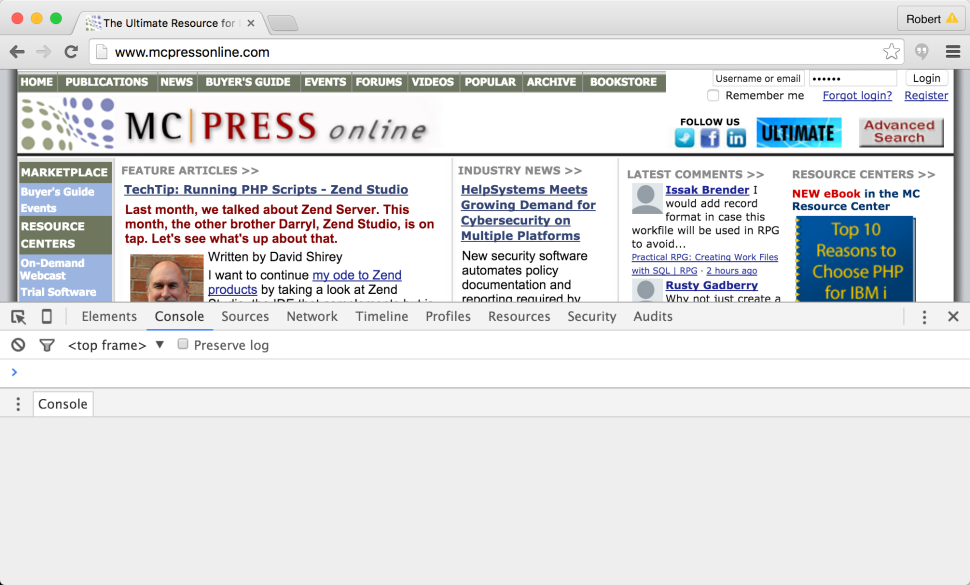
Figure 1: The Chrome DevTools Console appears at the bottom half of the browser page.
Among the many useful things about the Console tab is that it's a readily available resource for experimenting with JavaScript, as well as HTML and CSS. In a previous MC Press article, I demonstrated this concept by using the Console to enter some JavaScript that changes all the text elements on the browser page into a lovely shade of 5250-inspired green.
But for our purposes today—which is to peer into the data flowing from the server to what you're seeing in the client web page—we're going to focus on the Elements and Network tabs.
Before we jump into that, I should mention that the Chrome DevTools utility is constantly evolving and improving. In fact, as I write this piece, I'm noticing subtle things that have changed since I last used the tool just a couple weeks ago! So depending on when you're reading this article, some of the DevTools screen shots shown here may not look exactly the same as what you're seeing. This just goes to show how dynamic the web development world is when compared to some of the more "mature" tools we IBM i developers are accustomed to using on the server side!
Old-School HTML Source Viewing
In the early "Web 1.0" days of the Internet, browser pages were typically constructed on the server, with large chunks of HTML, JavaScript, and CSS streamed to the browser. Curious web designers interested in inspecting the source underlying any page could do so through a menu option on the browser, and in fact you can still do that today in Chrome via View > Developer > View Source. Developers could use this approach to look in the source for markers or tags that could lead them to specific sections of code on the back-end that constructed particular elements on the page.
With the advent of newer web-building techniques, such as JavaScript-based frameworks that write HTML code based on data coming from the server in the form of XML or JSON, we don't find ourselves inspecting raw code in this manner as often anymore. But there are still plenty of sites out there that use this stream-the-whole-page-from-the-back-end approach, and in such cases when you need to inspect the source, Chrome DevTools makes it much easier to find the section of code you're looking for.
With the DevTools open, clicking on the Elements tab gives you an easy-to-navigate view of the source code behind the page in a collapsible tree, referred to as the Document Object Model, or DOM. You'll notice that, as you move your mouse up and down the tree, the corresponding portion of the page is highlighted.
You can also zoom in on the source behind any specific entity on the page by clicking on the element inspector button (the icon has a diagonal arrow pointing to a box) and then clicking on the desired element on the page. In this manner, you could point to any entity on the page to highlight the corresponding DOM element and then scroll up to find identifying markers, tags, or IDs that might help you isolate where the code is being built on the back-end.
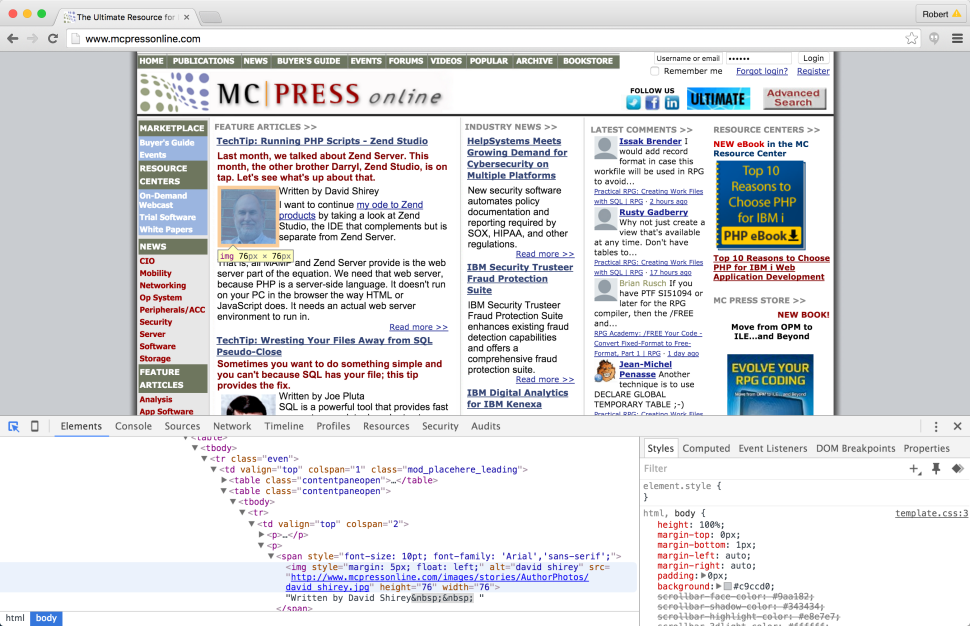
Figure 2: Note the code in the Elements tab.
DevTools also lets you adjust the web page's underlying source on the fly by double-clicking on any text segment in the DOM and simply typing over it. As a fun practical joke, you could use this feature to manipulate the headline and/or story content on a news website—just use the element inspector to locate and adjust the text to something absurd, close the DevTools window, then bring someone over to read the "tweaked" story and see how shocked they are. It's on the Internet, or so it appears, so of course they have to believe it!
Peering in on Network Traffic
Many modern web apps today are built through JavaScript components that receive data from the server and feed it to visual components in the browser such as grids, forms, charts, etc. In such cases, looking at HTML source is not going to be very helpful in figuring out where a particular number or piece of text is coming from. Instead, you'll want to inspect the data feeding the component itself, and that's where the DevTools Network tab comes into play.
I am often amazed to see the volume of data that can be sent to the browser as I surf around the web. For example, take a look at the news website CNN. With the Network tab open in your DevTools panel, navigate your browser to www.cnn.com and you will see a flurry of network traffic activity taking place as multiple files consisting of data, images, etc. are streamed and rendered in your browser. In the example below, over 4MB of data was downloaded to supply content for the page, so you can see how a limited Internet connection could result in a sluggish online experience—and potentially an expensive one if you're using a connection that charges by the megabyte!
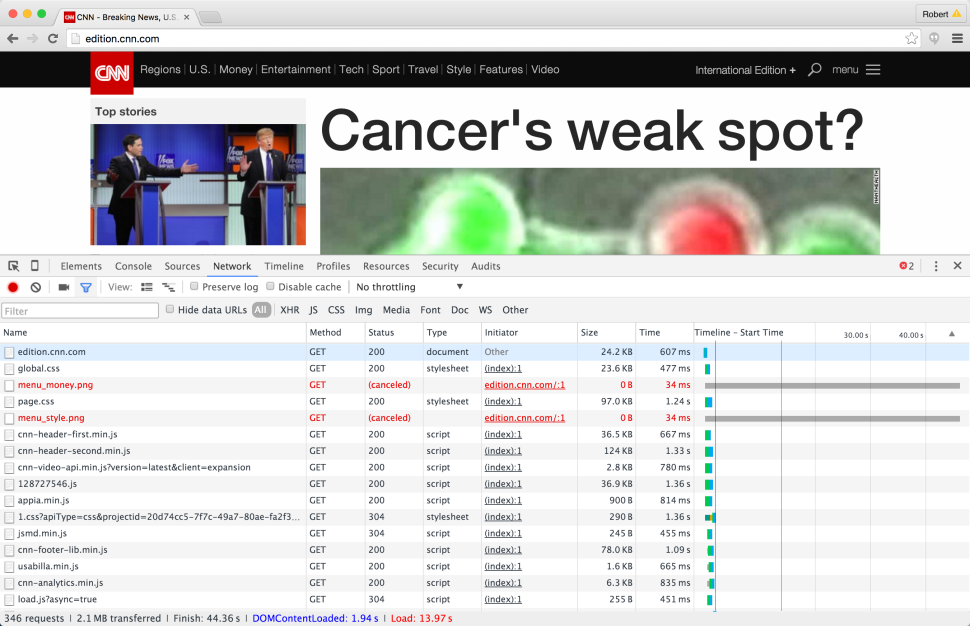
Figure 3: Look at the traffic feeding the CNN web page.
For each streamed element showing in the Network tab—whether it be HTML data (.HTML), a JavaScript file (.js), an image (.jpg, .png, etc.), or what have you—you can inspect what your browser requested from the server and exactly what the server in turn sent back to the browser. This information is displayed in the panel to the right when you click on the element, with information sent to the server on the Header tab, and information coming back in the Response tab. The Preview tab will show a more human-friendly representation of the returned data. For example, Figure 4 below shows an image element on the CNN website corresponding to a story on junk food.
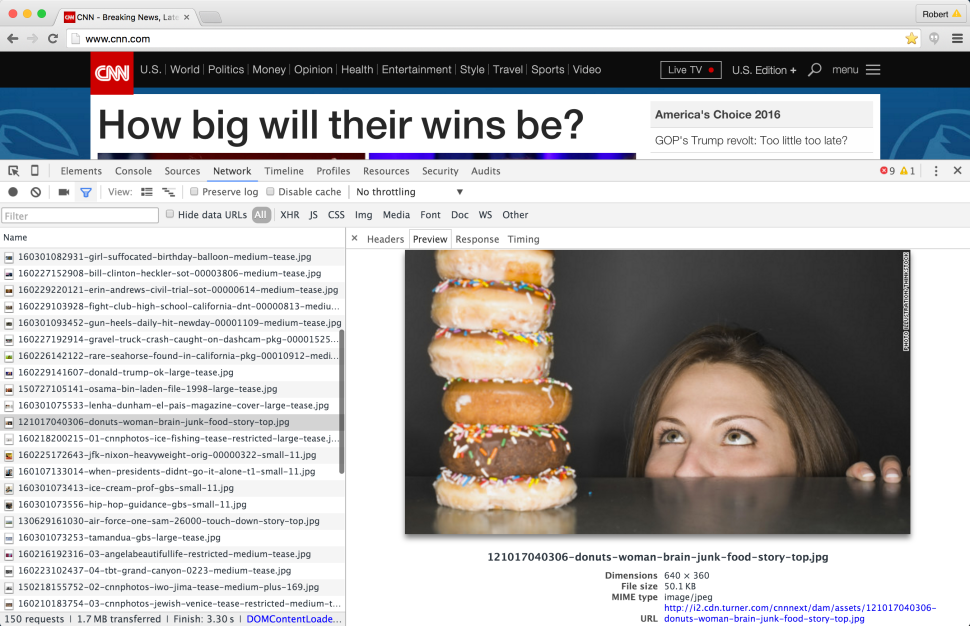
Figure 4: Preview content of a downloaded file.
When the volume of network data is so large as to be hard to manage, you can "freeze" the list by clicking on the bright red dot in the upper left. This will suspend network traffic logging until you click on the dot again, which can be handy when the list is growing by leaps and bounds while you're trying to review it. Likewise, you can clear out the list of network elements by hitting the circle-slash icon just to the right.
Zeroing in on the Data You Care About
Both the Elements and Network tabs in DevTools have excellent search or filter features. When looking in the Elements tab, simply hit Ctrl+F (or Command+F on a Mac) to bring up a search form and type in any text you're looking for. The text will be repositioned to the first instance, with the specified text highlighted. Subsequent presses of the Enter key will move you to the next instance.
But it's the Network tab filter that I generally find most useful. In addition to looking for explicit text, you can limit the list to specific data types using the buttons to the right of the filter field. For example, clicking on the JS button will limit the list to JavaScript source files; CSS will limit to CSS files; Img to image files; etc.
When it comes to inspecting the content of business-centric web applications, the XHR filter here may be the most pertinent. XHR refers to XML HTTP Request, which is a reference to what is commonly referred to as AJAX data. Without getting too deep in the weeds here, the XHR filter will limit your network traffic list to elements such as JSON- or XML-formatted data that is used to feed visual components built through JavaScript tools, such as grids or charts.
Let's use Home Depot's website to demonstrate how you might use this XHR filter to help identify field names associated with shopping cart data. With the Network tab showing and no filter applied (meaning the filter field is blank and the "All" button to the right is highlighted), navigate to www.homedepot.com and add a few items to your shopping cart. Now click on the filter field and enter the word "cart." You'll notice this constrains the list a bit, but it's still a huge list. Now click on the XHR filter. The list has become much more manageable now, and clicking through a few items listed and looking at what shows in the Preview panel on the right reveals that it is the second "cart" entry that contains the goods we're looking for.
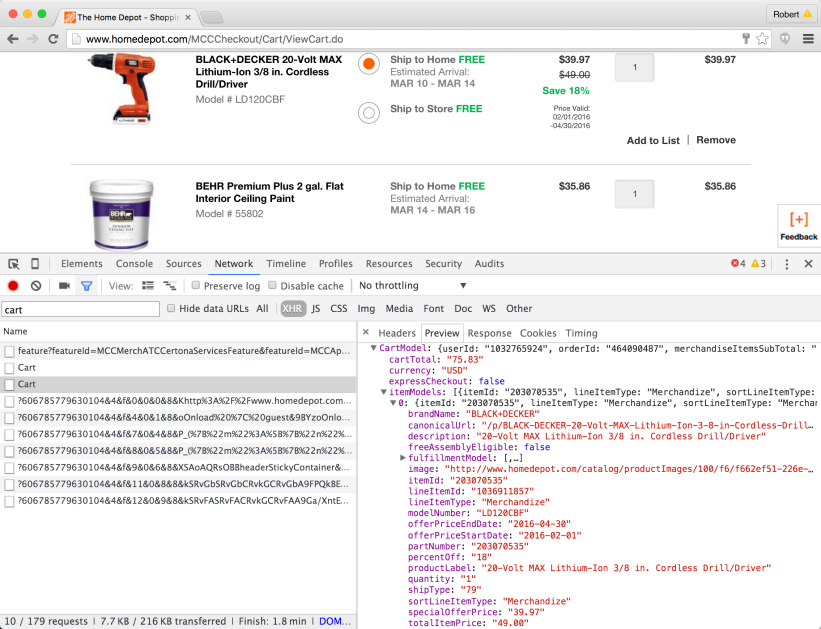
Figure 5: JSON shopping cart contents are shown on HomeDepot.com.
Now, armed with field names that correspond to the data showing in the shopping cart, a developer could go look in the server-side program for the section of code generating this output. Whenever I'm looking at a web application for the first time and trying to understand how it's being loaded, this is typically the approach I use to get started.
Just the Basics
Obviously we're only barely scratching the surface of what you can do with Chrome DevTools in this article. If you'd like to learn more, you can get plenty of information at the Chrome Developer website. Also, if you're attending COMMON in New Orleans this May, please be sure to come to my Chrome DevTools session, where I'll be demonstrating some more practical uses of this handy tool, including how to use its interactive debugger on an IBM i-based web app.


 More than ever, there is a demand for IT to deliver innovation. Your IBM i has been an essential part of your business operations for years. However, your organization may struggle to maintain the current system and implement new projects. The thousands of customers we've worked with and surveyed state that expectations regarding the digital footprint and vision of the company are not aligned with the current IT environment.
 TRY the one package that solves all your document design and printing challenges on all your platforms. Produce bar code labels, electronic forms, ad hoc reports, and RFID tags – without programming! MarkMagic is the only document design and print solution that combines report writing, WYSIWYG label and forms design, and conditional printing in one integrated product. Make sure your data survives when catastrophe hits. Request your trial now! Request Now.
 Forms of ransomware has been around for over 30 years, and with more and more organizations suffering attacks each year, it continues to endure. What has made ransomware such a durable threat and what is the best way to combat it? In order to prevent ransomware, organizations must first understand how it works.
 Disaster protection is vital to every business. Yet, it often consists of patched together procedures that are prone to error. From automatic backups to data encryption to media management, Robot automates the routine (yet often complex) tasks of iSeries backup and recovery, saving you time and money and making the process safer and more reliable. Automate your backups with the Robot Backup and Recovery Solution. Key features include:
 Business users want new applications now. Market and regulatory pressures require faster application updates and delivery into production. Your IBM i developers may be approaching retirement, and you see no sure way to fill their positions with experienced developers. In addition, you may be caught between maintaining your existing applications and the uncertainty of moving to something new.
 IT managers hoping to find new IBM i talent are discovering that the pool of experienced RPG programmers and operators or administrators with intimate knowledge of the operating system and the applications that run on it is small. This begs the question: How will you manage the platform that supports such a big part of your business? This guide offers strategies and software suggestions to help you plan IT staffing and resources and smooth the transition after your AS/400 talent retires. Read on to learn:
LATEST COMMENTS
MC Press Online