


Fitting ntop into Networks
The ntop tool provides some risk analysis reporting by flagging hosts and traffic that could potentially be considered hostile. Duplicated MAC addresses, port zero traffic, network masking issues, and too much traffic on ports and hosts are a few of the problems networks face. This traffic is analyzed; flagged and categorized as no, medium, or high risk; and then associated with the offending host.
While ntop provides some useful information relating to possible security risks, its power and flexibility lies with its ability to sort, analyze, and graph network traffic according to many protocols. Once traffic is observed for some time, ntop is able to report network usage statistics and graphs and then provide network flows based upon its encounters. A few of its key features are listed here, and many more can be found at the ntop.org Web site.
- Store permanent traffic statistics in RRD graph format
- Passively identify host OSes
- Analyze and sort traffic by source and destination
- Report IP protocol by types
Platforms that are supported include UNIX (Linux, BSD, Solaris, and MacOSX) and all Windows versions, from Windows 95 to Vista. One of the best features of ntop is the lack of overhead required to run it. Generally, CPU and memory requirements are very nominal. Depending on the size of networks you want to monitor, CPU load can be less than 10 percent of the normal work load and should operate smoothly with 256MB of memory.
Switched Networks vs. Non-switched Networks
Before you install ntop on a host machine, you must decide what host you are going to select as your monitoring station. You can only use this tool on a subnet basis, which means if you have multiple subnets within your organization, you will have to install an instance of ntop to monitor each subnet location. In a switched environment, ntop can monitor only the segment of that particular network that the host is connected to. Therefore, ntop isn't able to jump across router points.
Also, many switches won't easily allow ntop to view traffic. If you discover ntop is not sniffing out traffic as accurately as you think it should, you'll need to turn to your switch manufacturer for support on port mirroring. Many 3Com switches incorporate a technology called "roving analysis," or port mirroring. When you activate this on a specific switch port, all incoming and outgoing traffic on the switch can be captured through the monitoring port. This is the perfect port to plug ntop into so it can view all traffic, missing virtually zero packets. If you're using only hubs—not managed switches— then you need not worry about this problem.
If you're in the market for a new network switch and also want to start tracking network statistics, make sure you check that any new switches you plan to purchase have this option. Beware of the 3Com 4200 series switches; they do not have roving analysis capabilities.
Installation
Source downloads and installation instructions can be found on ntop.org. You can find ntop packaged as an RPM for RHEL and CentOS at Dag Wieer's third-party repository. If you want a lot of the extra graphs and charts options, there are a couple of package requirements that I've found: GD graphics and Graphviz libraries. Graphviz, which can also be found in Dag's repository, has its own set of dependencies.
I suggest using CentOS and setting up the repository on the system. This setup will allow the use of the package tool yum, which will satisfy all of these dependencies automatically. All questions about using these repositories can be answered on the FAQ section of the Web site. Other CentOS-specific repository questions are addressed on the CentOS wiki.
Once you get these items configured, installation should be a trivial matter:
If many of the dependent packages are missing, yum will retrieve them from the appropriate locations and install them.
Configuration
Configuration takes only a few minutes to complete, and then you can start using ntop. If you're not using the RPM installation on RHEL/CentOS, then substitute the appropriate commands. Turn on the service and allow ntop to run through its configuration process. You'll be prompted to enter an admin password to use with the Web interface.
# /usr/bin/ntop
Doing this will install all the necessary service files to their locations, and it will also start the service. You'll need to kill this session since you're going to be using it as a service. Hit Ctrl+C to end the process and then start the service using the appropriate command.
# service ntop status
ntop (pid 22848) is running...
That completes configuration.
Web Interface
By default, ntop runs on port 3000, which you can change if necessary. Also by default, ntop allows all users access to the Web interface, but it does not allow configuration changes to be made unless you authenticate with the password that you created in the setup portion of installation. You can change this behavior in the admin section within the Web interface. Bring up a Web browser and browse to your instance at http://hostname:3000.
To change the settings for allowing access to the Web interface, go to the Admin panel:
Admin -> Configure -> Protect URLs
Delete all of the default-configured URLs and then click the Add URL link. Do not enter any characters into the URL box, highlight the admin user, and then select Add URL. This creates a wildcard link as http://hostname:3000/*, which protects all pages from being accessed without the user name and password. If you don't mind others being able to Web browse to view statistics, leave these settings at their default values.
The Summary tab provides the default page as the global traffic statistics view. This page contains global traffic reports that the network adapter has discovered, global protocol distribution reports, and traffic port distribution charts. Under the Summary tab, you can find reports on a per-host basis. Lastly, basic network load statistics are broken down by 10 minute, 1 hour, 1 day, and 1 month intervals provided in the graphs.
The All Protocols tab provides detailed information broken down into specific protocols. Under the traffic page, you can find all data sent and received per host that is categorized.
Located under the IP tab, you can see reports for all Internet domain traffic used and host reports with data categorized by type. For instance, a host shows FTP, HTTP, DNS, Telnet, SNMP, SSH, and many others displayed by bandwidth use. One of the most useful maps I've found is under the Local -> Network Traffic Map page. It displays the current view of how traffic is flowing on your network. Another useful report is the IP -> Summary -> Distribution page, featured below.
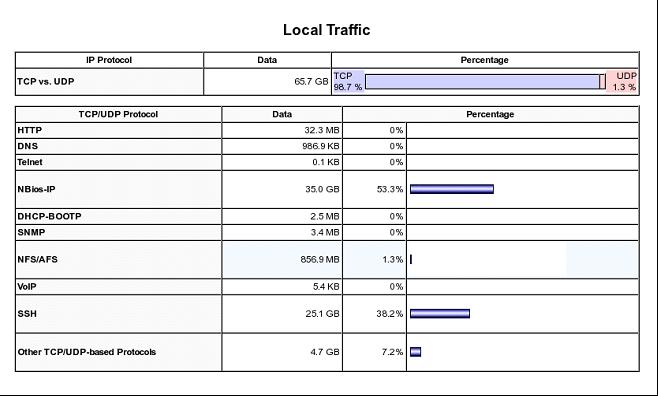
Figure 1: You can find a local traffic report at IP -> Summary -> Distribution. (Click image to enlarge.)
The Plugins tab gives you the ability to add in features such as ICMP Watch, Cisco NetFlow reports, and much more. There is also a PDA plug-in available if you would like minimal reports displayed on PDA devices.
Add ntop to Your Network Arsenal
The options and information ntop provides are far more than I am able to demonstrate. Get an instance running and explore all of its features for yourself; I don't think you'll be disappointed. The nicest thing about ntop is the ease of implementing it into networks. It will quickly become a tool you can utilize to gain extremely detailed reporting about network usage and bandwidth. For the monitoring junkies, here's yet another tool to satisfy those watchdog addictions.


 More than ever, there is a demand for IT to deliver innovation. Your IBM i has been an essential part of your business operations for years. However, your organization may struggle to maintain the current system and implement new projects. The thousands of customers we've worked with and surveyed state that expectations regarding the digital footprint and vision of the company are not aligned with the current IT environment.
 TRY the one package that solves all your document design and printing challenges on all your platforms. Produce bar code labels, electronic forms, ad hoc reports, and RFID tags – without programming! MarkMagic is the only document design and print solution that combines report writing, WYSIWYG label and forms design, and conditional printing in one integrated product. Make sure your data survives when catastrophe hits. Request your trial now! Request Now.
 Forms of ransomware has been around for over 30 years, and with more and more organizations suffering attacks each year, it continues to endure. What has made ransomware such a durable threat and what is the best way to combat it? In order to prevent ransomware, organizations must first understand how it works.
 Disaster protection is vital to every business. Yet, it often consists of patched together procedures that are prone to error. From automatic backups to data encryption to media management, Robot automates the routine (yet often complex) tasks of iSeries backup and recovery, saving you time and money and making the process safer and more reliable. Automate your backups with the Robot Backup and Recovery Solution. Key features include:
 Business users want new applications now. Market and regulatory pressures require faster application updates and delivery into production. Your IBM i developers may be approaching retirement, and you see no sure way to fill their positions with experienced developers. In addition, you may be caught between maintaining your existing applications and the uncertainty of moving to something new.
 IT managers hoping to find new IBM i talent are discovering that the pool of experienced RPG programmers and operators or administrators with intimate knowledge of the operating system and the applications that run on it is small. This begs the question: How will you manage the platform that supports such a big part of your business? This guide offers strategies and software suggestions to help you plan IT staffing and resources and smooth the transition after your AS/400 talent retires. Read on to learn:
LATEST COMMENTS
MC Press Online