


Management Central--Pervasive was developed to give you system information from anywhere at any time. Using a Web browser, Internet-enabled phone, or PDA, you can check on your system status, look at system performance, find critical messages, and verify that the application jobs are running. The integrated ability to run commands and perform job and message actions can then assist you in resolving problems you may find.
Basics of Management Central--Pervasive
Management Central--Pervasive was introduced in V4R5 as the companion to Operations Navigator, the graphical interface to the iSeries. Operations Navigator first integrated Management Central technology in V4R3 with basic performance monitors. Over time, the basic Management Central technology, which provided the distributed infrastructure, has enabled a wide range of administration functions from monitors to distribution. Though scheduling and automation is included, access was still limited by the physical wires and PC. Not anymore! Management Central--Pervasive meets the challenge head-on by putting desktop functions into a smaller, mobile device.As shown in Figure 1, all the Management Central--Pervasive interface devices interact with a servlet running on the central system by using a Web application server such as WebSphere or Domino.
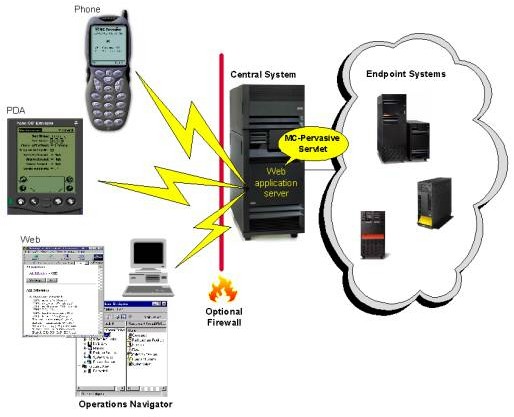
Figure 1: Get access to your network of iSeries from the latest interface technologies.
Since the central system stores most management information and handles requests to selected endpoints, you can reach a network of systems. The central system allows you to check on the health of your endpoints without setting up all your systems as Web servers or connecting to each system individually. Monitors, which can collect information and detect error conditions, are key to any management solutions. In V4R3, system monitors gave you the capability to monitor system performance. V5R1 added more monitoring for message queues and jobs referred to as message monitors and job monitors. All the monitors can be managed and viewed to observe current status and detailed data using either Operations Navigator or Management Central--Pervasive. Though Management Central--Pervasive gives you access away from your desk, functions such as setting up new monitors, changing properties of existing monitors, and providing advanced viewing capabilities are provided using only Operations Navigator, which can handle more complex user interaction.
Whether you are in a meeting that has gone way too long or in traffic on your way to work, a checkup on your iSeries is at your fingertips. Let's take a better look at a few of the ways you can check your systems using Management Central--Pervasive.
Up and Running
When you are working on a PC and you lose connection to your server, you know it immediately; it's obvious. If you are away from your desk, however, it's not so obvious. Management Central--Pervasive gives you the capability to find out if a server is up and running, from pretty much anywhere.When you use Management Central--Pervasive, you'll find it displays information across several pages on your device. Figure 2 shows an example of Management Central--Pervasive in action.

Figure 2: Use Management Central pervasive to investigate problems.
The initial page provides overview information and additional indicators. Some of the indicators include an exclamation point for failures (e.g., system not up), a bell graphic for exceeding thresholds (e.g., CPU utilization exceeding 95 percent), and a number in parentheses for showing the number of items that can be viewed.
By selecting 1 on your phone's key pad, you can drill down to find out more information about the individual system's status. This first level of drilldown information will show the list of systems you are configured to watch. When there is an exclamation point on the initial page, the first-level drilldown will show the exclamation point next to the system or systems that have failed. No exclamation point is an indication the system is up and running in the network. To see system-specific information, such as release level, just select the system you are interested in. Systems can be added to or removed from the list by selecting actions under the Menu option, found in the lower right corner of the phone display.
Performing at Your Peak
With the initial checkup done, proceed and do a checkup on system performance. Checking up on system performance information is key to determining if your system is operating at its peak. System monitors give you the capability to monitor system performance information and identify critical performance thresholds of systems in a network.I'll describe a simple example, shown in Figure 3.
Figure 3: You can change many of the Management Central attributes, such as WatchCPU, using Operations Navigator.
Create and start a new monitor, called WatchCpu, to watch for CPU utilization (average) to reach or exceed 95 percent. Though not shown, WatchCpu was created and started to monitor the endpoint systems called System1 and System2. To better understand how to create and start monitors, see "Monitoring Your System Without Lifting a Finger." Though creating the monitors cannot be done using Management Central--Pervasive, the ability to start your monitors was added in V5R1. Using Management Central--Pervasive, you can check on the status and view the latest performance data of WatchCpu. Like systems on the initial page (shown in Figure 2), the monitors will also indicate an overall status of all monitors. When a threshold or failure occurs, this will provide a quick way to know something is wrong. It looks like there may be a problem in the Figure 2 example, since the bell is shown next to Monitors. It's time to investigate!
From the initial page, select option 2 to see what type of monitor has been triggered. The monitor types will include system, job, and message. Since the bell is next to the system type, select option 1 to view more information. You will see your list of system monitors along with each monitor's status. Since the bell is next to WatchCpu, you know immediately a threshold has been reached. From here, you can drill down to see the CPU utilization (average) percent of the system all the way down to the specific job details. As shown in Figure 4, it appears the system CPU utilization (average) is over our threshold, and App3 is the highest contributing job, taking over 27 percent. At a job level, additional actions can be taken, such as hold, release, and end. In this case, using the option to hold the job may be the thing to do.
Figure 4: MC Pervasive (phone) and Operations Navigator (graph) show 27.9 percent for App3.
Whether you are at your desk using Operations Navigator or on the go using Management Central--Pervasive, you have the interface to help keep your systems running at their optimum performance. This is great all by itself, but there is even more!
Listening to Applications
Applications have other indicators to help identify problems. On an iSeries, a typical indicator of a problem would be a message sent to a message queue. Message queues can contain a wide range of messages, from informational messages indicating something has happened, to the other extreme of escape messages representing severe error situations. Filtering through all the message queues looking for important messages can be overwhelming for a single system, much less for multiples. This is where message monitors can help.Create a simple message monitor, called SysOperInq, to monitor all inquiry messages on the QSYSOPR message queue. When creating SysOperInq, you need to specify some basic information. From Operations Navigator, expand Management Central and Monitors. Select Message and the New toolbar button. As illustrated in Figure 5, this will bring up properties required to create a new message monitor.
Figure 5: You can easily add the messages you want SysOperInq to monitor.
On the General tab, specify the name as SysOperInq. Select the Messages tab to identify the important messages. For SysOperInq, select Inquiry from Type then press the Add button. This will add an entry to the list of messages selected. Since you want a visual indicator when using Management Central--Pervasive, select the Threshold checkbox at the bottom of the page and choose to be notified when one message is found. All the SysOperInq monitor information is complete. Press OK to have the monitor created.
Though starting a monitor can be done using Operations Navigator, go back to Management Central--Pervasive to start the monitor. From the initial page, drill down to the message monitors by selecting Monitors and then Messages. The monitors displayed in the list will be either running or failed. Therefore, SysOperInq is not shown, since it has just been created. Select the Menu option to view possible choices that will include such actions as start, stop, and restart on failed. Select the Start option and choose System1 and System2 for the endpoints. From the list of message monitors, you can select the Refresh option to get an updated list, which will now include SysOperInq.
There are more options available when message monitors are started. A few key ones include getting the list of messages, showing detail message information, and message actions (e.g., reply and delete). The message actions are extremely useful for handling the messages and could be used to handle the inquiry messages found by SysOperInq.
Knowing the Health of Your System
There is a range of checkups you may need for your systems, from a simple checkup to know if your systems are up and running, to something more advanced like monitoring performance or listening to your applications. To get the most from your system, ignite your imagination and use the functions described and the ones awaiting your discovery. Whether you are motivated to have system information at your fingertips or are looking for a way to justify buying a new gadget, Management Central--Pervasive will give you the capability to check on your systems from just about anywhere. For more information, go to www.ibm.com/servers/eserver/iseries/sftsol/pervasive.htm.Sue Townsend is an advisory software engineer at IBM Rochester. She can be reached via email at


 More than ever, there is a demand for IT to deliver innovation. Your IBM i has been an essential part of your business operations for years. However, your organization may struggle to maintain the current system and implement new projects. The thousands of customers we've worked with and surveyed state that expectations regarding the digital footprint and vision of the company are not aligned with the current IT environment.
 TRY the one package that solves all your document design and printing challenges on all your platforms. Produce bar code labels, electronic forms, ad hoc reports, and RFID tags – without programming! MarkMagic is the only document design and print solution that combines report writing, WYSIWYG label and forms design, and conditional printing in one integrated product. Make sure your data survives when catastrophe hits. Request your trial now! Request Now.
 Forms of ransomware has been around for over 30 years, and with more and more organizations suffering attacks each year, it continues to endure. What has made ransomware such a durable threat and what is the best way to combat it? In order to prevent ransomware, organizations must first understand how it works.
 Disaster protection is vital to every business. Yet, it often consists of patched together procedures that are prone to error. From automatic backups to data encryption to media management, Robot automates the routine (yet often complex) tasks of iSeries backup and recovery, saving you time and money and making the process safer and more reliable. Automate your backups with the Robot Backup and Recovery Solution. Key features include:
 Business users want new applications now. Market and regulatory pressures require faster application updates and delivery into production. Your IBM i developers may be approaching retirement, and you see no sure way to fill their positions with experienced developers. In addition, you may be caught between maintaining your existing applications and the uncertainty of moving to something new.
 IT managers hoping to find new IBM i talent are discovering that the pool of experienced RPG programmers and operators or administrators with intimate knowledge of the operating system and the applications that run on it is small. This begs the question: How will you manage the platform that supports such a big part of your business? This guide offers strategies and software suggestions to help you plan IT staffing and resources and smooth the transition after your AS/400 talent retires. Read on to learn:
LATEST COMMENTS
MC Press Online