


What is OpenUI5? Learn how to create tables with OpenUI5 and compare with GridX.
OpenUI5 is a recently open-sourced JavaScript library, similar to Dojo (everything is open-sourced and free). It has an active community and documentation on its website. In this article, we explore OpenUI5 and compare examples that were implemented with GridX in three previous articles (1, 2, and 3).
Basic Table
We'll start off with a table. My simple example is based off the OpenUI5 getting started page's example. With the OpenUI5 table, each column has 1) a label (a label object) and 2) a template (a text object with the key of the data values to be displayed). The three columns in this example are all text columns. Additionally, in this example, I added some optional properties: sortProperty, filterProperty, and width. Specifying a sortProperty and a filterProperty implicitly enables sorting and filtering for the table. I then specified some data locally, connected the data to the table, and placed the table into the HTML.
// create the Table control
var oTable = new sap.ui.table.Table({editable:true});
// define the Table columns
var oControl = new sap.m.Text({text:"{id}"}); // short binding notation
oTable.addColumn(new sap.ui.table.Column({
label: new sap.m.Label({text: "ID"}),
template: oControl,
sortProperty: "id",
filterProperty: "id",
width: "10%"
}));
oControl = new sap.m.Text({text:"{name}"});
oTable.addColumn(new sap.ui.table.Column({
label: new sap.m.Label({text: "Name"}),
template: oControl,
sortProperty: "name",
filterProperty: "name",
width: "30%"
}));
oControl = new sap.m.Text({text:"{location}"});
oTable.addColumn(new sap.ui.table.Column({
label: new sap.m.Label({text: "Location"}),
template: oControl,
sortProperty: "location",
filterProperty: "location",
width: "30%"
}));
// create some local data
var aData = [
{
id: "1",
name: "Randy",
location: "Raleigh",
percent: 5, used: 3, total: 64,
allow: false
},
{
id: "2",
name: "Arun",
location: "Austin",
percent: 3, used: 2, total: 64,
allow: true
},
{
id: "3",
name: "Susan",
location: "Rochester",
percent: 2, used: 1, total: 64,
allow: true
}
];
// create a JSONModel, fill in the data and bind the Table to this model
var oModel = new sap.ui.model.json.JSONModel();
oModel.setData({modelData: aData});
oTable.setModel(oModel);
oTable.bindRows("/modelData");
// place the Table into the UI
oTable.placeAt("content");
The result looks like so:
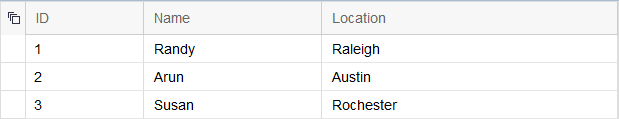
Figure 1: Here's the basic table.
Complicated Columns
What about more complicated tables with cells that incorporate complex widgets and HTML? In GridX, we used the decorator or editor functions to implement complex columns, but doing a column with a checkbox with OpenUI5 is pretty easy.
oControl = new sap.ui.commons.CheckBox({checked:"{allow}"});
oTable.addColumn(new sap.ui.table.Column({
label: new sap.m.Label({text: "Allow Attachment"}),
template: oControl,
sortProperty: "percent",
filterProperty: "percent",
width: "10%"
}));
And it looks slick:
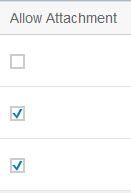
Figure 2: Now we have a column with checkboxes.
However, with OpenUI5, creating a column that had HTML labels for a progress bar like in TechTip: More GridX Features was more difficult. I used a grid object to contain two HTML objects and a progress indicator object. The first three parameters in the HTML objects (path, formatter, width) are similar to their GridX counterparts (the path parameter is analogous to the field parameter in GridX). I also specified layoutData using a GridData object to get the proportions right. The sizes are specified for different screens sizes (small, medium, large) on a scale from 1 to 12, a nice feature that allows you to tweak the relative proportions for mobile devices or tablets. I used the same proportions for all screen sizes, giving each HTML span half of the cell width, and the progress bar the full cell width on a second line.
oControl = new sap.ui.layout.Grid({
content: [
new sap.ui.core.HTML({
content: {
path: "used",
formatter: function(v) {
if (v) {
return '<span style="float: left; padding-top: 16px;">'
+ '<b>Used:</b> ' + v + '</span>';
}
}
},
width: "100%",
layoutData: new sap.ui.layout.GridData({
span: "L6 M6 S6"
})
}),
new sap.ui.core.HTML({
content: {
path: "total",
formatter: function(v) {
if (v) {
return '<span style="float: right; padding-top: 16px;"> '
+ '<b>Total:</b> ' + v + '</span>';
}
}
},
width: "100%",
layoutData: new sap.ui.layout.GridData({
span: "L6 M6 S6"
})
}),
new sap.m.ProgressIndicator({
layoutData: new sap.ui.layout.GridData({
span: "L12 M12 S12",
linebreakL: true,
linebreakM: true,
linebreakS: true
}),
percentValue: {
path: "percent",
formatter: function(cellValue) {
if (cellValue) {
this.setDisplayValue(cellValue + "%");
return cellValue;
}
}
}
})
]
});
oTable.addColumn(new sap.ui.table.Column({
label: new sap.m.Label({text: "Processors"}),
template: oControl,
sortProperty: "percent",
filterProperty: "percent",
width: "50%"
}));
It turned out like this:
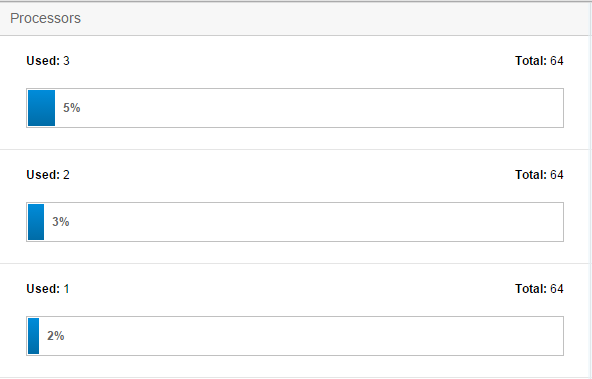
Figure 3: Columns now show a progress indicator.
Tree Table
Last but not least, we can create a tree table. OpenUI5 has an in-depth example here. The data has to be formatted hierarchically, but the rest of the Grid setup remains the same as in the previous examples.
// create the TreeTable
var oTable = new sap.ui.table.TreeTable();
// define the Table columns
var oControl = new sap.m.Text({text:"{name}"}); // short binding notation
oTable.addColumn(new sap.ui.table.Column({
label: new sap.m.Label({text: "Name"}),
template: oControl,
filterProperty: "name"
}));
oControl = new sap.m.Text({text:"{type}"});
oTable.addColumn(new sap.ui.table.Column({
label: new sap.m.Label({text: "Position"}),
template: oControl,
filterProperty: "type"
}));
// create some hierarchical data
var aData = [
{
name: "Ben Cartwright",
type: "Father",
0: {
name: "Adam Cartwright",
type: "Son"
},
1: {
name: 'Eric "Hoss" Cartwright',
type: "Son"
},
2: {
name: '"Little" Joe Cartwright',
type: "Son"
}
},
{
name: "Isaac",
type: "Father",
0: {
name: "Jacob",
type: "Son"
},
1: {
name: "Esau",
type: "Son"
}
}
];
// create a JSONModel, fill in the data and bind the Table to this model
var oModel = new sap.ui.model.json.JSONModel();
oModel.setData({modelData: aData});
oTable.setModel(oModel);
oTable.bindRows("/modelData");
I expanded the two top levels, and it looked like the following:
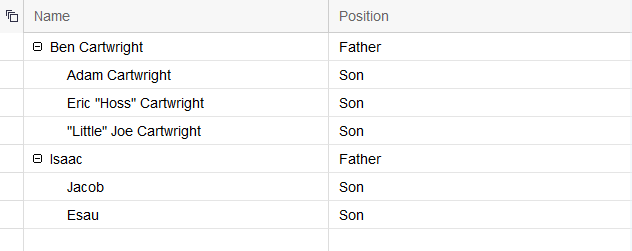
Figure 4: This is an example of a tree table.
Impressions
It wasn't hard to find examples and tutorials for OpenUI5. While interacting with the OpenUI5 TreeGrid, I noticed that the filtering seemed to work well "out of the box" even for the tree table. It's also a nice feature that the settings for different screen sizes were built in. Overall, OpenUI5 seems to have a thriving community and good documentation.


 More than ever, there is a demand for IT to deliver innovation. Your IBM i has been an essential part of your business operations for years. However, your organization may struggle to maintain the current system and implement new projects. The thousands of customers we've worked with and surveyed state that expectations regarding the digital footprint and vision of the company are not aligned with the current IT environment.
 TRY the one package that solves all your document design and printing challenges on all your platforms. Produce bar code labels, electronic forms, ad hoc reports, and RFID tags – without programming! MarkMagic is the only document design and print solution that combines report writing, WYSIWYG label and forms design, and conditional printing in one integrated product. Make sure your data survives when catastrophe hits. Request your trial now! Request Now.
 Forms of ransomware has been around for over 30 years, and with more and more organizations suffering attacks each year, it continues to endure. What has made ransomware such a durable threat and what is the best way to combat it? In order to prevent ransomware, organizations must first understand how it works.
 Disaster protection is vital to every business. Yet, it often consists of patched together procedures that are prone to error. From automatic backups to data encryption to media management, Robot automates the routine (yet often complex) tasks of iSeries backup and recovery, saving you time and money and making the process safer and more reliable. Automate your backups with the Robot Backup and Recovery Solution. Key features include:
 Business users want new applications now. Market and regulatory pressures require faster application updates and delivery into production. Your IBM i developers may be approaching retirement, and you see no sure way to fill their positions with experienced developers. In addition, you may be caught between maintaining your existing applications and the uncertainty of moving to something new.
 IT managers hoping to find new IBM i talent are discovering that the pool of experienced RPG programmers and operators or administrators with intimate knowledge of the operating system and the applications that run on it is small. This begs the question: How will you manage the platform that supports such a big part of your business? This guide offers strategies and software suggestions to help you plan IT staffing and resources and smooth the transition after your AS/400 talent retires. Read on to learn:
LATEST COMMENTS
MC Press Online