


Today, a lot of people use both telephones and computers for the purpose of communication. Phones and computers behave very similarly. If your phone is connected to a phone company, you can talk to anyone who has a phone number. Likewise, if your computer system is connected to the Internet, you can communicate with any other system that is connected to the Internet. The only difference is that phones use phone numbers and computers use IP addresses.
Phones (particularly cell phones) and computers share another commonality: connection failures. With phones, you may not be able to hear the other person very well or the connection may cut out. Those are issues you have to take up with your phone company. However, if your iSeries is having problems communicating with another system, you can trace the conversation your system is having with another system. Analysis of this trace can determine what is causing the problem.
STRCMNTRC or TRCCNN
To begin a communications trace on an iSeries, you need to know the line speed of your network card. To find the IP address that your iSeries is using, enter the command NETSTAT *IFC.
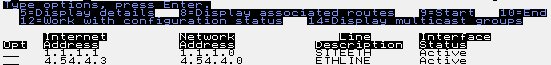
Figure 1: To find the IP address that your iSeries is using, enter the command NETSTAT *IFC. (Click images to enlarge.)
By hitting F11, you can tell if the interface is active or not. This is important information because this is how other systems determine how to communicate with your iSeries. To trace a conversation between two systems, you must know the line description that is being used by the interface that is communicating with the other system.
Once you know the line description, you can retrieve information about your network card. In the example above, we are concerned about the 4.54.4.3 interface, which has a line description called ETHLINE. To view information about ETHLINE, enter the DSPLIND ETHLINE command.
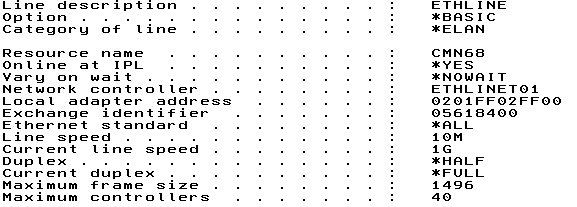
Figure 2: The Display Line Description screen shows all the information for a given line description.
This screen shows all the information for line description ETHLINE. The line speed is what you are concerned with when taking the trace. If the line speed is 10M or 100M, you will use the Start Communications Trace (STRCMNTRC) command to take a communications trace. However, if the line speed is 1G, you will have to use the Trace Connection (TRCCNN) command because the STRCMNTRC command is unable to trace all the packets when two systems are communicating across a gigabit line. However, the TRCCNN command can trace all packets across any line. The TRCCNN command did not come out until gigabit Ethernet was in existence. If you are at V5R1 or later, you should have the TRCCNN command. For prior releases, you will have to use the STRCMNTRC command. In this article, I'll discuss both commands.
STRCMNTRC
In this example, the line speed is 10M, so you can use the STRCMNTRC command. When entering the STRCMNTRC command, press F4 and then F9 to see the additional parameters.
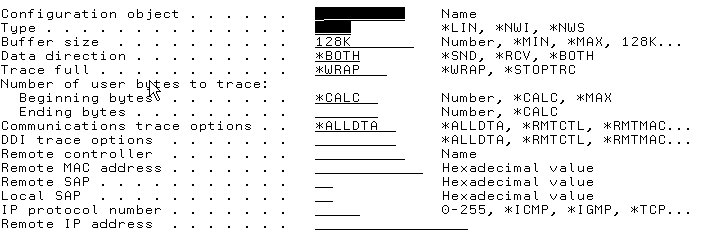
Figure 3: The STRCMNTRC screen allows you to enter the required parameters.
For this example, enter the line description value ETHLINE in the configuration object field, and enter *LIN for the type. Usually, you'll also need to increase the buffer size. This value depends on how much data you are going to trace between the two systems. For instance, if you are doing a file transfer with a large file and you feel that the systems are having some kind of problems communicating, then you might want to increase the buffer size to a larger value. For this example, enter 8M for the buffer size. You can also enter other parameters to narrow down the trace. For example, if you know the remote system's IP address, you could enter it in the Remote IP address field.
Once you have entered the parameters, hit Enter to start the tracing on the iSeries system. Every single packet that is sent out and received on that line will get traced.
You can then re-create the scenario that you were having. Once this is re-created, enter the End Communications Trace (ENDCMNTRC) command, using the line description that you used for the configuration object and *LIN for the type.
![]()
Figure 4: End the trace for the line description ETHLINE.
When the trace is ended, you can view the tracing information between the two systems. To do this, enter the Print Communications Trace (PRTCMNTRC) command to print the communications trace into a spooled file.
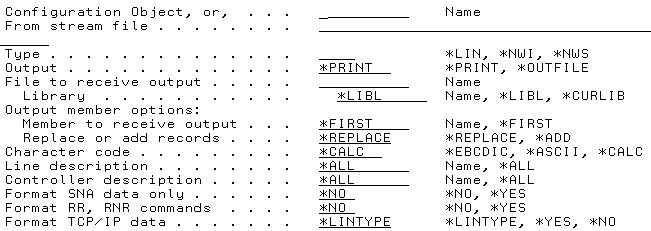
Figure 5: The PRTCMNTRC screen allows you to print the tracing information between the two systems.
For this example, enter ETHLINE for the configuration object. If you are using TCP/IP to communicate with other systems, it is important that you enter *YES into the Format TCP/IP data field.
Hit F9 and page down to see the PRTCMNTRC screen:
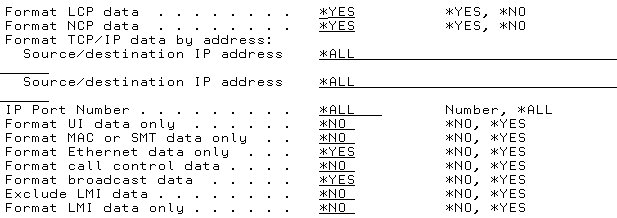
Figure 6: This area of the PRTCOMNTRC screen allows you to limit what information is printed.
This screen allows you to limit what information is printed. For instance, if you are only concerned about specific source and destination IP addresses, you can enter those values in the Format TCP/IP data by address fields. You can also make sure no broadcast data is shown within the trace.
Once you have narrowed down the fields, press Enter to print the communications trace into a spooled file under your user ID. The WRKSPLF command will allow you to view all your spooled files. Communications trace files that were printed by the PRTCMNTRC command are always named QPCSMPRT.
By entering 5 next to the QPCSMPRT spooled file, you can display the communications trace file.
TRCCNN
Now, I'll explain how to use the TRCCNN command to generate a communications trace.
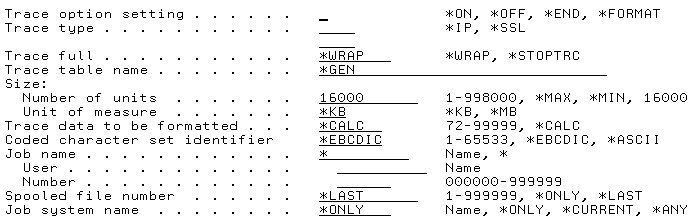
Figure 7: If you're at V5R1 or later, use the TRCCNN command instead of STRCMNTRC.
When using the TRCCNN command, you don't have to worry about a line description at all. You simply have to turn the trace option setting to *ON and specify the trace type to *IP. Within the extra parameters of TRCCNN, enter as much information as possible about the two devices communicating. Since TRCCNN doesn't need a line description parameter, it traces every packet that comes in and out of your iSeries. Because you're not limiting the trace to specific IP addresses, your file can fill up very quickly and wrap. Once you have entered all the parameters you want, hit Enter to re-create the communications problem. Once the problem is recreated, enter TRCCNN *OFF. This will output a QSYSPRT file within your spooled files.
Finding and Fixing the Problem
Once you have the whole conversation of your two systems within a spooled file, you need to see if your two conversations are having a problem and, if so, fix it. It is important to note that a communications trace will record all the packets that go in and out of the line. This means that there could be many conversations between your iSeries system and other remote systems within the trace. Sorting through the packets to find a certain conversation often takes time.
In the example above, I took a communications trace of our iSeries system trying to ping another iSeries system with an IP address of 33.33.33.33. Unfortunately, I didn't get any response back at all. When you ping another system, you're using a protocol called Internet Control Message Protocol (ICMP). This protocol allows SystemA to send an ICMP Request to SystemB. Anytime SystemB receives an ICMP Request, it should send back an ICMP Reply. If you look through the example trace, you will find an ICMP Request, but you will not see an ICMP Reply. The screen below shows that the packet was sent out with a message type of ECHO REQUEST that never received an ECHO REPLY. This means that the iSeries system was trying to say hello to 33.33.33.33, but 33.33.33.33 didn't respond.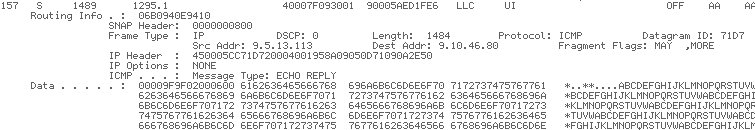
Figure 8: The packet was sent with a message type of ECHO REQUEST, but there was no response.
As you can see, going through a communications trace like this takes a lot of time and requires you to know the protocols by which computer systems talk to each other.
Communications Trace Analyzer to the Rescue
Fortunately, the Communications Trace Analyzer licensed program can go through a communications trace and find common communications problems, which saves you the time of trying to learn the TCP/IP, ICMP, and ARP communications protocols.
Communications Trace Analyzer is supported only on V5R2 systems, but you can take traces from prior releases and transfer them to a V5R2 system that has the Communications Trace Analyzer program installed.
To get Communications Trace Analyzer, download the TraceAnalyzer.ZIP file to your PC. Unzip the file and follow the install instructions located in a file called install.html within the installInstructions directory. These instructions explain the process of restoring the licensed program and installing the Communications Trace Analyzer iSeries Navigator plug-in.
Once the program is installed, you are ready to analyze a communications trace. We will analyze the trace that we took up above. After you have installed the iSeries Navigator plug-in, click on the iSeries system that the Communications Trace Analyzer licensed program is installed on and then right-click on Configuration and Service. Select Tools and then Communications Trace Analyzer.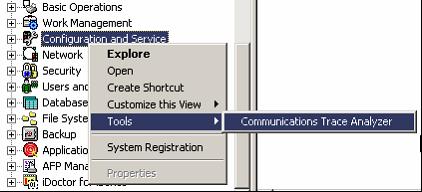
Figure 9: From iSeries Navigator, follow this path to the Communications Trace Analyzer.
This will bring up the Communications Trace Analyzer screen:
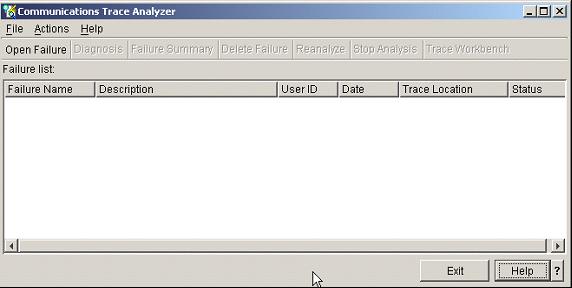
Figure 10: This is the Communications Trace Analyzer screen.
Since we already have created the communications trace, we want to open up a failure. To do this, click the Open Failure button.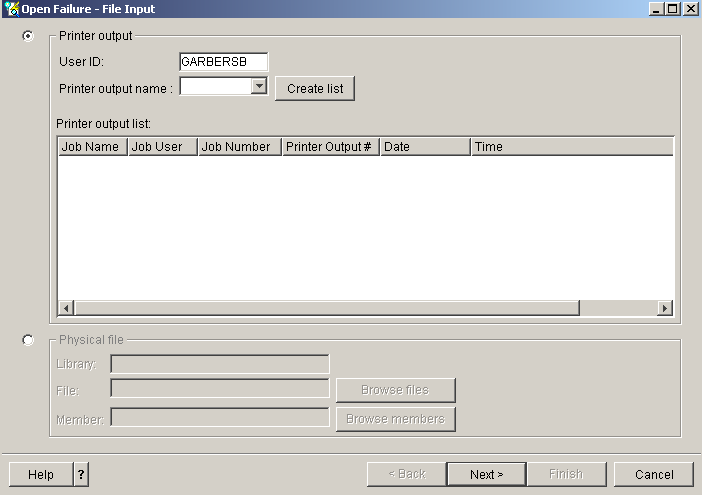
Figure 11: The Open Failure screen is where you begin your information search.
You now have to specify where your communications trace file is located. To view the communications trace files taken from the STRCMNTRC command, select QPCSMPRT in the Printer Output Name field. To view the communications trace files taken from the TRCCNN command, select QSYSPRT in the Printer Output Name field. Now, select the Create List button. You can also choose a physical file that was copied from a communications trace spooled file by selecting the Physical file radio button.
For our example, choose QPCSMPRT for the Printer Output Name. From the populated list of QPCSMPRT files, select the spooled file that was created from the PRTCMNTRC command, and then hit the Next button.
A progress bar will inform you that the communications trace file is being imported. Once it reaches 100%, the Failure Input screen will be shown.
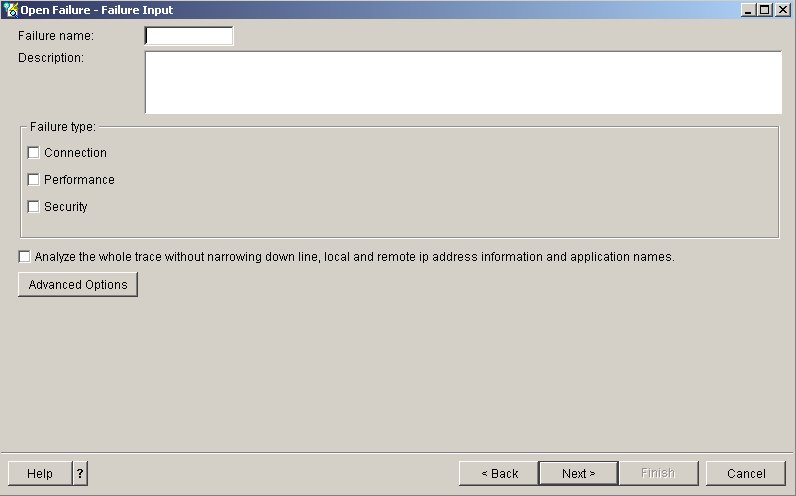
Figure 12: The Failure Input screen will come up when the communications trace file import is complete.
Here, you need to enter a failure name, a description, and the type of failure you think you are experiencing--either connection or performance. If you do not know exactly which IP addresses and applications are causing the problem, click on the checkbox that analyzes the whole trace without narrowing the line, local, and remote IP address information and application names. (In our example, we will analyze everything.)
However, if you do know this information, do not check that box. Now, hit Next to see the Failure Summary screen: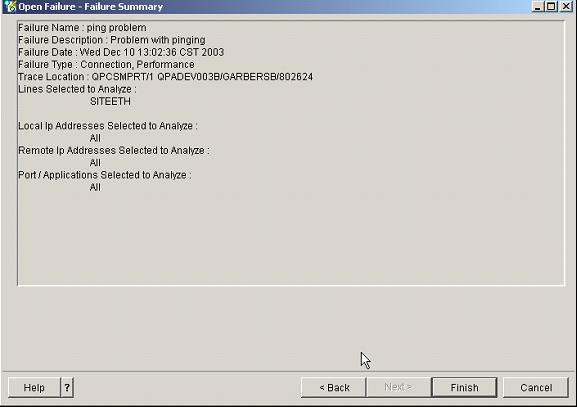
Figure 13: The Failure Summary screen shows the analysis choices you've made.
If everything looks correct, hit the Finish button to start the analysis. If not, hit the Back button to change what you want to analyze within the communications trace.
A screen will appear that shows the status of the trace progress as a percentage. When the status reaches Analysis Complete, you will see the diagnosis: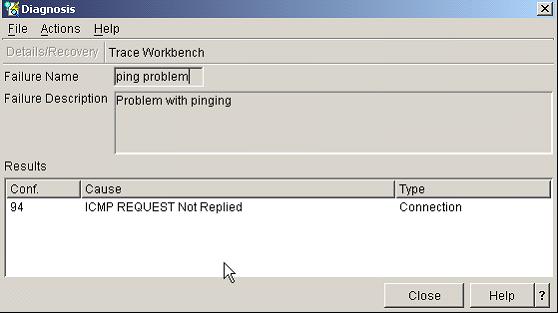
Figure 14: The Diagnosis screen reveals the source of the problem!
As you can see, the diagnosis is that ICMP Requests that are not being replied to. Highlight the ICMP REQUEST Not Replied result and then hit the Details/Recovery button to see what you can do for possible recovery.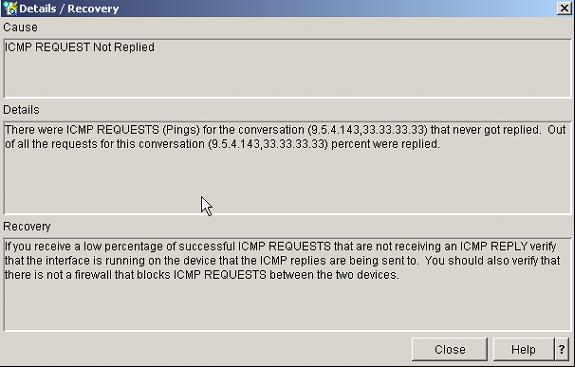
Figure 15: The Diagnosis screen reveals the problem and its solution!
To see where the problem is, click the Close button on the Details/Recovery screen. Then, on the Diagnosis screen, click the Trace Workbench button, which is located in the upper right corner.
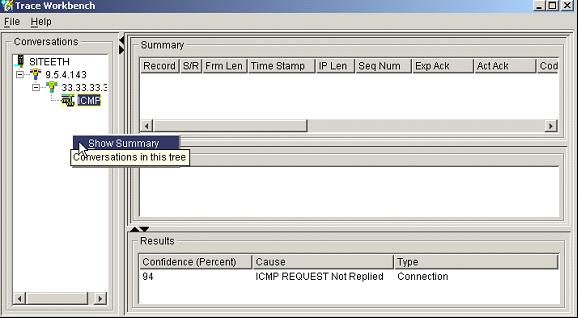
Figure 16: The Trace Workbench shows you all the conversations within a comm trace.
With this screen, you can view any conversation within the communications trace. To look at the different conversations, simply click on the tree. You will notice it shows you the line name, local IP address, and remote IP address. To look at the summary of the raw packets, right-click on the conversation you are concerned about and select Show Summary.
If you want to view where the communication problem is, right-click on one of the Results. For this example, right-click on the ICMP REQUEST Not Replied failure and choose Show Evidence. This will bring up the Evidence screen.
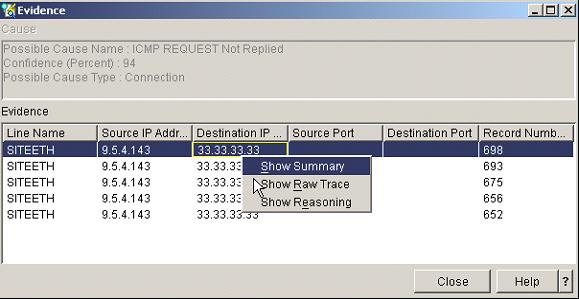
Figure 17: The Evidence screen shows you where the communication problem is.
This shows you all the possible failures within the trace. If you select a trace location that you are interested in and then right-click, you will have the options of showing the summary frames or raw frames of where the failure is located and also have the capability of viewing the reason the trace location was selected.
Improving Your Communication Skills
When you're having a communication problem, this is an easy way of figuring out what the problem is, at least at the basic level of the TCP/IP protocol. It saves you the time of sorting out all the different conversations within the trace. You also don't have to learn every detail about the TCP/IP protocol. Of course, what is actually causing the particular connection or performance problem may depend on what the applications and/or systems are doing and may require further detailed analysis beyond what the Trace Analyzer can tell you. But this at least gives you a place to start and an idea of where the problem lies.
Benjamin Garbers is a Software Engineer within the Rochester Support Center. He is currently developing Internet applications for IBM's iSeries Technical Web site.

 More than ever, there is a demand for IT to deliver innovation. Your IBM i has been an essential part of your business operations for years. However, your organization may struggle to maintain the current system and implement new projects. The thousands of customers we've worked with and surveyed state that expectations regarding the digital footprint and vision of the company are not aligned with the current IT environment.
 TRY the one package that solves all your document design and printing challenges on all your platforms. Produce bar code labels, electronic forms, ad hoc reports, and RFID tags – without programming! MarkMagic is the only document design and print solution that combines report writing, WYSIWYG label and forms design, and conditional printing in one integrated product. Make sure your data survives when catastrophe hits. Request your trial now! Request Now.
 Forms of ransomware has been around for over 30 years, and with more and more organizations suffering attacks each year, it continues to endure. What has made ransomware such a durable threat and what is the best way to combat it? In order to prevent ransomware, organizations must first understand how it works.
 Disaster protection is vital to every business. Yet, it often consists of patched together procedures that are prone to error. From automatic backups to data encryption to media management, Robot automates the routine (yet often complex) tasks of iSeries backup and recovery, saving you time and money and making the process safer and more reliable. Automate your backups with the Robot Backup and Recovery Solution. Key features include:
 Business users want new applications now. Market and regulatory pressures require faster application updates and delivery into production. Your IBM i developers may be approaching retirement, and you see no sure way to fill their positions with experienced developers. In addition, you may be caught between maintaining your existing applications and the uncertainty of moving to something new.
 IT managers hoping to find new IBM i talent are discovering that the pool of experienced RPG programmers and operators or administrators with intimate knowledge of the operating system and the applications that run on it is small. This begs the question: How will you manage the platform that supports such a big part of your business? This guide offers strategies and software suggestions to help you plan IT staffing and resources and smooth the transition after your AS/400 talent retires. Read on to learn:
LATEST COMMENTS
MC Press Online