


Lots of great tools are available to help you evaluate and manage performance.
When looking at performance issues, I tend to group them into the following categories:
- CPU bound
- Memory bound
- Disk access
- Network
- Process monitoring
This article looks at some of the popular tools available to gather information. Based on that information, you can then implement performance-related changes if required.
Please note: When considering performance tuning, you are strongly advised to gather evidence of the performance loss or examine the area in which you want to make gains before making tuning changes.
Always note any changes you make so that you can back out if the change you made has caused more issues or has not improved performance. Also, be aware of the "little picture" syndrome; it's no good trying to improve, say, disk operations if you have a slow network. The users will notice little difference.
In this article, I will try to be generic when using the tools and thus not specific to certain applications; this helps broaden scope of the article. Let's look at the most common tools that are available to show or gather system performance-related information.
Nmon
Without a doubt (in my opinion), the best tool to gather or record system information is nmon. Nmon comes with additional tools for presentation. Particularly helpful is the spreadsheet converter, which presents the metrics data in graphical format on your PC using Excel or some other similar spreadsheet product. Download nmon here.
Nmon is typically run from AIX's cron scheduler and commonly runs through a 24-hour cycle. This approach allows the systems administrator to go back in time and view the graphical charts. Nmon will report on the following:
- CPU
- Memory
- Network
- File systems
- Disks
- Top-running processes
- Paging spaces
- LPARS
- Summaries
An example of one of the many reports nmon generates is shown in Figure 1, nmon_cpu. This report shows the CPU usages and the applications/processes that were running during a specific time span. The interval for this demonstration represents the nightly batch processing window. We can see that, between 10:00 p.m. (22:00) and midnight (24:00), CPU usage peaked.
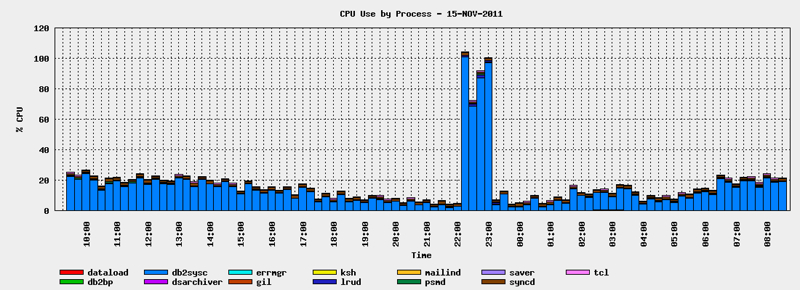
Figure 1: The nmon_cpu report shows CPU usage. (Click images to enlarge.)
To run nmon for a 24-hour cycle (well, nearly 24 hours), you need to know the format of the cycles. It is best to have each daily capture be just short of 24 hours in order to avoid overlap of performance information from one day to the next. The most common parameters are these:
- -f means output to spreadsheet format
- -t includes top-running processors
- -s is interval in seconds
- -c is the number of counts between intervals
- -m is the destination directory for the output file, which would be in the format <hostname<date>.nmon
To run for nearly 24 hours (in this demonstration, it's 23.75 hours), I could use the following:
- -s would be 900 (900 seconds = 15 minutes)
- -c would be 95 counts
Using the above numbers, we come up with 23.75 hours, like so:
15 mins * 95 / 60 = 23.75 hours
So, the following crontab entry would generate a daily 24-hour system report. Cron will execute this every day at 9:00 a.m. (09:00).
00 09 * * * /usr/bin/nmon -f -t -s 900 -c 95 -m /opt/dump/nmon
Topas
The tool that will generally be the first port of call for any system admins when experiencing performance issues is topas. Though topas can record and graph, it's more commonly used in real-time mode to see what's happening on the system at a particular point in time. Topas will show everything you need to know to make a quick decision on where the impact is. To navigate through the different real-time reports, be sure to read the man page. Most operations are carried out using keystrokes from the keyboard. Topas will report on these issues:
- Memory
- Paging space
- NFS
- CPU
- Network
- LPARS
- Workloads
- Disks
- Processors using resources
Figure 2 shows a topas screenshot. In this example, it's displaying in real time the top processes that are using the paging space. Displaying this screen is accomplished by hitting : P on the keyboard and then using the arrow keys to move to the PAGESPACE column. To highlight top CPU processors, use the arrow key to move to the CPU% column.
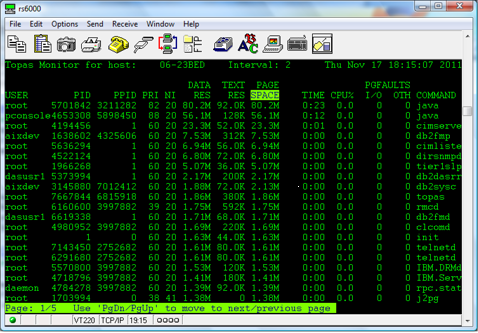
Figure 2: In this screenshot, topas shows the processes that are using the paging space.
Sar
The system activity reporter sar command is the stable diet of system admins in gathering command-line-readable information about the system. It's typically run from cron but is occasionally run directly from the command line. Sar will, by default, report on user activity, percentage of CPU activity, the time processors were idle, and the number of CPUs used, though sar can report on many different system activities. The following sar example will generate statistics three times running at five-second intervals:
# sar 5 3
AIX rs6000 1 7 00C23BED4C00 11/17/11
System configuration: lcpu=4 ent=1.00 mode=Uncapped
13:21:35 %usr %sys %wio %idle physc %entc
13:21:40 30 59 0 11 1.24 124.3
13:21:45 24 64 1 11 1.09 108.9
13:21:50 36 53 1 10 1.63 163.0
Average 31 58 0 11 1.32 132.0
Check the Loads
One of the oldest and most commonly used commands is the uptime command. It's a favorite because its output is used in many scripts to report on load averages. It's commonly used in alert email scripts that are run on the system and are sent when load averages hit a certain level, like 60 or 70, to forewarn system admins of a potential issue. The output shown below produces the total time the system has been up in a day and the number of users connected. The load average is displayed in intervals of 1, 5, and 15 minutes:
$ uptime
03:37PM up 179 days, 4:38, 27 users, load average: 3.34, 2.39, 2.26
Mpstat
Mpstat will report on all CPU devices, which is particularly useful when investigating CPU bottlenecks. In the following output, mpstat will run once at a 5-second interval:
# mpstat 5 1
System configuration: lcpu=4 ent=1.0 mode=Uncapped
cpu min maj mpc int cs ics rq mig lpa sysc us sy wt id pc %ec lcs
0 4940 0 1 632 685 268 0 320 100 263924 42 55 0 4 0.57 35.1 277
1 990 0 3 1387 2234 805 0 684 100 130290 28 47 0 25 0.27 16.6 649
2 3943 0 2 531 663 223 0 389 100 276520 44 54 0 3 0.57 34.9 270
3 1298 0 2 1856 2742 846 0 752 100 82141 31 40 0 29 0.22 13.4 650
ALL 11171 0 8 4406 6324 2142 0 2145 100 752875 39 51 0 10 1.63 163.1 1846
Of particular interest is the column maj; this is the total major page faults (i.e., when AIX tries to get a page that is not resident in real memory). In the above output, there is none, so all looks good. A quick way to see how busy your CPUs are is to use this command:
# mpstat -s
System configuration: lcpu=4 ent=1.0 mode=Uncapped
Proc0 Proc2
39.20% 38.60%
cpu0 cpu1 cpu2 cpu3
20.54% 18.66% 20.00% 18.61%
In the above output, we can see that we have two physical CPUs split into two logical CPUs. The percentages of the spread show how busy they are.
Svmon
To look at memory consumption, svmon is the command line tool for you. Svmon will report on general memory usage across the system. It can be run at intervals to gather information over a period. AIX differs from other UNIX operating systems in that it will use all the available memory from the start, so if you see the system using nearly all the memory, this is normal. To display the global memory spread that is in use on a system, with the usage in GB, use this code:
# svmon -G -O unit=GB
Unit: GB
-------------------------------------------------------------------------------
size inuse free pin virtual available
memory 8.50 8.48 0.02 2.14 13.9 1.04
pg space 17.1 7.24
work pers clnt other
pin 1.85 0 0 0.29
in use 6.94 0 1.54
The above output reports on size of real memory, total memory currently in use, free memory, memory that is pinned (that is, it will stay in memory and not be swapped out to paging space), and virtual memory. The report also displays information on workloads and persistent and client memory.
To find out how much memory user ukinst2 is using, use this code:
# svmon -U | head -n 3; svmon -U -O unit=GB |grep ukinst2
User Inuse Pin Pgsp Virtual
ukinst2 1.16 0.03 0.03 0.50
In the above output, we can determine that user ukinst2 is using 1.16 GB of real memory, 30MB is used by the paging space, 30MB is pinned in memory, and 50MB is currently in virtual memory.
You can also use svmon -U to produce a list of all users and their respective memory use.
There is also the vmstat command, which provides reports similar to those of svmon but without as much detail.
Lvmstat
If the system is suffering from extreme disk activity, you need to identify the source. The lvmstat command will provide information on hotspots contained in your Volume Groups, or Logical Volumes. First, enable logging using lvmstat on the required Volume Group—in this example, appsvg:
# lvmstat -v appsvg -e
Next, you could run a report on all Logical Volumes contained in that Volume Group, running at 2-second intervals, producing five reports:
# lvmstat -v appsvg 2 5
Logical Volume iocnt Kb_read Kb_wrtn Kbps
fslv05 19460 280 4165952 1091.84
fslv04 291 20 68480 17.95
loglv00 16 0 64 0.02
fslv03 0 0 0 0.00
fslv02 0 0 0 0.00
Logical Volume iocnt Kb_read Kb_wrtn Kbps
fslv04 416 16 104448 52232.00
Logical Volume iocnt Kb_read Kb_wrtn Kbps
fslv04 404 12 101376 50694.00
Logical Volume iocnt Kb_read Kb_wrtn Kbps
fslv04 390 12 98304 49158.00
Logical Volume iocnt Kb_read Kb_wrtn Kbps
fslv04 386 12 97280 48646.00
In the above output, we can determine that the Logical Volume fslv04 is getting a high write hit rate, which will require further investigation. To produce a running output of the Logical Volume fslv04, you could use this command:
# lvmstat -l fslv04 2
Log_part mirror# iocnt Kb_read Kb_wrtn Kbps
16 1 165 60 32764 7.76
1 1 162 24 32648 7.72
4 1 157 48 32768 7.75
32 1 131 0 32532 7.69
10 1 130 0 32768 7.74
…
…
To disable the logging on the Volume Group appsvg, use this:
# lvmstat -l appsvg -d
Multi-Threading Enabled
Be sure to have simultaneous multi-threading processors enabled on your AIX box to increase process run times. If your AIX box does linear heavy number-crunching, there will probably be no gains. To see if it's active, use this:
# smtctl
This system is SMT capable.
This system supports up to 2 SMT threads per processor.
SMT is currently enabled.
SMT boot mode is not set.
SMT threads are bound to the same physical processor.
proc0 has 2 SMT threads.
Bind processor 0 is bound with proc0
Bind processor 1 is bound with proc0
Note that the above output states "SMT is currently enabled." This means it's active. To enable it if it is not active, use this:
# smtctl -m on
Bindprocessor
There will be occasions when you need to get a process completed, but it's in contention with other processes during peak load times on the system. One method available is to bind the process to a dedicated CPU. Using the bindprocessor command, display your current processors:
# bindprocessor -q
The available processors are: 0 1
In the above output, we have two processors. Let's now bind a DB2 instance to processor 1. First, get the process ID of the db2instance, which in this example is db2sysc, which is owned by aixdev:
# ps -ef |grep db2sysc
aixdev 4325606 7209196 0 17:49:38 - 0:00 db2sysc 0
Next, bind process ID 4325606 to processor 1, like so:
# bindprocessor 4325606 1
To confirm it's bound, the BND column should have a value of 1 for the process ID of 4325606, which it has:
# ps -emo THREAD| grep db2sysc
USER PID PPID TID ST CP PRI SC WCHAN F TT BND COMMAND
aixdev 4325606 7209196 - A 0 60 1 - 40001 - 1 db2sysc 0
…
…
After load-processing has completed, you can unbind the process and confirm it is unbound:
# bindprocessor -u 4325606
# ps -emo THREAD| grep db2sysc
USER PID PPID TID ST CP PRI SC WCHAN F TT BND COMMAND
aixdev 4325606 7209196 - A 0 60 1 - 40001 - - d b2sysc 0
Sparsely Does It
Coming across sparse files is a common occurrence when dealing with database systems, especially Oracle. Sparse files have indexes that are not mapped to a data block, causing null data; thus, it's difficult to gauge the size, though the du command can report it correctly. You may think the file is, say, 1GB in size when in fact it could be 10 or 20GB in size. Sparse files can cause headaches, as they fill up file-system space and tie up file-system resources if there are a lot of them. These files can be moved around, but be sure you use the correct tool like gnu tar or backup. If you don't, the copy will go on forever and the file system will run out of space. To identify a sparse file, use the fileplace command:
# fileplace myfile
File: myfile Size: 52299 bytes Vol: /dev/hd3
Blk Size: 4096 Frag Size: 4096 Nfrags: 1
Logical Extent
00060386 1 frags 4096 Bytes, 100.0%
unallocated 12 frags 49152 Bytes 0.0%
Notice in the above output of the file myfile the unallocated 4K 12 blocks; this is indicative of a sparse file. Normal files will have no unallocated blocks. Now that you know how to determine a sparse file, you can monitor or act on it.
Thanks for the Memory
When an application is in use and requires more memory, if there is not enough in the system to give it more, then portions will be paged into the paging space (see the Paging Space section below). You can avoid this paging by locking the application into memory, also known as pinning. The application to be pinned will require further configuration for this, so use the following vmo command to view current attributes set:
# vmo -a
To enable pinning, use this command:
# vmo –p –o v_pinshm=1
In normal operations, AIX will move page frames that contain files and programs around in order to free up memory. To help AIX know what percentage to reach before it does this, three settings can be used:
- maxperm
- minperm
- maxclient
If the amount of pages is above the maxclient and maxperm, then pages will be moved. If the amount of pages is between minperm and maxclient, pages are moved based on past history page movement. There is a direct memory relationship between maxclient and maxperm; it should either be the same as or less than the value of maxperm.
# vmo -a |grep -w maxperm%
maxperm% = 90
# vmo -a |grep -w maxclient%
maxclient% = 90
The minperm% should ideally be set quite low:
# vmo -a |grep -w minperm%
minperm% = 5
Paging Space
The paging space, sometimes called swap space, is used when an application or process cannot be accommodated fully into the current memory allocation. When this happens, memory pages are moved out to the paging space. (Actually, there's a lot more to it than that, but that that topic is out of scope for this article.) So how much paging space should you have? Well, that depends on the type of applications you're running. As a rule of thumb, I create the paging space size to be 1.5 times the amount of the memory size. By default, AIX will use the paging device to hold the dump file if the system crashes. This is the case if you have a system with a small amount of memory. Boxes with large amounts of memory have separate dump devices for their core dumps; however, you can create your own dump devices no matter how small your memory is.
Some system admins have very little paging space configured to ensure everything stays in memory. This approach is generally used when performance is a high priority and no paging of the application should happen.
A newly installed AIX box with 2GB of memory would as a rule have 512MB for the paging space:
# lsps -s
Total Paging Space Percent Used
512MB 23%
To view full details of the paging space, use this command:
# lsps -a
Page Space Physical Volume Volume Group Size %Used Active Auto Type Chksum
hd6 hdisk0 rootvg 512MB 23 yes yes lv 0
Paging space usage should be reviewed constantly. If you're running out of paging space, increase the paging space device. If you're still running out of paging space, create a device and place it on different disks.
Async It
If you have database systems like Oracle, DB2, or Sybase, be sure to enable async I/O as some database systems won't run without it. Async I/O allows other processing to continue before it has committed a transaction. A maximum of 10 processes running per CPU is generally considered the standard. To see if async I/O is running, use this command:
# pstat -A| grep aio
67 s 430f1 2008a unbound RR 27 0 aioserver
70 s 46011 3a076 unbound RR 27 0 aioserver
104 s 680ff 28088 unbound RR 27 0 aioserver
…
…
In AIX version 6 and up, aio is dynamic and can be viewed via the ioo command.
Increase Bandwidth
To increase network bandwidth to your box, you can create an etherchannel. This involves using two or more network cards and binding them up to create an etherchannel interface. Doing so can double the capacity of the data going through the network card. Also consider enabling jumbo frames, which allows bigger frames through your card than the standard 1500 frames allowed. Extra work needs to be done on the switch side for both of the above changes to work.
Summary
The performance tools I covered in this article allow the system admin to gather information from the system on the current (and past) workloads. Using this information, anyone should be able to find what the potential performance issues might be and, more importantly, where the source of the problem is.


 More than ever, there is a demand for IT to deliver innovation. Your IBM i has been an essential part of your business operations for years. However, your organization may struggle to maintain the current system and implement new projects. The thousands of customers we've worked with and surveyed state that expectations regarding the digital footprint and vision of the company are not aligned with the current IT environment.
 TRY the one package that solves all your document design and printing challenges on all your platforms. Produce bar code labels, electronic forms, ad hoc reports, and RFID tags – without programming! MarkMagic is the only document design and print solution that combines report writing, WYSIWYG label and forms design, and conditional printing in one integrated product. Make sure your data survives when catastrophe hits. Request your trial now! Request Now.
 Forms of ransomware has been around for over 30 years, and with more and more organizations suffering attacks each year, it continues to endure. What has made ransomware such a durable threat and what is the best way to combat it? In order to prevent ransomware, organizations must first understand how it works.
 Disaster protection is vital to every business. Yet, it often consists of patched together procedures that are prone to error. From automatic backups to data encryption to media management, Robot automates the routine (yet often complex) tasks of iSeries backup and recovery, saving you time and money and making the process safer and more reliable. Automate your backups with the Robot Backup and Recovery Solution. Key features include:
 Business users want new applications now. Market and regulatory pressures require faster application updates and delivery into production. Your IBM i developers may be approaching retirement, and you see no sure way to fill their positions with experienced developers. In addition, you may be caught between maintaining your existing applications and the uncertainty of moving to something new.
 IT managers hoping to find new IBM i talent are discovering that the pool of experienced RPG programmers and operators or administrators with intimate knowledge of the operating system and the applications that run on it is small. This begs the question: How will you manage the platform that supports such a big part of your business? This guide offers strategies and software suggestions to help you plan IT staffing and resources and smooth the transition after your AS/400 talent retires. Read on to learn:
LATEST COMMENTS
MC Press Online