


These charts are similar in terms of internal structure, but they produce very different results. See examples of each type, and get tips on the best uses for each.
When I started my research for this TechTip, I realized that the Column API had a very similar structure to the Line API. Curious, I reviewed the Area API, only to find out that its structure was the same as the other two. In the end, what started as a TechTip about only the column API became a TechTip about the column, line, and area APIs.
This three-in-one required some tweaking on the original column template, as well as on the procedure. Let's start with the template:
/$Header
<!DOCTYPE html PUBLIC "-//W3C//DTD XHTML 1.0 Strict//EN" "http://www.w3.org/TR/xhtml1/DTD/xhtml1-strict.dtd">
<html xmlns="http://www.w3.org/1999/xhtml">
<head>
<meta http-equiv="content-type" content="text/html; charset=utf-8"/>
<title>
/%PageTitle%/
</title>
<script type="text/javascript" src="https://www.google.com/jsapi"></script>
<script type="text/javascript">
google.load("visualization", "1", {packages:["corechart"]});
google.setOnLoadCallback(drawChart);
function drawChart() {
var data = new google.visualization.DataTable();
data.addRows(/%TotalRows%/);
data.addColumn('string', 'col1');
/$Column
data.addColumn('/%ColumnType%/', '/%ColumnTitle%/');
/$FirstRow
data.setValue(/%RowNbr%/, 0, '/%RowTitle%/');
/$Row
data.setValue(/%RowNbr%/, /%ColNbr%/, /%CellValue%/);
/$OptionsBegin
var options = {
/$Option
'/%OptionTitle%/': /%OptionValue%/
/$OptionsEnd
};
/$Footer
var chart = new google.visualization./%ChartType%/Chart(document.getElementById('chart_div'));
chart.draw(data, options);
}
</script>
</head>
<body>
<div id="chart_div"></div>
</body>
</html>
The template has the standard Header, Row, and Footer sections, along with the Options sections that I started to include a few Tips back. However, it also includes Column and FirstRow sections that I used on the bar chart TechTip. These last sections are required because the APIs can handle multiple values per row. These values will be grouped in different ways on the three types of chart, but they will be displayed together. (This may sound a bit confusing, but it will be clearer when you see the examples.)
Each value within the row will be a cell, just like on a spreadsheet. The first cell of each row will contain the title of that row. This will be handled by the FirstRow section. After that, multiple Row sections will be written, up to the maximum number of columns defined. This two-dimensional matrix required some special coding on the GenCLAChart procedure (which can be found in the QRPGLESRC/GENCHRT source member of the downloadable code). I had to use a cycle within a cycle to loop through the rows and, within each row, through each cell.
Here's how I did it:
// FirstRow And Row Sections
For W_RowIdx = 1 to C_CLAMaxRows;
If P_CLARowDS(W_RowIdx).RowTitle = *Blanks;
Leave;
EndIf;
// Update the Row variables
updHtmlVar('RowNbr' : %Char(W_RowIdx-1));
updHtmlVar('RowTitle' : %Trim(P_CLARowDS(W_RowIdx).RowTitle));
// Write the FirstRow section
WrtSection('FirstRow');
For W_ColIdx = 1 to C_CLAMaxColumns;
If P_CLARowDS(W_RowIdx).Cell(W_ColIdx).CellValue= *Zeros;
Leave;
EndIf;
updHtmlVar('ColNbr' : %Char(W_ColIdx));
updHtmlVar('CellValue' : %Char(
P_CLARowDS(W_RowIdx).Cell(W_ColIdx).CellValue));
// Write the Row section
WrtSection('Row');
EndFor;
EndFor;
The only problem was that you could decide not to provide values for all the cells in each row or for all the rows (the maximum number of rows is defined in the C_CLAMaxRows constant). This problem was solved by checking whether the data structure fields shown below were filled right in the beginning of each iteration of the respective cycles:
P_CLARowDS(W_RowIdx).Cell(W_ColIdx).CellValue
P_CLARowDS(W_RowIdx).RowTitle
However, this coding assumes that a missing value indicates that the data for that row is over. If you want to allow missing values in the middle of a row, just change the "Leave" statement to an "Iter" statement. Just one more detail: this procedure has a rather unique parameter, the P_ChartType. As the name implies, it's used to determine which type of chart (column, line, or area) will be produced. The rest of the procedure's code is quite simple and similar to the previously presented procedures in this TechTip series.
As you probably guessed by now, this procedure can also be used to produce bar charts, since they are also part of Google's "corechart" package and the bar chart shares the same structure used by these three types of chart. The procedure needs only a few adjustments related to the P_ChartType parameter. If you want to do it, just allow the B value in the Init routine check and translate it into Bar on the Footer section of the Proc routine.
Now let's see what this piece of code can generate. I provided three sample programs (TSTGENCLA1, TSTGENCLA2, and TSTGENCLA3), each of them producing a different type of chart. You can transform the chart produced by the first sample program just by changing the value assigned to the P_ChartType variable to L or A. That will cause Figure 1 to become Figure 2, as shown below:
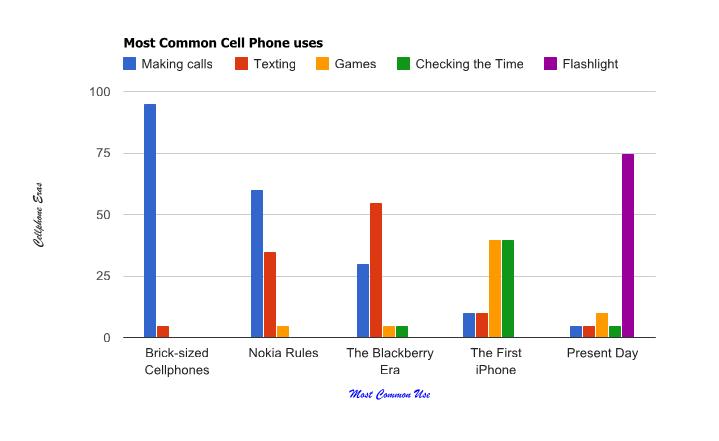
Figure 1: You had a column chart.
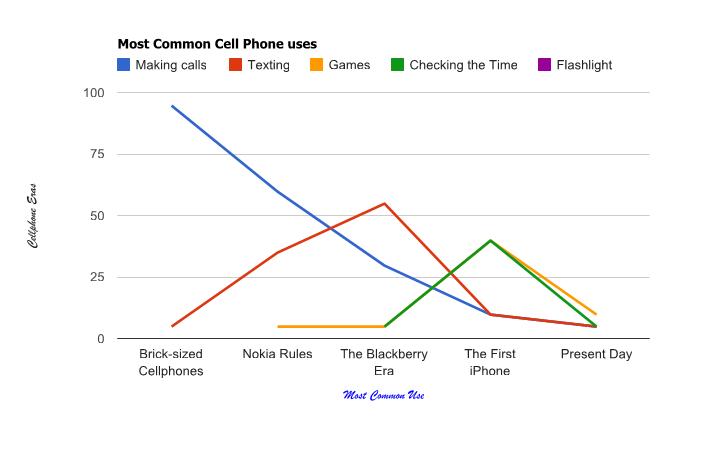
Figure 2: Now your column chart is a line chart.
The values are exactly the same, but their graphical representation lost clarity. Depending on the number of columns and distribution of the values, what seemed a perfectly good choice can produce a rather confusing result.
Another example: let's take the line chart produced by TSTGENCLA2 and change it to a column chart. We'll go from what's shown in Figure 3 to what's shown in Figure 4:
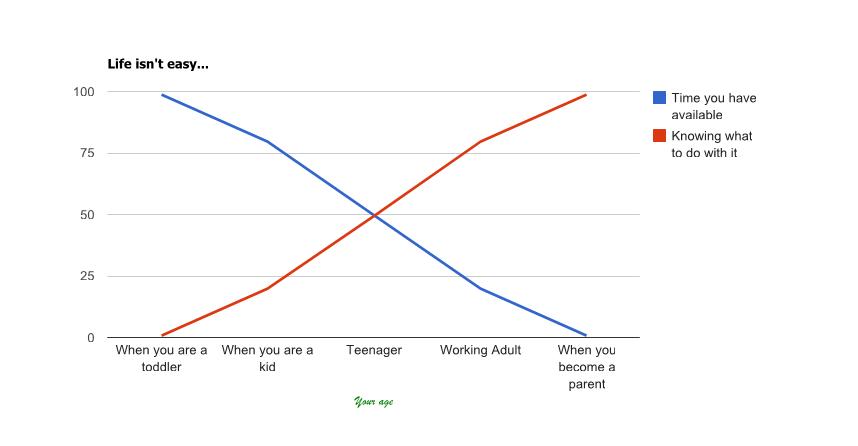
Figure 3: You start with a line chart.
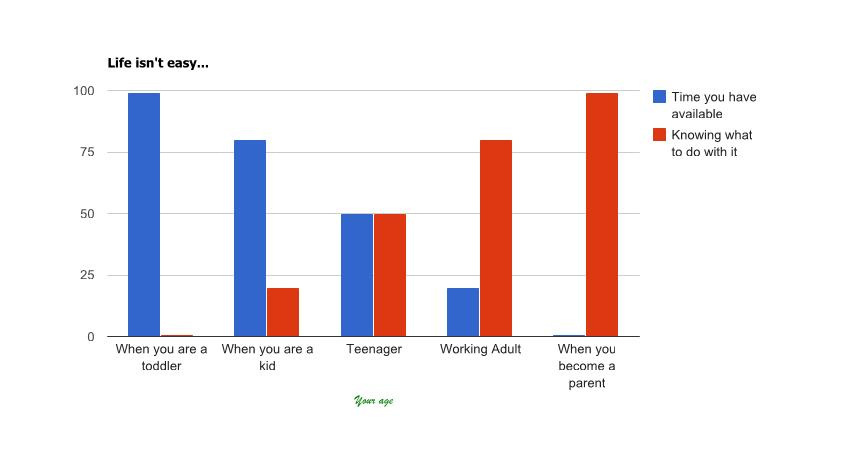
Figure 4: You change the line chart to a column chart.
Again, it loses clarity, and the evolution of the values also loses impact. So, what's the lesson here? As a rule of thumb, I would say that the line and area charts are better suited for fewer columns and more rows than the column chart. This is just my humble opinion, and I'm definitely not the world's leading chart expert, so feel free to use this procedure in any way that you'd like. If you figure out a way to improve it, be sure to let me know!
I'm available for any questions or suggestions you may have. The next TechTip of this series will go back to the maps, by presenting the Intensity Map API.

Rafael Victória-Pereira has more than 20 years of IBM i experience as a programmer, analyst, and manager. Over that period, he has been an active voice in the IBM i community, encouraging and helping programmers transition to ILE and free-format RPG. Rafael has written more than 100 technical articles about topics ranging from interfaces (the topic for his first book, Flexible Input, Dazzling Output with IBM i) to modern RPG and SQL in his popular RPG Academy and SQL 101 series on mcpressonline.com and in his books Evolve Your RPG Coding and SQL for IBM i: A Database Modernization Guide. Rafael writes in an easy-to-read, practical style that is highly popular with his audience of IBM technology professionals.
Rafael is the Deputy IT Director - Infrastructures and Services at the Luis Simões Group in Portugal. His areas of expertise include programming in the IBM i native languages (RPG, CL, and DB2 SQL) and in "modern" programming languages, such as Java, C#, and Python, as well as project management and consultancy.
MC Press books written by Rafael Victória-Pereira available now on the MC Press Bookstore.
 |
Evolve Your RPG Coding: Move from OPM to ILE...and Beyond Transition to modern RPG programming with this step-by-step guide through ILE and free-format RPG, SQL, and modernization techniques. List Price $79.95 Now On Sale
|
|
 |
Flexible Input, Dazzling Output with IBM i Uncover easier, more flexible ways to get data into your system, plus some methods for exporting and presenting the vital business data it contains. Now On Sale
|
|
 |
SQL for IBM i: A Database Modernization Guide Learn how to use SQL’s capabilities to modernize and enhance your IBM i database. Now On Sale
|


 More than ever, there is a demand for IT to deliver innovation. Your IBM i has been an essential part of your business operations for years. However, your organization may struggle to maintain the current system and implement new projects. The thousands of customers we've worked with and surveyed state that expectations regarding the digital footprint and vision of the company are not aligned with the current IT environment.
 TRY the one package that solves all your document design and printing challenges on all your platforms. Produce bar code labels, electronic forms, ad hoc reports, and RFID tags – without programming! MarkMagic is the only document design and print solution that combines report writing, WYSIWYG label and forms design, and conditional printing in one integrated product. Make sure your data survives when catastrophe hits. Request your trial now! Request Now.
 Forms of ransomware has been around for over 30 years, and with more and more organizations suffering attacks each year, it continues to endure. What has made ransomware such a durable threat and what is the best way to combat it? In order to prevent ransomware, organizations must first understand how it works.
 Disaster protection is vital to every business. Yet, it often consists of patched together procedures that are prone to error. From automatic backups to data encryption to media management, Robot automates the routine (yet often complex) tasks of iSeries backup and recovery, saving you time and money and making the process safer and more reliable. Automate your backups with the Robot Backup and Recovery Solution. Key features include:
 Business users want new applications now. Market and regulatory pressures require faster application updates and delivery into production. Your IBM i developers may be approaching retirement, and you see no sure way to fill their positions with experienced developers. In addition, you may be caught between maintaining your existing applications and the uncertainty of moving to something new.
 IT managers hoping to find new IBM i talent are discovering that the pool of experienced RPG programmers and operators or administrators with intimate knowledge of the operating system and the applications that run on it is small. This begs the question: How will you manage the platform that supports such a big part of your business? This guide offers strategies and software suggestions to help you plan IT staffing and resources and smooth the transition after your AS/400 talent retires. Read on to learn:
LATEST COMMENTS
MC Press Online