


Take advantage of the excellent reporting capabilities that Microsoft brings to the table.
Originally introduced as an add-on to SQL Server 2000, SQL Server Reporting Services (SSRS) is a stable product currently in its third version with SQL Server 2008. This article offers a high-level overview of SSRS and explains how to create reports against a DB2 for i data source. If your organization has significant reporting needs, SSRS could be a great fit.
Why Use SQL Server Reporting Services?
There are plenty of products on the market that can report from DB2 for i data, including Microsoft Access and Excel, Crystal Reports, Cognos, New Generation's NGS-IQ, and DB2 Web Query to name a few. All of these products have their pluses and minuses in terms of features, usability, quirks, and cost, and SSRS is no exception. Rather than do a complete comparison of these products, here are some potential compelling reasons to use SSRS.
· First, if your organization already owns SQL Server 2005 or 2008 standard edition or higher, then it also owns SSRS. (The free SQL Server Express editions can also run Reporting Services; however, there are some limitations).
· Second, SSRS is a popular reporting platform and therefore has plenty of available technical resources in terms of information on the Web and personnel. Owning a stable and popular product has implications for developer job security as well as long-term cost of ownership.
· Third, the product is browser-based and loaded with features, including drill-downs, the ability to generate reports in multiple formats (PDF, Excel, TIF, etc.), and a full-featured report history, scheduling, and distribution module.
· Fourth, developers are provided with many features, including connectivity to many data sources, a report designer within the familiar Visual Studio IDE, pre-built controls, the ability to leverage .NET components (such as existing business logic), and a Web service-based API that will allow other applications (including iSeries applications) to interact with the reporting engine.
· Fifth, Reporting Services is designed to work with other Microsoft products, such as Sharepoint.
· Sixth, since this is a product by behemoth Microsoft, be assured that Microsoft has the resources to endow future versions with additional features.
Configuring SSRS
Reporting Services, including configuration, is a huge topic, so I'll say at the outset I will not be able to do the topic justice. The SQL Server books online (see resources below) already cover how to install and configure SSRS. I'll give a brief overview here.
SSRS is usually initially configured during the install of SQL Server. However, if you skipped that step or need to change something, you can still use the Reporting Services Configuration Manager utility to do the configuration. Among other things, this utility is used to configure SMTP email for report distribution, the URL to the report server, and the database name that is used to store the information about the deployed reports.
SSRS can be configured in a variety of ways. Two possible options are shown below. Option A involves installing the SQL Server Database Engine itself and the SQL Server Reporting Services Engine on different computers. Separating the Report Server from the Database Engine is useful in a heavily used reporting environment where running the database engine and the report server may be too much for one server.

Figure 1: You can run the SQL Server Database Engine and Reporting Services on separate servers.
A second configuration, shown below, has the Database Engine and the Report Server installed on the same server.

Figure 2: Or you can run the SQL Server Database Engine and Reporting Services on the same server.
SSRS can query from the SQL Server database engine, but it can also query data engines that have an ODBC or OLE DB provider, such as Oracle, DB2, or MySQL.
With respect to writing reports against DB2 for i, there is an additional question that should be addressed: where should the reporting data be stored--on SQL Server or within DB2? Depending on the resources available, SSRS can query DB2 directly. Alternatively, it is a common practice to download and stage current DB2 data in SQL Server and then just let SSRS query SQL Server.
Tutorial #1: Building Sample Reports
I'll breeze through some quick examples of how to create a report using SQL Server 2008 Standard edition or higher and Business Intelligence Development Studio (BIDS). BIDS is actually a copy of Visual Studio that is installed with SQL Server, and although I will refer to BIDS through the remainder of the article, BIDS and Visual Studio are interchangeable. BIDS simply adds some "Business Intelligence" project templates that allow developers and administrators to work with special SQL Server features such as Reporting Services.
There are some prerequisites and assumptions for this tutorial:
· The reader knows the basics of using Visual Studio/BIDS and has familiarity with SQL.
· The report data will be queried directly from DB2.
· An instance of SQL Server 2008 and SSRS is installed and configured. My SQL Server is installed on my local machine as the default instance. (Readers with named instances will have to adjust the example.)
· A development machine (can be separate from SQL Server) with BIDS is installed.
· Some V6R1 SQL examples are used, so some users may need to make appropriate substitutions.
· The Reporting Services machine will also need IBM's System i Access installed (formerly known as iSeries Access and Client Access), including the ODBC driver component. If you prefer, the optional OLE DB providers (IBMDA400 and IBMDASQL) can be installed as well, although I have not tested them for this application.
· Readers who have Visual Studio/BIDS 2005 or one of the Express products can do their best to follow along, although there will be some differences.
· For the data in this tutorial, I've created a DB2 for i schema named ADVWORKS08 (requires V5R3 or higher) that contains a few tables exported from the SQL Server AdventureWorks2008 sample database. AdventureWorks is a free sample database available to SQL Server users and is covered under the Microsoft Public License. You can download the converted sample data for this project.
Creating a Report Project
You should have a copy of Business Intelligence Development Studio in your SQL Server program folder. BIDS (aka Visual Studio) is the tool for building Reporting Services reports. Microsoft is trying hard to allow developers to use one development environment to do all their coding, business intelligence, user interface design, etc. If it is not installed on your development machine, BIDS is found under the Shared Features section of the SQL Server installation process.
To create a SSRS project, open BIDS and choose File > New Project. In the New Project window, choose Business Intelligence Projects in the left pane. In the right pane, the Business Intelligence templates will appear. Choose the Report Server Project Wizard template and assign the project a name and folder location.
You now have a project container that will ultimately house all of your data source and report definitions. As a guideline, I create one SSRS project for each set of related reports. If I need a set of reports for inventory management, a set for sales, and a set for purchasing, I create a separate BIDS project for each. It doesn't have to be done this way as it mainly depends on how you want to deploy your reports, who you want to have access to them, and how you want them grouped for presentation to the user community.
The first thing to add to your SSRS project is a data source. A data source is simply the "connector" that will allow SSRS to query a database, XML file, OLAP server, or whatever. The most popular data source connections are SQL Server, Oracle, ODBC, and OLE DB connectivity, although more options are available. A data source can be local to a report, or it can be defined as a Shared Data Source, which can be re-used by multiple reports. Typically, I create one shared data source to a DB2 ERP system that can be used by several SSRS reports.
Once you've established one or more data sources, it's time to create a report against the sources. Either you can generate a report from scratch by dragging and dropping various toolbox controls onto the report canvas, or you can have a little help by letting the Report Wizard assist in the report generation. There are several controls available to use on a report, including the familiar textbox, label, and image controls. Additionally, SSRS has some specialized reporting controls, including the list, table, matrix, and subreport controls. Incidentally, when using a table, list, or matrix control in SSRS 2008, you're actually using a new underlying control (aka "data region") called a tablix.
Creating a Shared Data Source
Let's start by defining a data source to DB2 for i. To do this, we'll need to add a new "shared data source" to the project (a shared data source can be used by more than one report in a project). Choose Add New Item from the Project menu. The Add New Item window appears:

Figure 3: Create a new data source to DB2 for i. (Click images to enlarge.)
Select the Data Source icon as the template and click Add.
The Shared Data Source Properties window appears.

Figure 4: Choose the data source properties.
Assign a name to the source (I called mine DB2i), select ODBC as the type, and fill in the ODBC connection string to your System i. You can simply modify the string I have below:
Dsn=AS400;dbq=,QTEMP,ADVWORKS08,QGPL;nam=1;cmt=0
If you're using SQL Server Express, you will not have options to connect to an ODBC or OLE DB data source; you can only connect to a local SQL Server! This is where you'll need to be creative in reporting DB2 data. You'll need to either download data from DB2 into SQL Server first or use a programming technique such as linked servers or a CLR table function to get data directly from DB2.
Next, click the Credentials option in the left pane. Specify a user name and password. It's a good idea to create a "reporting user" that has read-only access to data. If security is an issue, you'll want to use a user profile that has no explicit access to the data and then create DB2 stored procedures to retrieve the data on behalf of the user profile using adopted authority.

Figure 5: Change the credentials.
Click OK. The data source is ready to use.
Now we'll create two sample reports based on this connection: a tabular report and a matrix report.
Tutorial #2: Creating a Tabular Report with Drill-Down Enabled
This example illustrates how to create a common tabular (i.e., table-based rows and columns) report design--including report breaks--and how to enable drill-down functionality that allows a user to show and hide detail data.
This objective of the report is to retrieve clothing product sales data from the DB2 data source and summarize it by product within product subcategory. Additionally, we'd like to be able to drill into a product to see the order detail underlying the total.
To add a report within BIDS, click Add New Item from the project menu.

Figure 6: Add a new item.
Choose Report Wizard from the available templates and assign your report a name. Notice the extension is .rdl, which stands for report definition layout (RDL) which is actually an XML file. This sample report's name is "AS400 Product Sales by Subcategory.rdl."
When prompted for a data source, choose DB2i (defined in the prior step) from the list. Click Next.
On the Design the Query screen, paste in the following query text that retrieves information from the sales and product tables:
SELECT soh.OrderDate AS Date, 'SO'||VarChar(soh.SalesOrderId) AS ORDER,
pps.Name AS Subcat, pp.Name AS Product,
SUM(sd.OrderQty) AS Qty,
SUM(COALESCE((UnitPrice*((1.0)-UnitPriceDiscount))
* OrderQty, 0.0)) AS LineTotal
FROM SalesPerson sp
INNER JOIN
SalesOrderHeader AS soh ON sp.BusinessEntityID = soh.SalesPersonID
INNER JOIN
SalesOrderDetail AS sd ON sd.SalesOrderID = soh.SalesOrderID
INNER JOIN
Product AS pp ON sd.ProductID = pp.ProductID
INNER JOIN
ProductSubcategory AS pps ON pp.ProductSubcategoryID = pps.ProductSubcategoryID
INNER JOIN
ProductCategory AS ppc ON ppc.ProductCategoryID = pps.ProductCategoryID
GROUP BY ppc.Name, soh.OrderDate, soh.SalesOrderId, pps.Name, pp.Name, soh.SalesPersonID
HAVING ppc.Name = 'Clothing' /* HAVING clause is optional */
Your "design the query" window should look something like this:

Figure 7: You've begun to design your query.
Click Next.
On the Select the Report Type wizard step, choose Tabular report. Click Next.
On the Design the Table wizard step, all of the columns from your query appear. Distribute the "Available fields" (i.e., query columns) into the "Display fields" column on the right as follows:

Figure 8: Now, you're designing your table.
The "displayed fields" sections are as follows:
· Page--The page-level fields in a table will be displayed at the top of the table. By default, a page break will be generated whenever the values in the columns specified in this section change. Place the SUBCAT (subcategory) field here because you want to start a new page whenever the subcategory changes. To do this, click the SUBCAT field on the right and then click the Page button to move it to the Page section.
· Group--The group section controls how the detail fields are grouped in the table. For RPG and COBOL folks, a group is synonymous with a control break. Place the PRODUCT column in this section to introduce a product-level break on the report.
· Details--As the name implies, Detail fields are displayed for every row in the data source. The order of these fields is important as the wizard will place the fields on the report from left to right in the order specified. You can always change them after the fact in the report designer, but it's easier to let the wizard do it correctly the first time. Place the DATE, ORDER, QTY, LINETOTAL fields in this section.
Click Next.
On the Choose the Table Layout step, choose the Stepped Layout option and check the Include Subtotals box and the Enable Drilldown box. The stepped vs. blocked layout option is an aesthetic choice, while Include Subtotals will make the wizard do the chore of adding a subtotal line to the table. The Enable Drilldown option will allow the dynamic expansion and contraction of detail rows within a group.
Click Next.
On the Choose the Table Style step, choose a color scheme that appeals to you (or better, is close to your business logo colors, if possible). In this example, I chose Forest, which is mostly varied shades of green.
Click Next.
On this Completion step, the wizard will give you a summary of everything selected during the wizard's collection process. At this point, the wizard is done and you only need to click Finish. Optionally, you can click the checkbox to preview the report.
Formatting the Report
If you chose to preview your report, you can see that the wizard's initial generation is nice, but there are still quite a few rough edges to smooth out. Here's what the initial report looks like in preview mode:

Figure 9: Your initial report looks like this.
Notice that in the BIDS report designer, there are two tabs at the top: Design and Preview. The Design tab allows changes to be made to the report definition, and the Preview tab shows you what the report will look like. Please note that the Design tab must be selected in order to follow the following instructions. When in design mode, you'll see the table control, which should have four rows: Heading, Grouping, Detail and Total.
Initially, the report has the following characteristics:
- The page-level subcategory is shown just below the report title at the top of each page.
- Because drill-down is enabled, the report initially shows only the summary lines by Product (which we chose for the grouping of our table). However, clicking the plus symbol (+) next to each product will expand the report to show the underlying order detail rows.
- The summary rows by product contain summations for quantity and order line value and are displayed at the top (i.e., first line) of the group, not at the bottom.
- Once the report is set up, innumerable things can be done in terms of formatting, linking to other reports, etc. I'll step through the basics of formatting some report columns and creating a few simple expressions. When writing SSRS expressions (addition, concatentation, .NET functions, etc.), the VB.NET syntax is used.
Some things need to be changed to spiffy up the report:
- Change the report margins because the defaults are a one-inch border all around the page. Choose Report Properties from the Report menu. In the Report Properties box, change all margin values (left, right, top, and bottom) to .4" (four tenths of an inch).
- The body of the report needs to be wider so that the report columns can be bigger (without wrapping text).
- Choose the Properties window from the View menu. At the top of the Properties window is a drop-down box that has a list of all the report controls and sections. Choose the Body option from the list. Locate the size property and expand it by clicking the plus symbol (+). For the width, enter 6.84375in, and for the height, enter 1.7in. These values are somewhat arbitrary; their exact value usually depends on what you need on your report. Make the product column bigger so we don't have to see the wrapping. Select any box in the first (product) column (to do this, click twice on any text box in the first column of the tablix/table control.) Press F4 to open the properties window, locate the size property, and change the first value, which is the width, from 1in (the default) to 2.85in. Alternatively, you can drag the right side of the column to make it bigger within the designer. The exact width usually isn't an issue; just make it big enough for the content to fit.
- Change the column headings to mixed case to improve readability. Clicking three times on each of the column heading boxes will allow you to modify the text.
- Create aggregate expressions that will allow the first date within the group and number of orders to show up in the group summary line (which are currently blank). By default, the Report Wizard will not do any automatic aggregations on columns such as Date (Date data type) and Order (VarChar data type). But you can still show information in these boxes. For example, to show the first order date in the current Product group, you need to add an expression to the date text box on the group row. The group row for Product is distinguishable from the detail row because it contains a reference to the Product field. The detail row's product column is blank.
- Click twice on the date text box in the product summary row to select it. Then, right-click the date box and choose Expression from the context menu. Enter the following expression:
=First(Fields!DATE.Value)
The First function will take the first date value it encounters in the current group's data. The Fields collection is a built-in collection that provides access to all columns in a report's data source(s). Please note that the field names are case-sensitive.
For another example, let's place the number of orders within the product group in the Order text box on the product summary line.
Click twice on the order text box in the product summary row. Then, right-click the Order field box and choose Expression from the context menu. Enter the following expression:
=Count(Fields!ORDER.Value)
When complete, the date and order columns will no longer be empty on the summary rows.
- Add a Subcategory total line to tally the entire results for each subcategory of clothing. To show the subtotals for the entire subcategory, locate the Row Groups window at the bottom of the designer window. Click the arrow next to the product row group and then choose Add Total > After to create a total line after each product group. Shown below is a picture of this step.
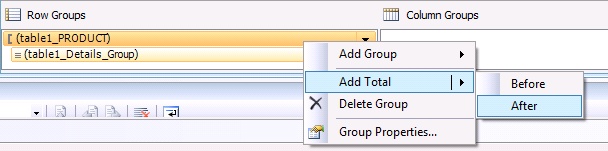
Figure 10: Add a Subcategory total line.
A new row will appear at the bottom of the table control. Select the first column's text box of the new row and choose Expression. Enter the following expression:
="Total for " + Fields!SUBCAT.Value
Likewise, enter these expressions for the following cells on the total line:
|
Order |
=Count(Fields!ORDER.Value) |
|
Qty |
=Sum(Fields!QTY.Value) |
|
Line Total |
=Sum(Fields!LINETOTAL.Value) |
Finally, make the total line's font bold by clicking the total line's row handle (to highlight the entire row) followed by the Control+B key sequence.
- Format the date and line-total columns. Select two date column cells on the product summary line (in green) and the detail line (white). Hint: hold the Shift key down to select consecutive cells.
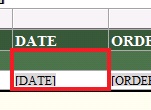
Figure 11: Format the date and line-total columns.
Press F4 to open the Properties window. Find the Format property and enter the following value: dd-MMM-yy. This is known as a format expression and will cause a date such as April 1, 2009 to be formatted as 01-Apr-09.
Select all three of the line total cells (summary, detail, total) and then Press F4 to bring up the Properties window. Locate the Format property and enter the following format expression to make them display currency: '$'0.00;('$'0.00).
When all the changes are made, preview the report again to behold an attractive report. After the next report creation tutorial, I'll discuss how to deploy the report so users can access it. AS400 Product Sales by Subcategory.zip
Tutorial #2: Creating a Parameterized Matrix Report
The purpose of this report example is to show the power of the matrix report wizard and to demonstrate how to pass a parameter to a report. A matrix report is used to pivot data on a given axis.
For example, if you have a list of parts that failed inspection stored like this in the database…
|
Product |
Quarter |
Number of Rejected Parts |
|
Bike Chain |
1 |
12 |
|
Bike Chain |
2 |
8 |
…and you want it to pivot data about the quarter column so that it is displayed in a report like this…
|
Product |
Quarter 1 Rejects |
Quarter 2 Rejects |
|
Bike Chain |
12 |
8 |
…you would use a matrix report.
This sample report is intended to list all products in a given parameterized category, show all vendors that sell the product, and show how many products were sent back to the vendor. To see if the vendor is improving or not, the number of rejected products is pivoted by quarter. In other words, each quarter in the data set will be displayed in its own column on the report. Because of this, keep in mind that if pivot values are not controlled in the query or limited by the data itself, a matrix report can potentially contain an unruly number of columns. To illustrate, if you're displaying data for the past 10 years and want to pivot data by year and month, you'll get 120 columns.
If you're a visual person and need to see what the report is supposed to look like, Figure 16 later in this article shows a picture of the final report.
Now, using BIDS, let's create the report, step by step, using the report wizard.
Choose Add New Item from the Project menu.
In the templates window, choose the Report Data Wizard option and assign the name "AS400 Product Rejects by Vendor.rdl."
Click the wizard's intro page and choose DB2i as the shared data source.
Click Next.
In the Design the Query wizard step, paste the following query:
Select POD.PurchaseOrderID,Ven.Name As VendorName,
PRD.ProductId,PRD.Name ProductName,
CAT.Name As CategoryName,SUBCAT.Name As SubcatName,
Coalesce(Color,'N/A') As Color,Size,Class,Style,
Varchar_Format(OrderDate,'YYYY-Q') As Order_Quarter /* V6R1 Required */,
OrderQty,RejectedQty,ReceivedQty
From PurchaseOrderDetail POD
Join PurchaseOrderHeader POH On POH.PurchaseOrderID=POD.PurchaseOrderID
Join Vendor VEN On VEN.BusinessEntityID=POH.VendorID
Join Product PRD On PRD.ProductID=POD.ProductID
Join ProductSubcategory SUBCAT On SUBCAT.ProductSubcategoryID=PRD.ProductSubcategoryID
Join ProductCategory CAT On CAT.ProductCategoryID=SUBCAT.ProductCategoryID
Where RejectedQty<>0
The above query uses the Varchar_Format function to extract the year and quarter. If you're not on V6R1, you'll need to create an expression to do this extraction.
Click Next.
In the Select the Report Type step, select the Matrix option.
Click Next.
On the Design the Matrix step, choose the following display fields:
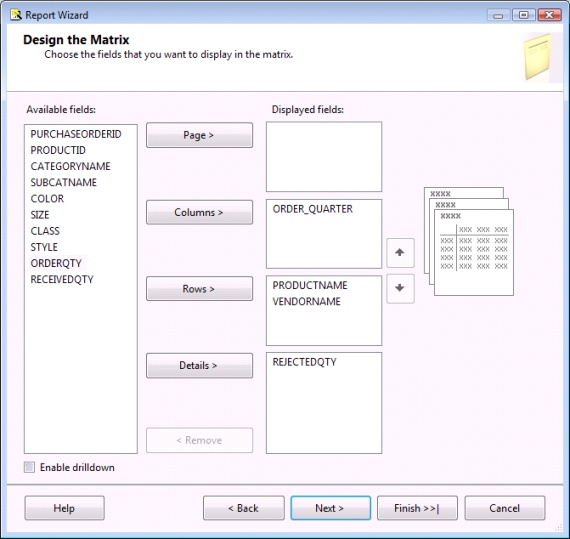
Figure 12: Design your matrix.
- Page--The page section works the same as the table report type. However, page-level summarizations aren't required for this report, so it'll be left blank.
- Columns--This contains the field(s) from the query that will serve as the basis for pivoting data. Choose the ORDER_QUARTER column, which will cause the report to dynamically generate a display column for each quarter encountered in the query result set.
- Rows--This section contains the field(s) that the report will group on. We want to show all products, followed by each vendor that sold the product, followed by the number of rejects in each quarter. When SSRS creates the matrix, it will create a row for every distinct combination of products and vendors. Add the ProductName and VendorName fields to this section.
- Details--This section holds the data that is to be aggregated on the report. In our case, we want to aggregate the number of rejects recorded, so add the REJECTEDQTY field to the detail section.
Click Next.
On the Choose the Table Style step, choose a color scheme. In this example, I chose "Slate."
Click Finish.
The wizard has just given us a functional report that is doing quite a bit behind the scenes to serve our purpose. However, reports are rarely generated against an entire data set. Instead, a date range or some other criteria is applied against the data source to limit the volume of data.
Adding a Report Parameter
A new requirement of this report will be to add a parameter that will allow the user to view the rejected products for all categories or for one specific category. When the report is requested, the default will be to display "All Categories," but the user will have the option to override it with a single category. When running the report, we desire SSRS to present a prompt that looks like this:
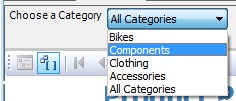
Figure 13: Choose to display all categories or a single category.
To begin, bring up the Report Data window by choosing Report Data from BIDS's view menu. This helpful window will show built-in fields, defined parameters, images, and data sources in your SSRS project. The window should look similar to the one shown here:
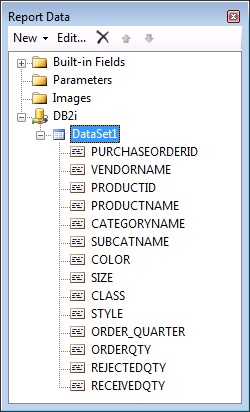
Figure 14: Report Data shows your SSRS project's built-in fields, defined parameters, images, and data sources.
The good news is that, when prompting for a parameter, Reporting Services can allow a user to select from a list of values. The bad news is, in this sample database, the CategoryIDs are actually incremental numbers. We don't want the user to have to select a number, so we will need to show the user the list of category names in the ProductCategory table and pass the corresponding CategoryId number behind the scenes to the database query. So before defining our parameter, let's define a query to get all the category names from the database for SSRS to show the user. To do this, right-click on the DB2i data source in the Report Data window and choose Add Dataset.
When the dataset window appears, assign a name of "Category," choose DB2i as your data source, and enter the following SQL in the query property:
Select ProductCategoryId,Name From ProductCategory
Union All
Select *
From (Values(Cast(Null As Int),'All Categories'))
As Dummy (ProductCategoryId,Name) /* V6R1 Required */
The second SQL statement generates a "dummy" one-row result set that has a CategoryId of NULL and a name of 'All Categories'. This row with special NULL value CategoryId is required so we can give the user the option to pick all the categories (more on this in a minute). Again, we're defining this query to pull a list of all the categories to present to the users when they're prompted to pick a Category value.
The query again was written for V6R1, using the new FROM VALUES clause. Prior to 6.1, the second portion of the query after the UNION ALL should look like this:
Select Cast(Null As Int) ProductCategoryId,'All Categories' Name
From SYSIBM/SYSDUMMY1
Now that we have the category names available, let's define the parameter for the report. Go back to the Report Data window, right-click on the Parameters node, and choose Add Parameter. On the Report Parameter Properties dialog, enter Category as the name and Choose a Category as the prompt. The parameter name can be referenced in queries and report expressions, and the prompt text is what the user will see when the report is run. Finally, choose "integer" as the data type and check the "allow null value" option. In this case, when the user selects a null value, we want to show all the data. NULL provides a way to allow this special case.
Next, to populate the parameter with a list of available choices, choose the Available Values option in the list of options on the left side of the window. Select the option Get Values from a Query, choose Category as the dataset (this is the query we just defined in the prior step), choose ProductCategoryId as the value field, and choose Name as the label field. The value will be an integer, and the label is what the user actually sees in the drop-down list.
The next step is to change the base report query to accept the ProductCategoryId report parameter (i.e., picked by the user) so the database query retrieves only the desired category. In the Report Data window, right-click on DataSet1 (the default dataset generated by the wizard) and choose DataSet Properties. Change the query property's SQL WHERE clause to look like the following:
Where RejectedQty<>0
And (Cast(? As Int)=Subcat.ProductCategoryId
Or Cast(? As Int) Is Null)
The question mark (?) is a parameter marker, and each marker represents a value that will be given to the query statement at run time. In our sample, both parameter markers represent the same information: the ProductCategoryId the user selects when running the report. (Unfortunately, DB2 for i ODBC calls do not allow named parameters like SQL Server does.) Two parameters are required because there are two tests being done: a NULL test and a table column comparison.
Next, Reporting Services will need to know what value to give these parameter markers when it submits the query to DB2. To do this, assuming you're still in the Dataset Properties window, click on the parameters option (in the left pane). If the query has no syntax errors, there should be two parameter entries in the parameter list, both with question marks in the name fields. For each parameter, select the report-level parameter [@Category] from the drop-down list. The figure below shows what the screen should look like. Click OK when done.
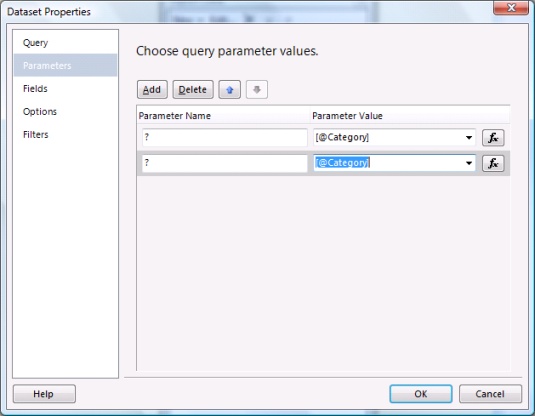
Figure 15: Choose your query parameter values.
Remember, this linkage simply takes the Report parameter called @Category (Reporting Services adds the initial @) and passes the value the user selects to the parameter markers in the query. It is conceivable that you may have multiple parameter markers against multiple columns in a query, so just remember when filling in the parameter linkage that the parameter markers will be populated in the order they appear in the SQL from top to bottom, left to right.
Click OK to close the Dataset Properties windows. The query will now be parameterized based on the report parameter value the user chooses.
Turning our attention to report formatting, other than resizing the columns (so more can fit across the page) and changing the margins to .4", there wasn't much else to do. A preview of the report looks like this:
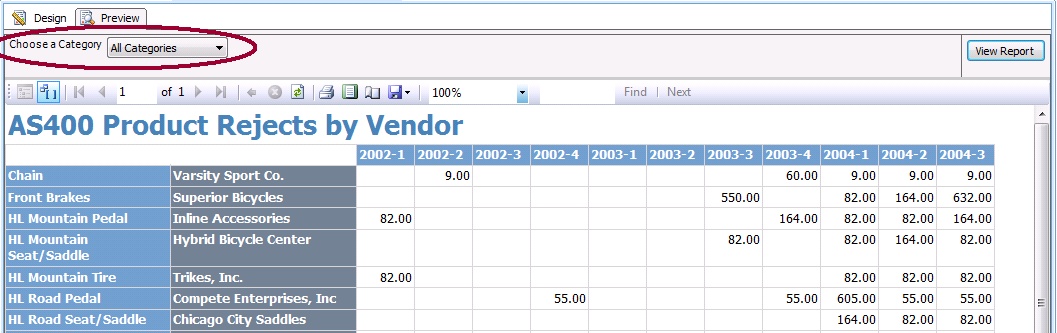
Figure 16: Now your report looks like this! Much better!
Notice that the parameter presentation at the top of the report includes our label Choose a Category and our default selection of All Categories. Also, our rows are composed of product/vendor combinations, and our columns are composed of the quarters in the dataset. The RejectedQty is summarized in the detail section by product, vendor, and quarter.
I should mention one more design convention. It's a good practice to add a report footer that displays things like page numbers, report name, etc. There is an internal collection of report fields within SSRS that contains this information. In the report designer, choose Add Page Footer from the Report menu. Then simply add text boxes at the desired footer location and assign an expression to them. Shown below is the Expression window. Notice that in the lower portion of the window, there are Category and Item lists that assist with expression building.
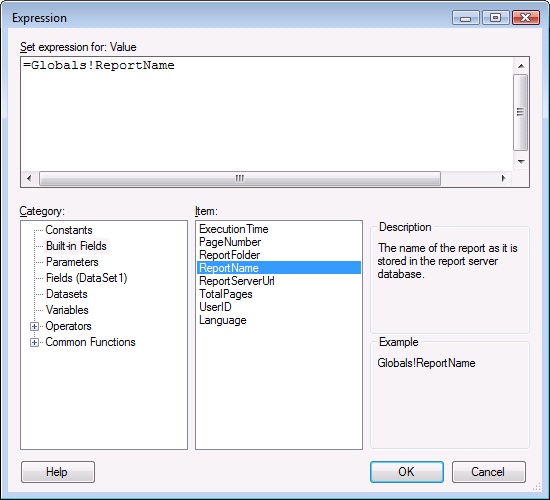
Figure 17: Build your expressions here.
For example, when you select Built-in Fields in the Category box, you'll see a number of useful fields that can be referenced on a header or footer, such as PageNumber, UserId, etc. Also, the Fields category will display the list of fields in your report's data source(s). Take time to study the available options.
Here is a hodge-podge of notes about the reports we've done and SSRS in general:
- Depending on the number of dynamic columns generated, matrix reports are not always conducive to printing. However, they may be good candidates for exporting to Excel.
- Don't count on matrix reports to render correctly within browsers other than Internet Explorer.
- When changing a complex report, sometimes it's easier to edit the RDL file (XML format) directly. To do this, right-click on your report definition in the Solution Explorer and then choose the View Code option.
- For some reason, you cannot put fields from a data source on a report header or footer section (without resorting to a hack of some sort).
- There is an import facility that converts MS
Access reports to SSRS.
Deploying the Report
At the end of the day, when your reports are ready for prime time, BIDS provides an easy way to deploy the reports. But first, you'll need to configure the project's properties so that it knows where to send the report definitions and data sources. Choose Properties from the BIDS Project menu. A window will appear with four deployment options:
- Overwrite target data sources--This Boolean option defaults to false. It will prevent BIDS data sources from overwriting existing data sources on the report server. This is done so that a test data source used by a developer doesn't get deployed to a live report server. If you'll be using test data sources in BIDS, you'll want to leave this false on most occasions.
- TargetDataSource folder--This is the name of the folder where data source definitions are pushed. The default is Data Sources.
- TargetReportFolder--This is the name of the SSRS folder to house the project's reports. If the SSRS folder doesn't exist, it will be created. Since these are AdventureWorks reports, it would be appropriate to call the folder AdventureWorks. You may desire to create an SSRS folder for each department that requires reporting.
- TargetServerURL--This identifies the URL of the SSRS instance to host the reports. The default is http://servername:port/ReportServer/. I have SSRS installed locally on my PC so the deployment address is http://localhost/reportserver. The virtual directory and report can be overridden in the Reporting Services Configuration Manager, which is found in the SQL Server Configuration subfolder. If you didn't set up Reporting Services, your SSRS administrator can supply this deployment URL.
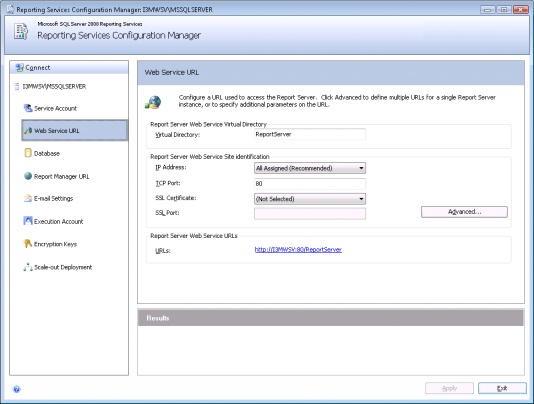
Figure 18: Configure Reporting Services.
If you have only one SSRS instance, you'll probably need to configure these only once in your project. If you have multiple SSRS instances (say, one for test and one for production), then you may need to tinker with these options.
Now that BIDS knows the requisite SSRS info, simply choose "Deploy project name" from the BIDS Build menu. If there are no errors, BIDS will show a "succeeded" message in the Output window.
Once deployed, your users will need to know the URL of the report server to access the reports. In general, you'll give the users the
following URL: http://servername:port/Reports/.
Again, assuming the default on my local machine, the URL is http://localhost/Reports/. The initial view will show the users a list of Reporting Services folders (such as AdventureWorks). Clicking on the folder name will reveal reports published to that folder, as shown below.
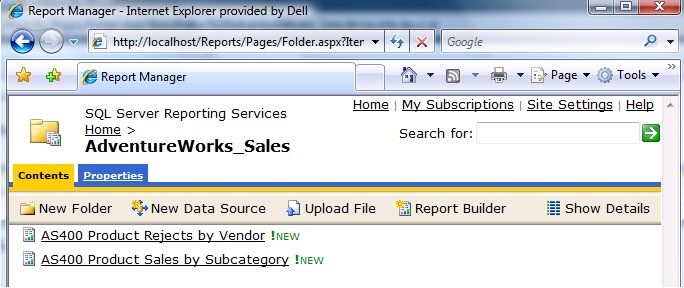
Figure 19: Users see a list of Reporting Services folders.
Here are a few noteworthy items about this Web interface:
- The My Subscriptions option will allow a user to schedule (i.e., subscribe to) report distribution. For example, the user can have the "Sales By Subcategory" report emailed in PDF format once a month.
- The Report Builder option is a Smart Client application that allows users to build their own reports. For the most part, only Internet Explorer and Firefox are supported (and Firefox may need the .NET Smart Client Add-On).
- Site Settings allows security and schedule assignments to be made. It also controls the SSRS archiving feature, which keeps snapshots of various reports for historical purposes.
Reporting the Conclusion
SSRS is a full-featured reporting package that can report from just about any data source, including DB2 for i. In addition to a powerful reporting engine, SSRS contains a great report scheduler and report archiving mechanism. Empower decision-makers with real-time access to the data they need in the format they want using SSRS.
Resources
Here is a compilation of some important information on Reporting Services to round out your understanding of the product.
Installation of Reporting Services for SQL Server 2008
http://technet.microsoft.com/en-us/library/bb522676.aspx
Reporting Services Overview


 More than ever, there is a demand for IT to deliver innovation. Your IBM i has been an essential part of your business operations for years. However, your organization may struggle to maintain the current system and implement new projects. The thousands of customers we've worked with and surveyed state that expectations regarding the digital footprint and vision of the company are not aligned with the current IT environment.
 TRY the one package that solves all your document design and printing challenges on all your platforms. Produce bar code labels, electronic forms, ad hoc reports, and RFID tags – without programming! MarkMagic is the only document design and print solution that combines report writing, WYSIWYG label and forms design, and conditional printing in one integrated product. Make sure your data survives when catastrophe hits. Request your trial now! Request Now.
 Forms of ransomware has been around for over 30 years, and with more and more organizations suffering attacks each year, it continues to endure. What has made ransomware such a durable threat and what is the best way to combat it? In order to prevent ransomware, organizations must first understand how it works.
 Disaster protection is vital to every business. Yet, it often consists of patched together procedures that are prone to error. From automatic backups to data encryption to media management, Robot automates the routine (yet often complex) tasks of iSeries backup and recovery, saving you time and money and making the process safer and more reliable. Automate your backups with the Robot Backup and Recovery Solution. Key features include:
 Business users want new applications now. Market and regulatory pressures require faster application updates and delivery into production. Your IBM i developers may be approaching retirement, and you see no sure way to fill their positions with experienced developers. In addition, you may be caught between maintaining your existing applications and the uncertainty of moving to something new.
 IT managers hoping to find new IBM i talent are discovering that the pool of experienced RPG programmers and operators or administrators with intimate knowledge of the operating system and the applications that run on it is small. This begs the question: How will you manage the platform that supports such a big part of your business? This guide offers strategies and software suggestions to help you plan IT staffing and resources and smooth the transition after your AS/400 talent retires. Read on to learn:
LATEST COMMENTS
MC Press Online