


Data discovery is a lot easier if you're using the right tools the right way.
Editor's note: This article is an excerpt from the new book Data Governance Tools by Sunil Soares (MC Press 2014).
Data profiling is the process of understanding the data in a system, where it is located, and how it relates to other systems. This process includes developing a statistical analysis of the data such as data type, null percentages, and uniqueness. While there might be some nuances, we will use the terms "data profiling" and "data discovery" synonymously.
In the absence of tools, data analysts have historically resorted to the use of SQL queries to discover and profile data. Data profiling tools can automate a number of tasks associated with data governance.
Conduct Column Analysis
The first step in any data profiling exercise is to conduct an analysis of the columns. In Figure 5.1, IBM InfoSphere Discovery displays a column analysis for the HQ_EMP table. The column analysis displays basic metadata about each column, as discussed below (not all metadata is shown in the screenshot):
- #—The sequence number of the column.
- Column Name—The name of the column as shown in the database table.
- Data Type—The data type, such as NumberString, Varchar, and DateTime. For example, the data type for the EMPLOYEE_ID column in Figure 5.1 is NumberString.
- Length—The defined length of the column. For example, the length of EMPLOYEE_ID is seven characters.
- Precision—The maximum number of digits that can be present in a number. For example, EMPLOYEE_ID can have a maximum of 31 digits.
- Scale—The maximum number of decimals after the decimal point. For example, EMPLOYEE_ID has zero digits after the decimal point.
- Cardinality—The number of unique values in a column. For example, FNAME and LNAME have 228 and 219 unique values, respectively.
- Selectivity—The degree of uniqueness of the values (including nulls) in the column, calculated as Cardinality / (Row Count – Null Count). Selectivity is calculated on each column individually and is not the result of comparison to another column. This value is never greater than one.
- Min—The smallest or lowest value in the column, calculated numerically for numeric columns and alphabetically for other columns.
- Max—The largest or greatest value in the column, calculated numerically for numeric columns and alphabetically for other columns.
- Mode—The most common value in the column, not including null values. This value is calculated only if a particular value is displayed in more than five percent of the rows. In Figure 5.1, the mode for STATE is TX.
- Mode%—The number of times the mode (the most common value) is displayed in this column, as a percentage of all values in the column. For example, TX appears eight percent of the time in STATE.
- Sparse—Indicates whether the column is sparse, based on the Mode%. A sparse column contains mostly the same value except for a few exceptions.
- Null Count—The number of rows where the column value is null.
- Blank Count—The number of rows in the column that are blank (empty).
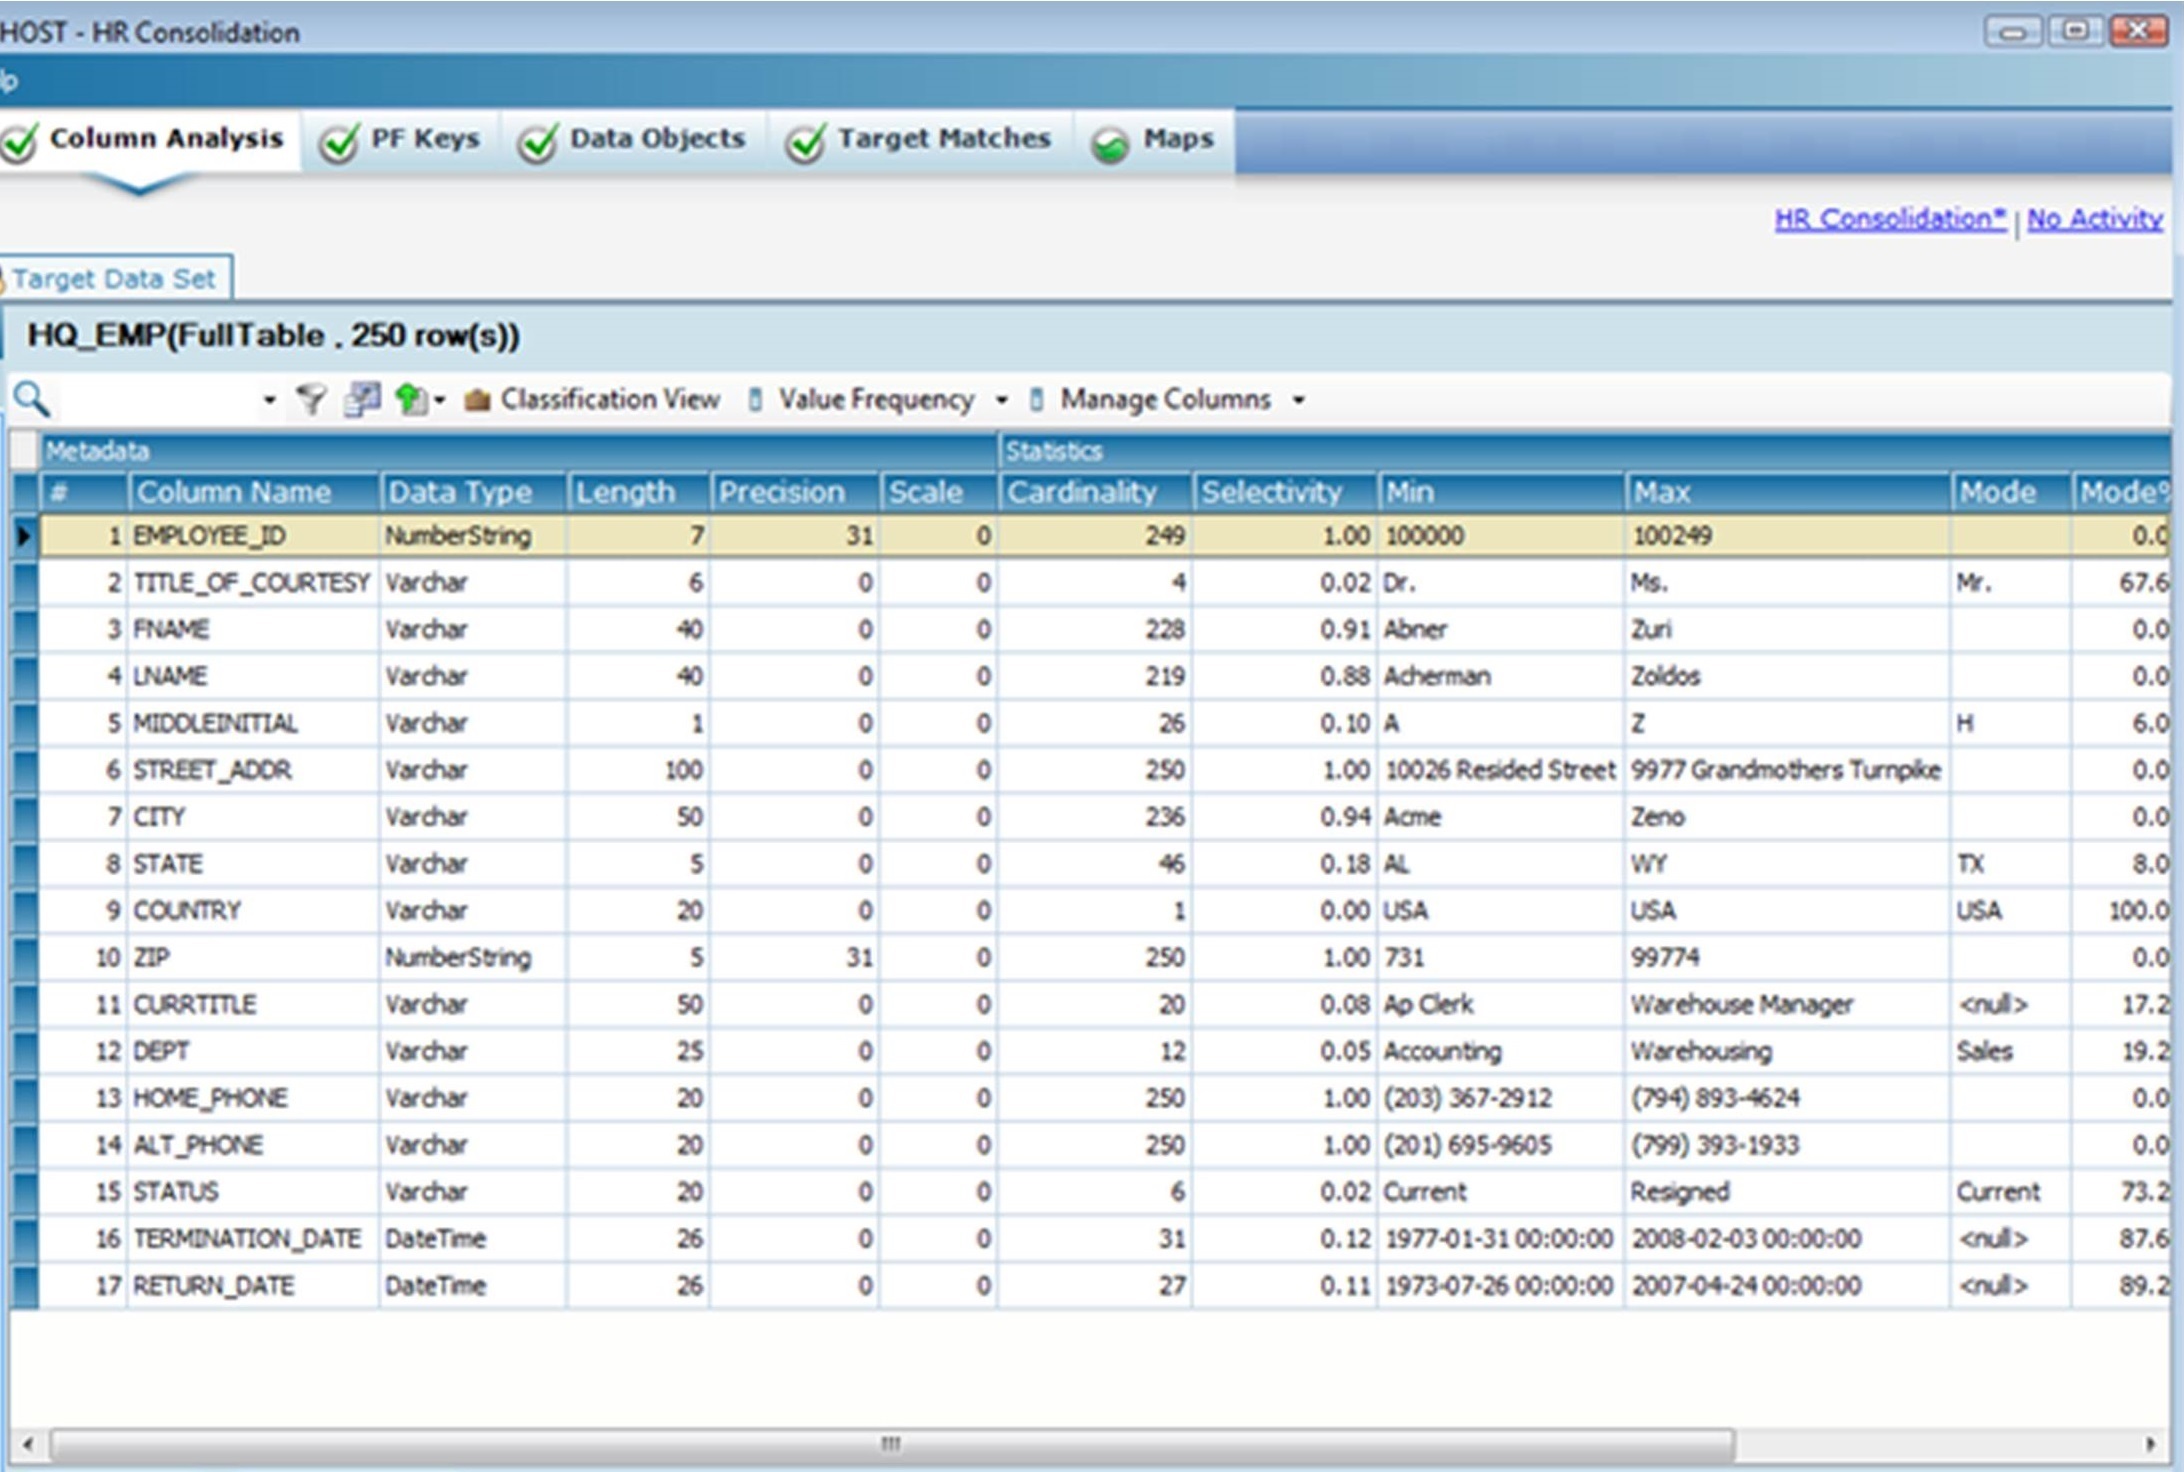
Figure 5.1: IBM InfoSphere Discovery displays the column analysis for the HQ_EMP table.
(From the IBM Redbook Metadata Management with IBM InfoSphere Information Server, October 2011, Jackie Zhu et al.)
Discover the Values Distribution of a Column
Data discovery tools should also display the most frequent values of a specific column. As shown in Figure 5.2, Trillium TS Discovery displays the Values Distribution, which shows the top five values for the Name column. The names "Michelle," "Dorothy," "Joey," "Royson," and "Sunil" appear 28.571%, 14.286%, 14.286%, 14.286%, and 14.286% of the time, respectively.
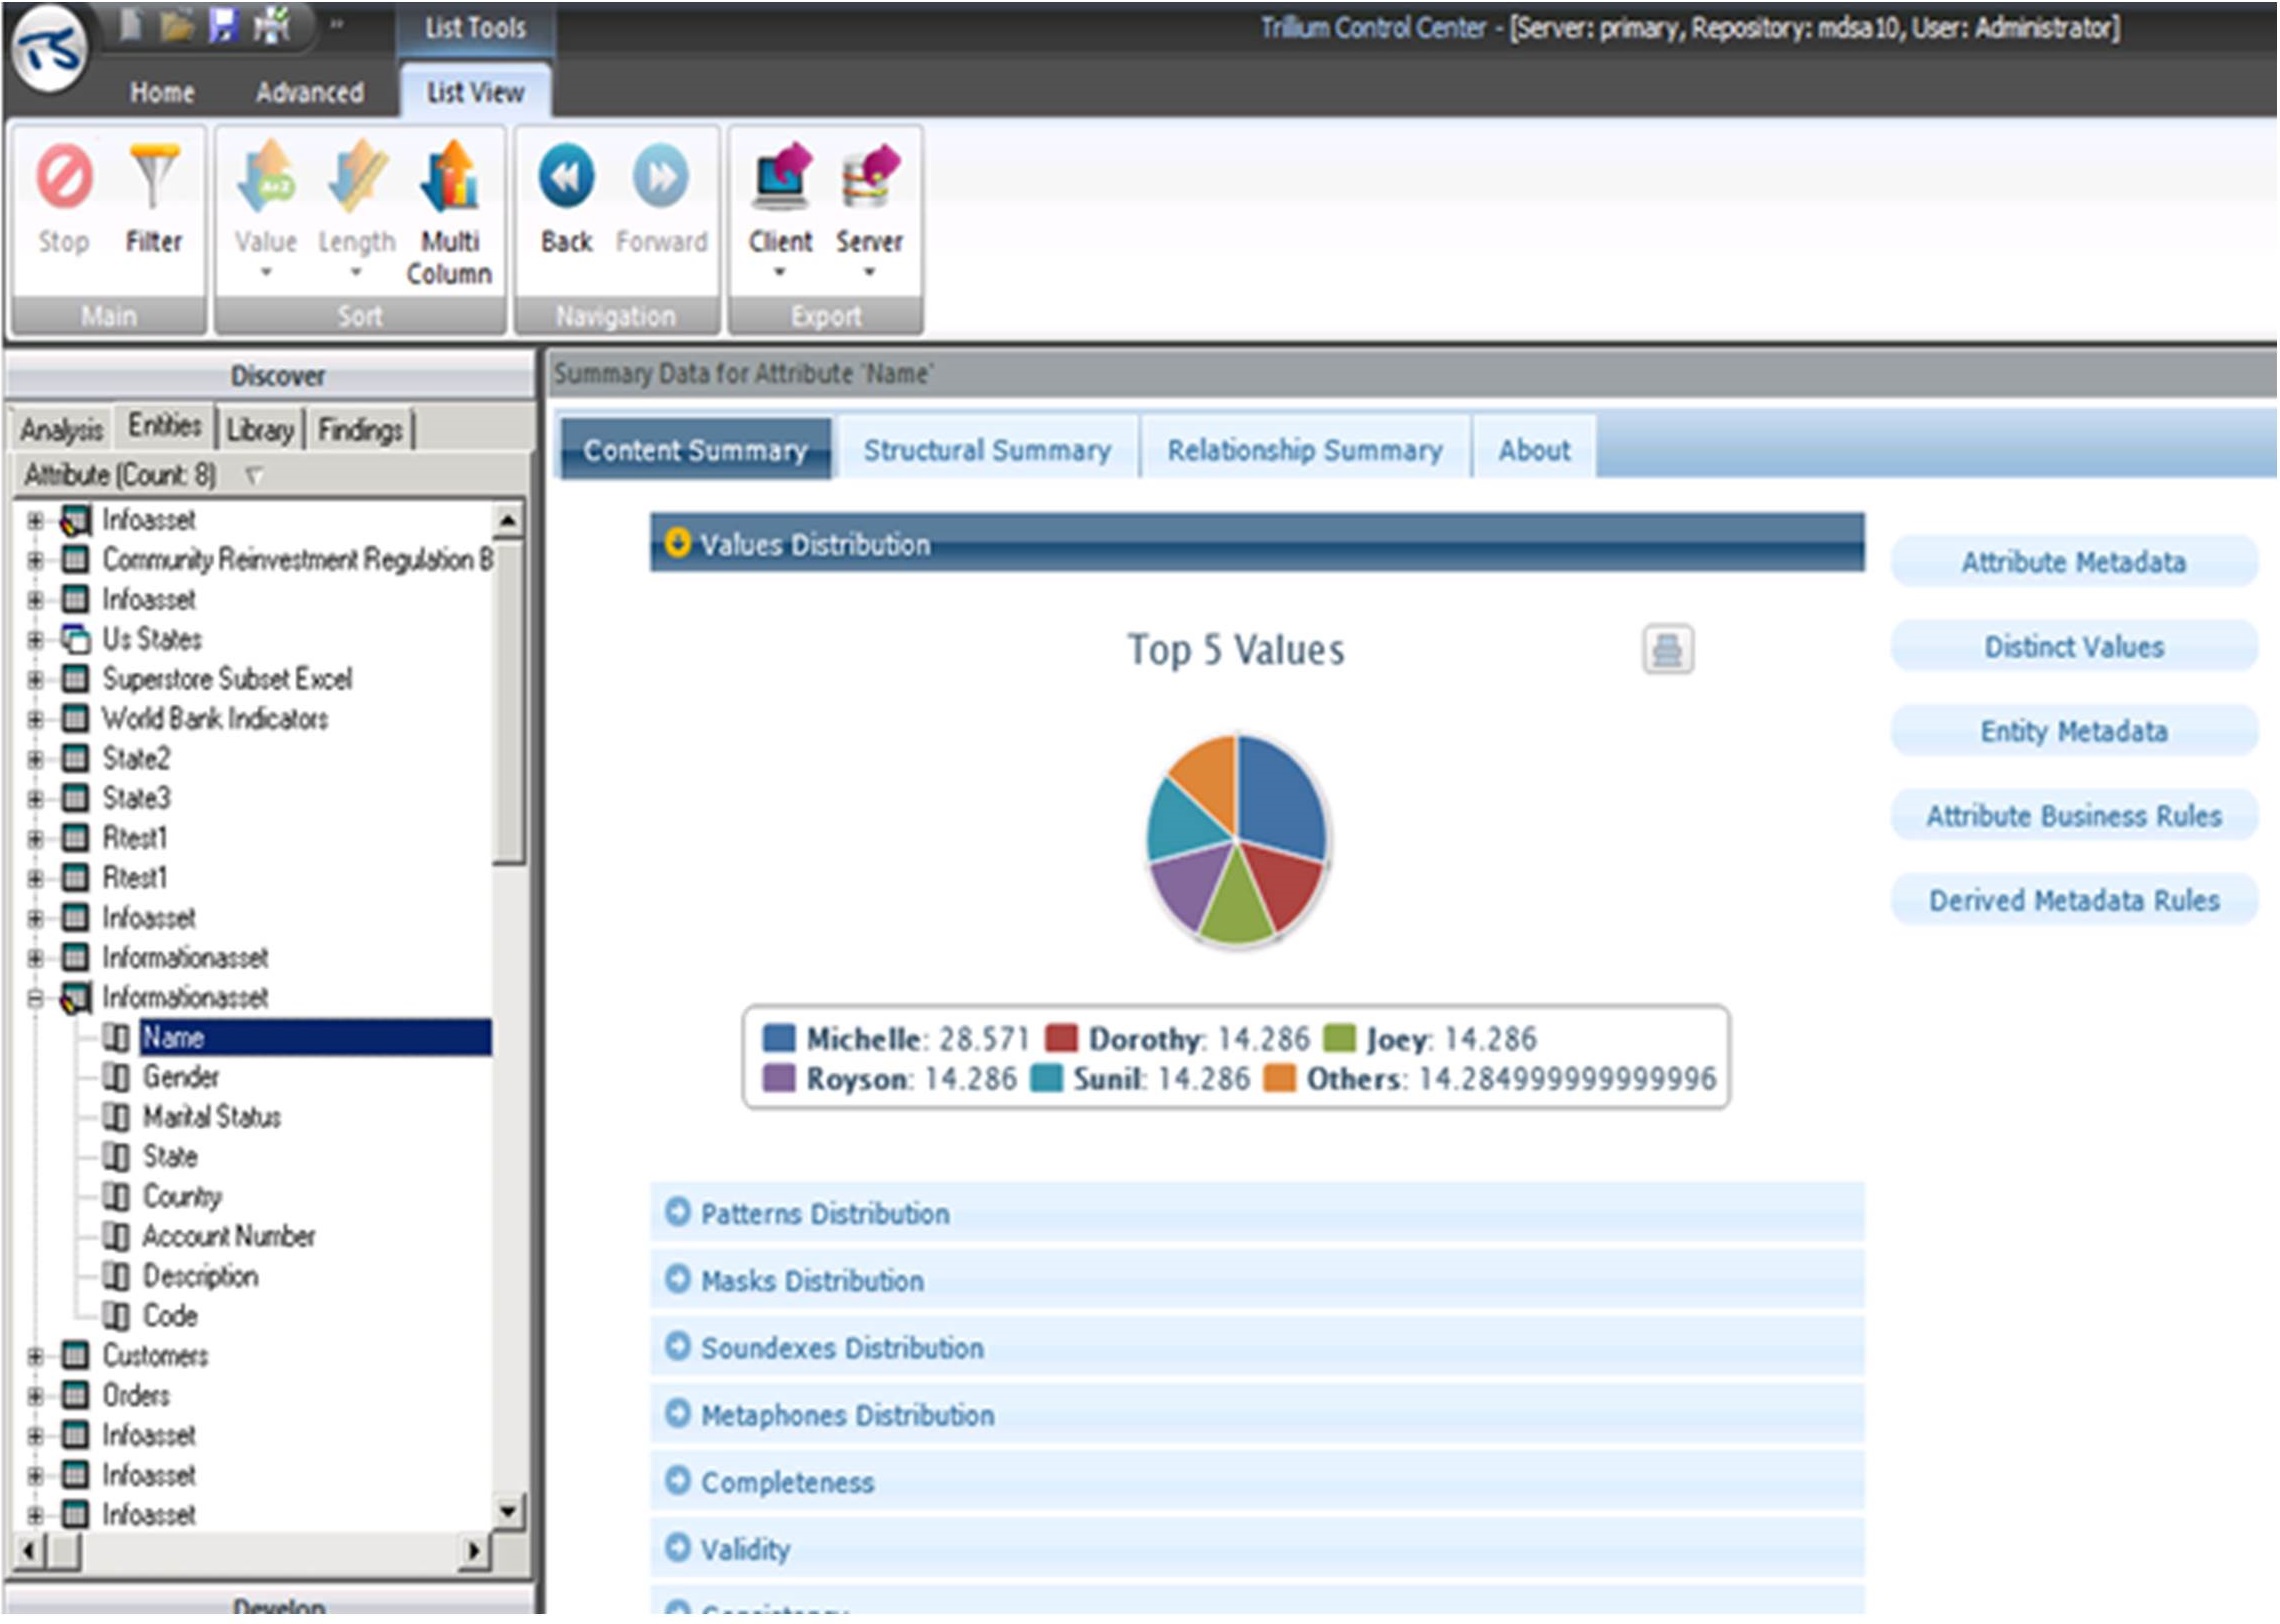
Figure 5.2: The Values Distribution for the Name column in Trillium TS Discovery.
Discover the Patterns Distribution of a Column
Data discovery tools should also display the patterns distribution of a specific column. As shown in Figure 5.3, Trillium TS Discovery displays the Patterns Distribution, which shows the top five patterns for the Name column. The most common patterns are alphanumeric six characters and alphanumeric eight characters, each with 28.571% of the records. These are followed by alphanumeric four, alphanumeric five, and alphanumeric seven, each with 14.286% of the records.
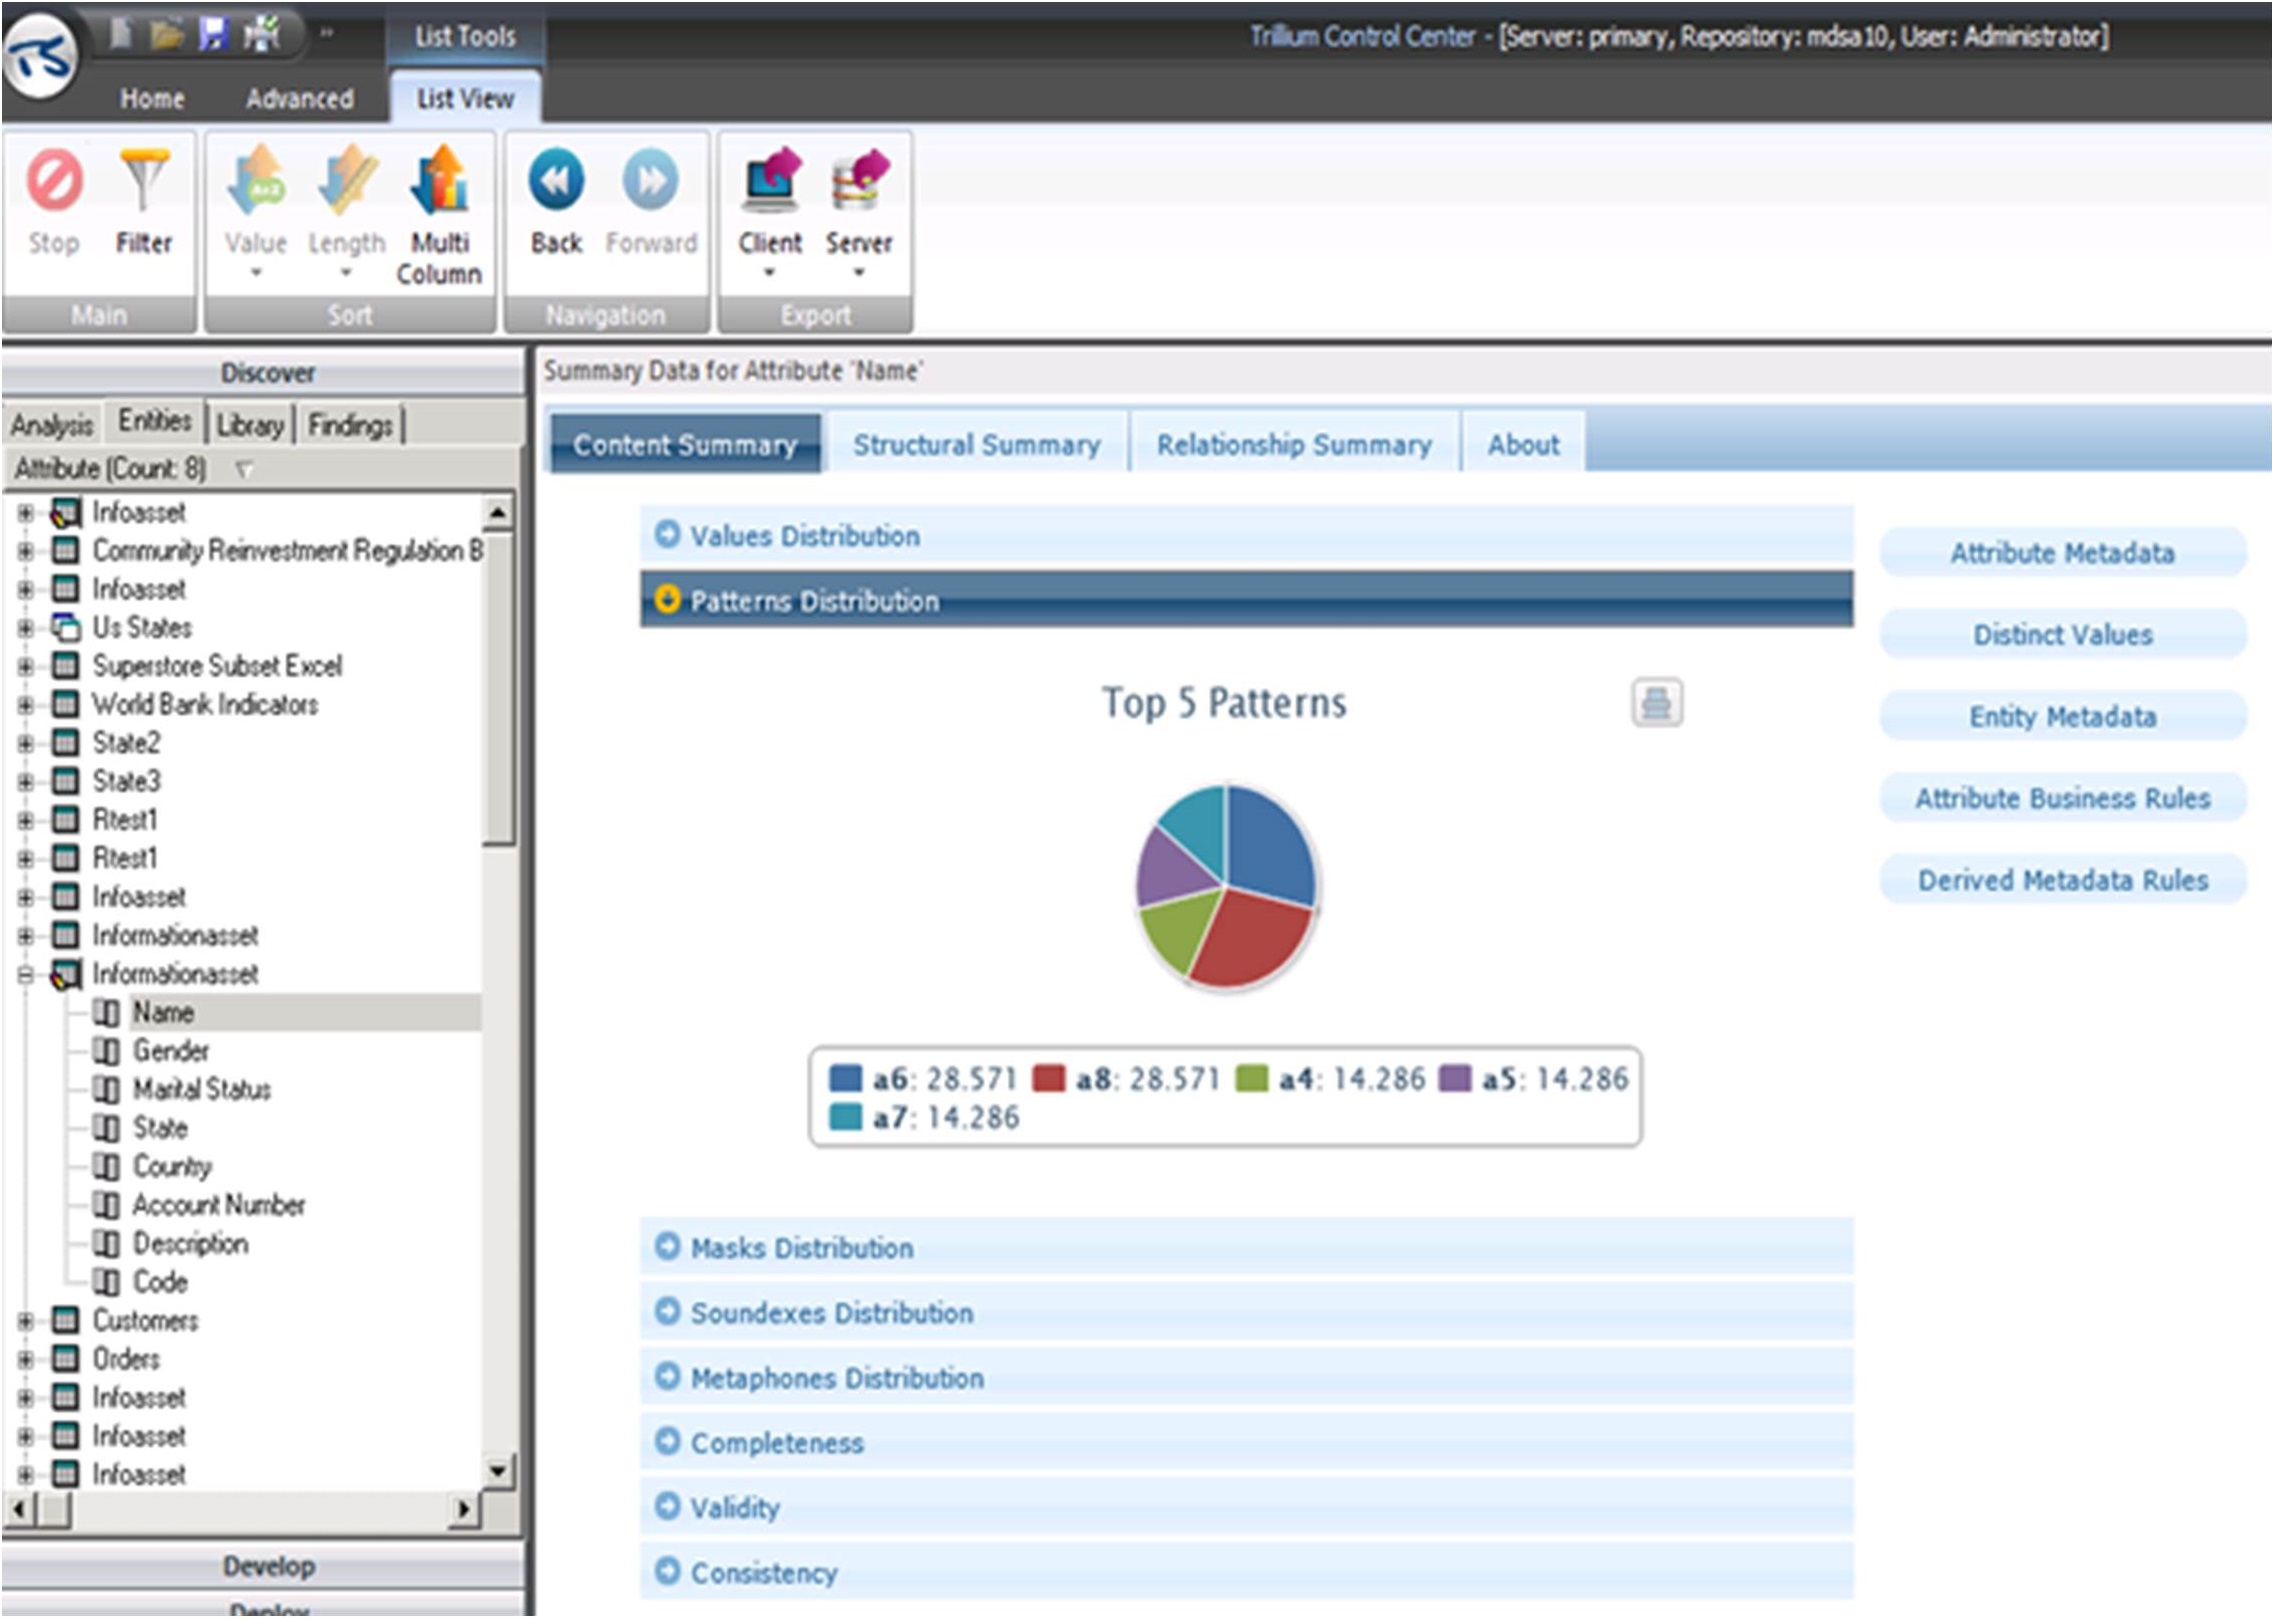
Figure 5.3: The Patterns Distribution for the Name column in Trillium TS Discovery.
Discover the Length Frequencies of a Column
Data discovery should also display the length frequencies of columns. In Figure 5.4, IBM InfoSphere Discovery displays the length frequencies for CHECKING.ACCOUNT_BALANCE. For example, values with a length of eight and seven occur 559 and 337 times, respectively. The bottom of the screen shows a preview of the rows where the length of CHECKING.ACCOUNT_BALANCE is seven.
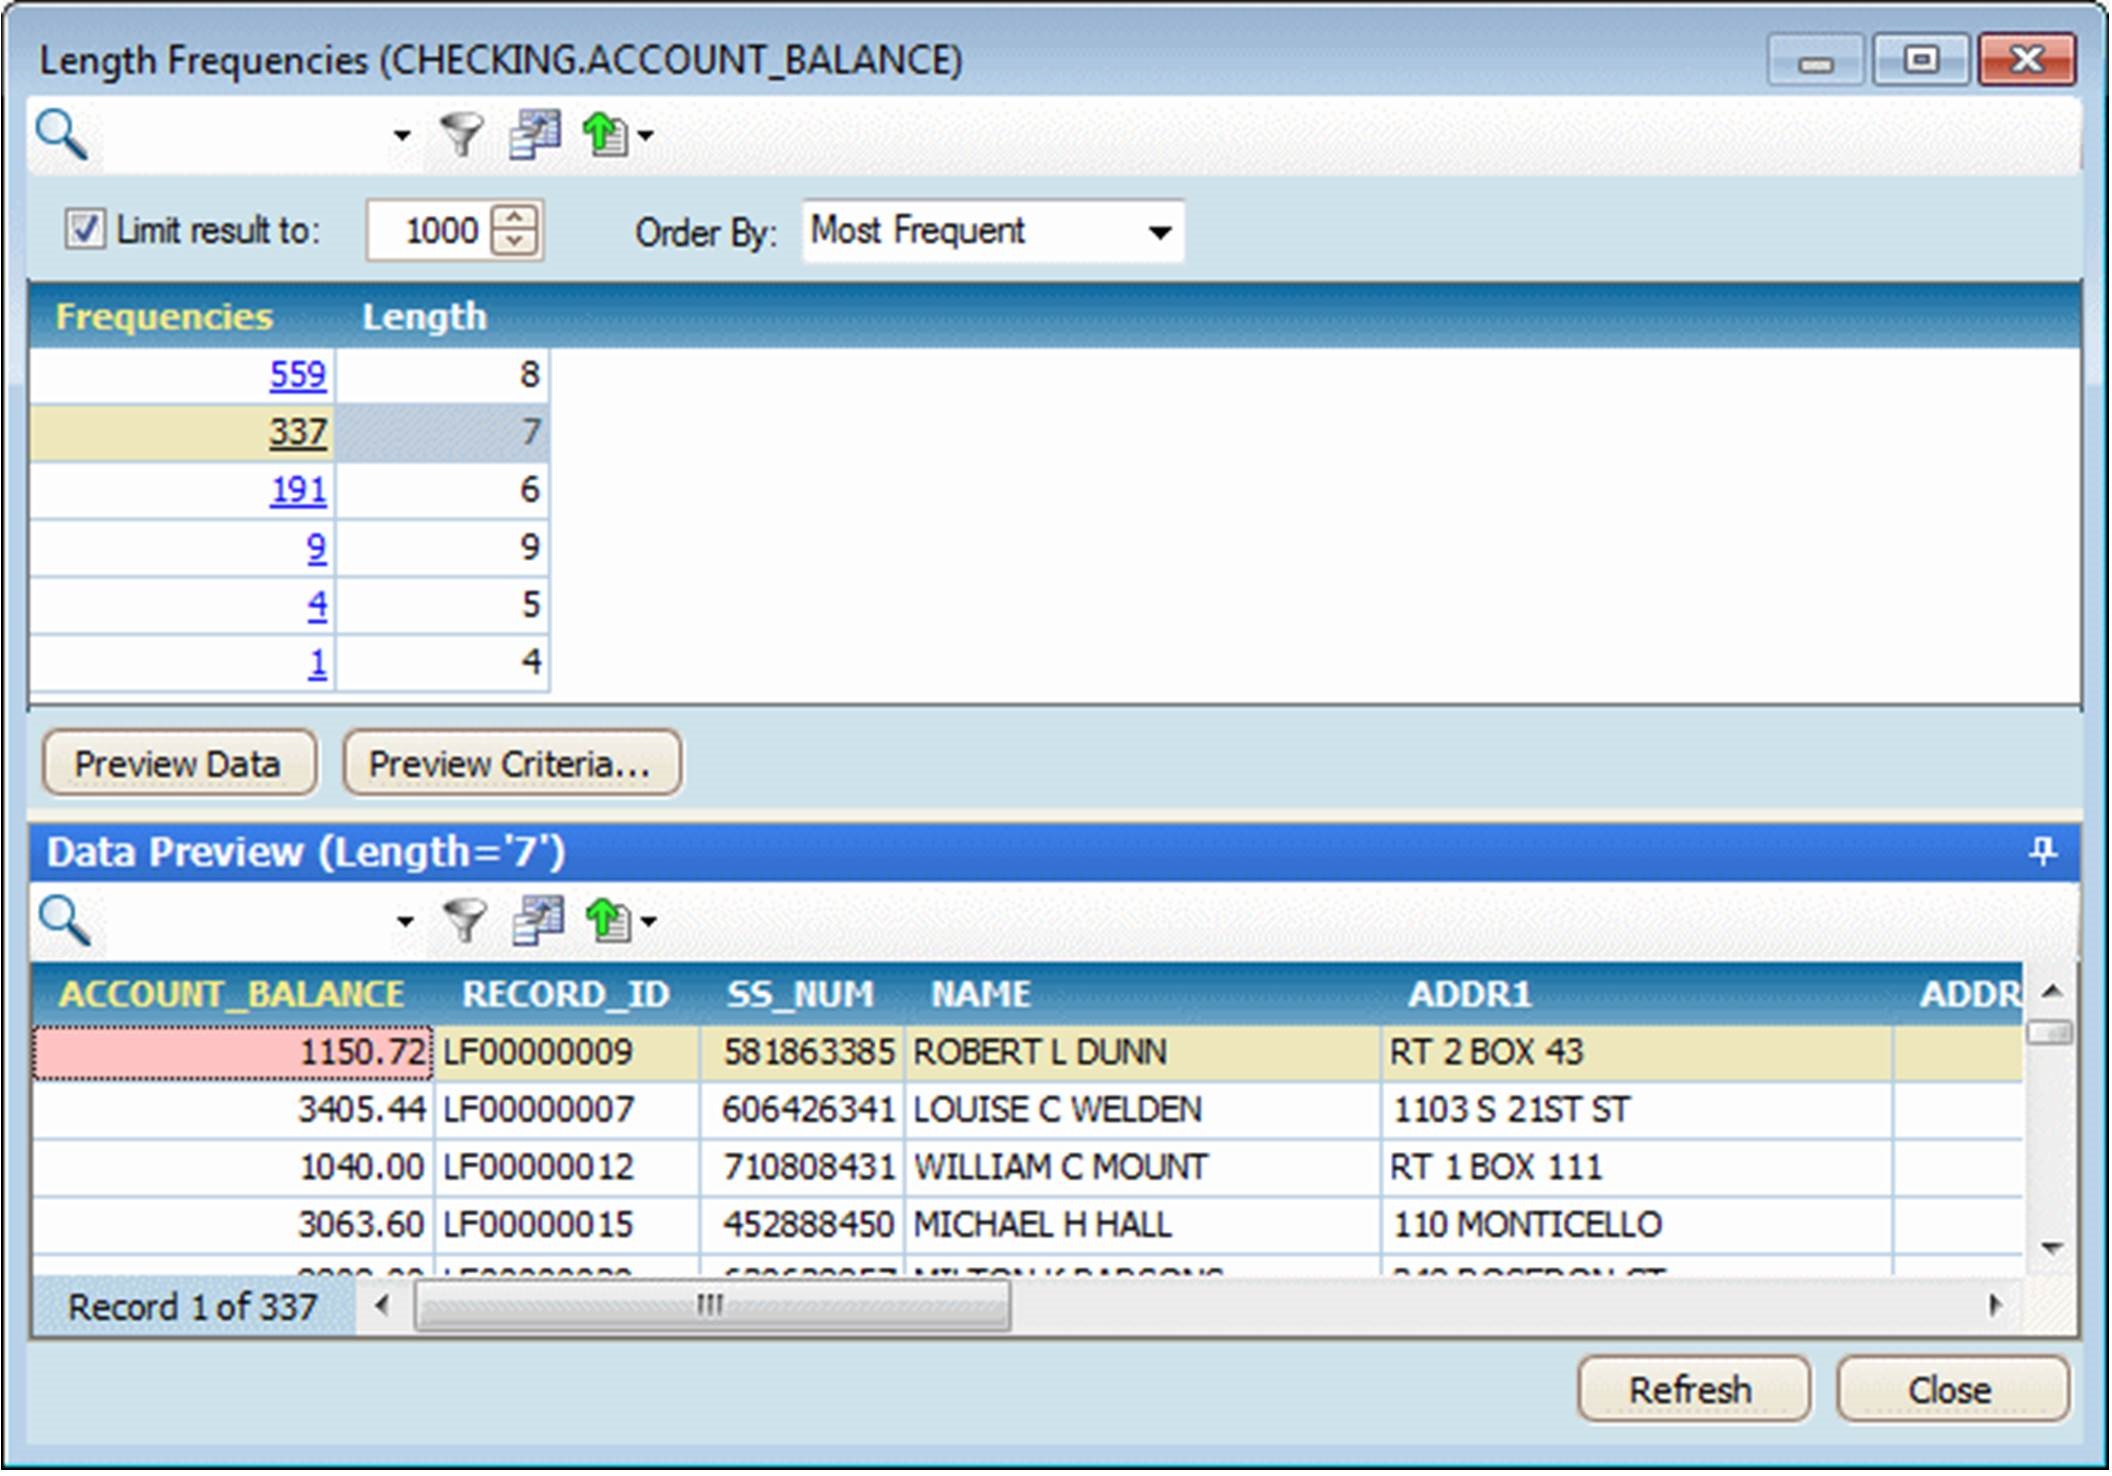
Figure 5.4: Length frequencies in IBM InfoSphere Discovery.
(From the IBM Redbook Metadata Management with IBM InfoSphere Information Server, October 2011, Jackie Zhu et al.)
Discover Hidden Sensitive Data
Data discovery tools can also discover hidden sensitive data, which is a specific form of pattern matching. The sensitive nature of the data might not be reflected in column or table names. For example, U.S. Social Security numbers might be hidden in a field called EMP_NUM. Figure 5.5 shows that credit card numbers have been discovered by the Global IDs Profiler within the CoffeeChainSheet.txt, MedSpan2.5_DataSample.txt, and customer_sample_value.csv data sources.
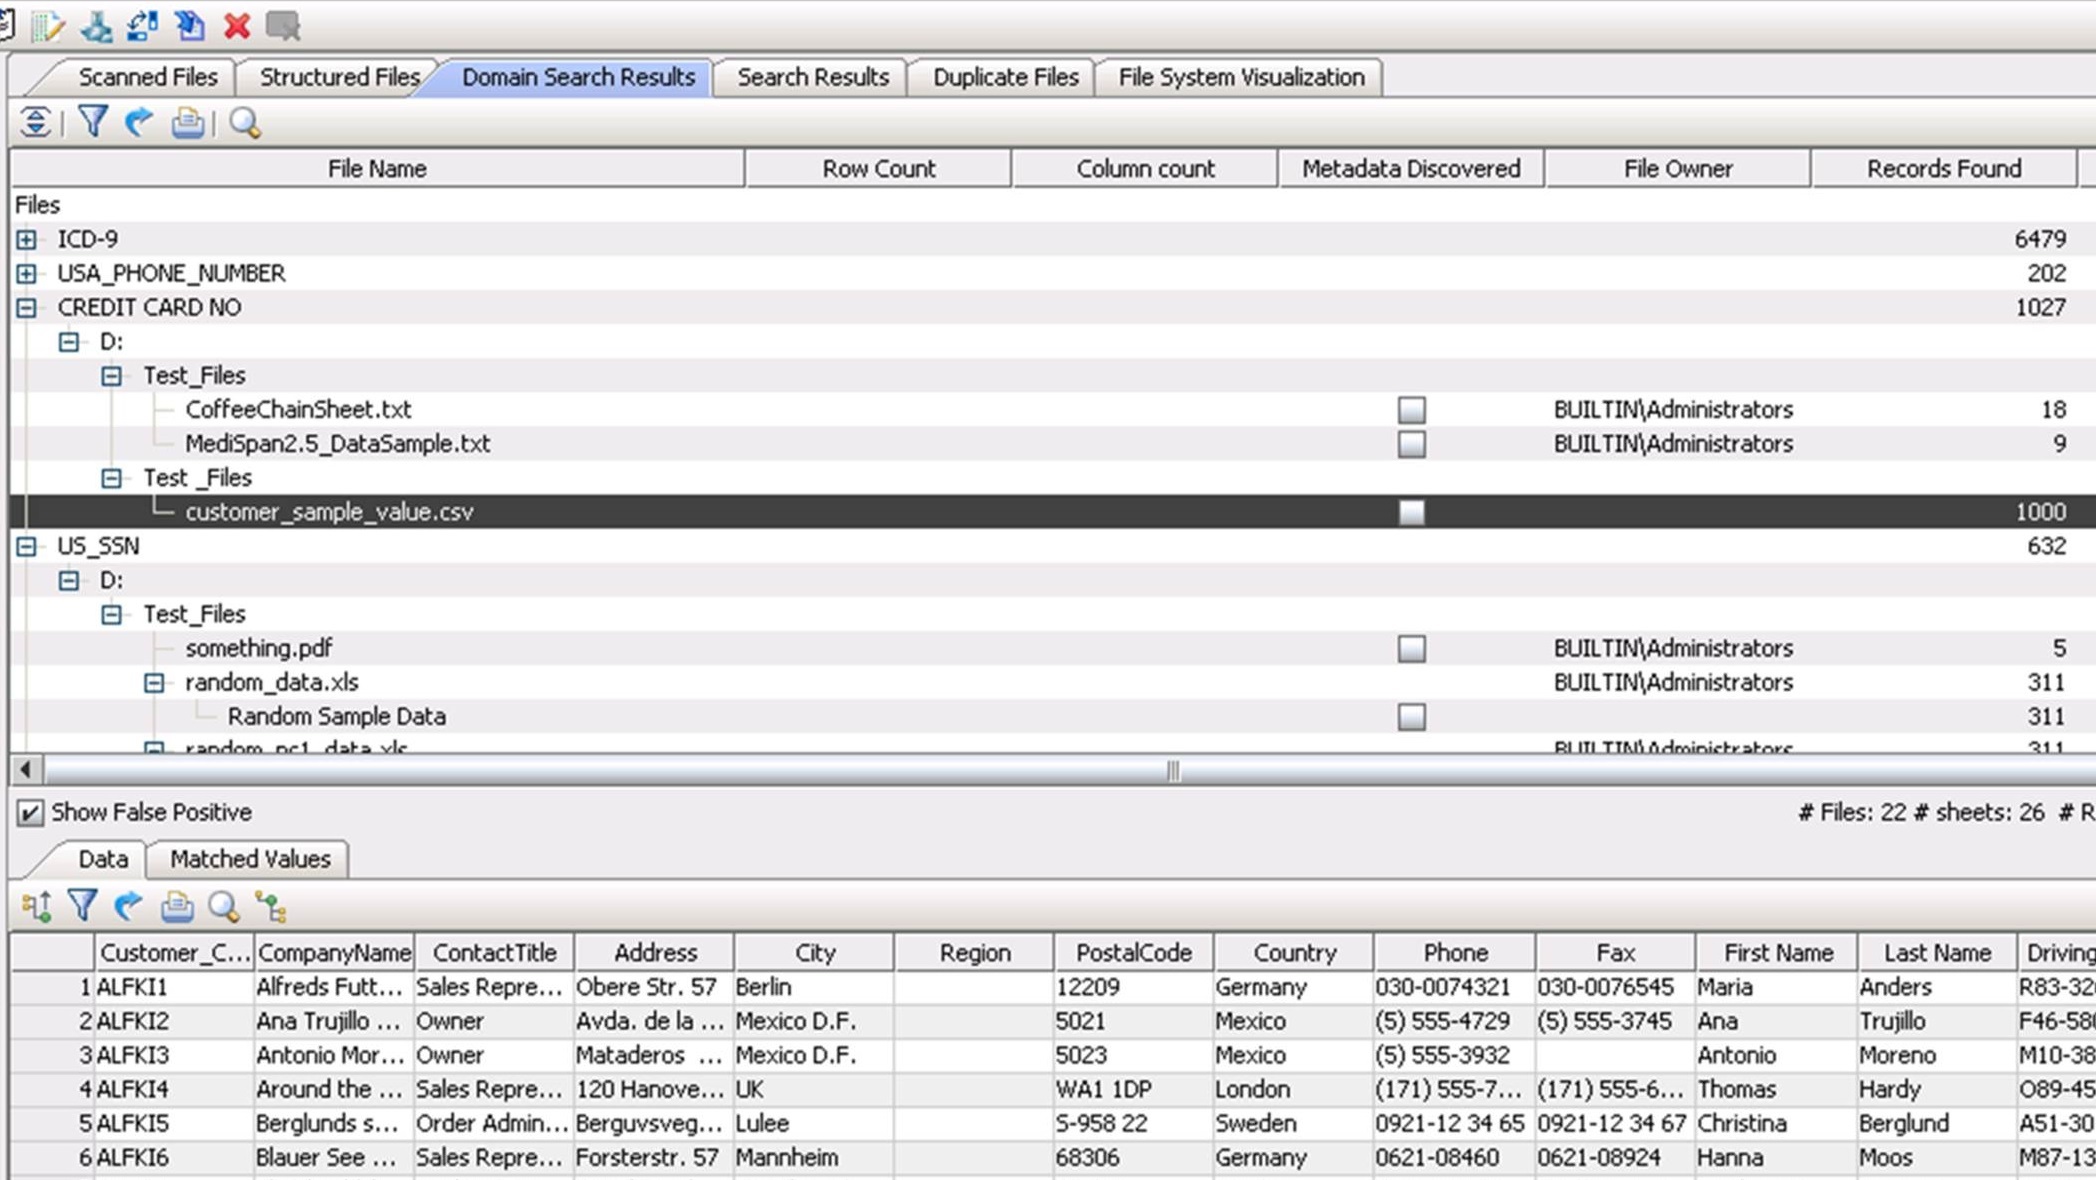
Figure 5.5: The Global IDs Profiler discovers credit card numbers within multiple data sources.
Discover Values with Similar Sounds in a Column
The data discovery tool should also discover column values with similar sounds. As shown in Figure 5.6, the Soundexes Distribution in Trillium TS Discovery shows the Name values with a similar sound that are grouped together as soundexes when the data is analyzed. The soundex is based on the first four values of every attribute. Trillium TS Discovery also checks for the Metaphone, which is based on the entire attribute value, helping to check for misspellings and data discrepancies.
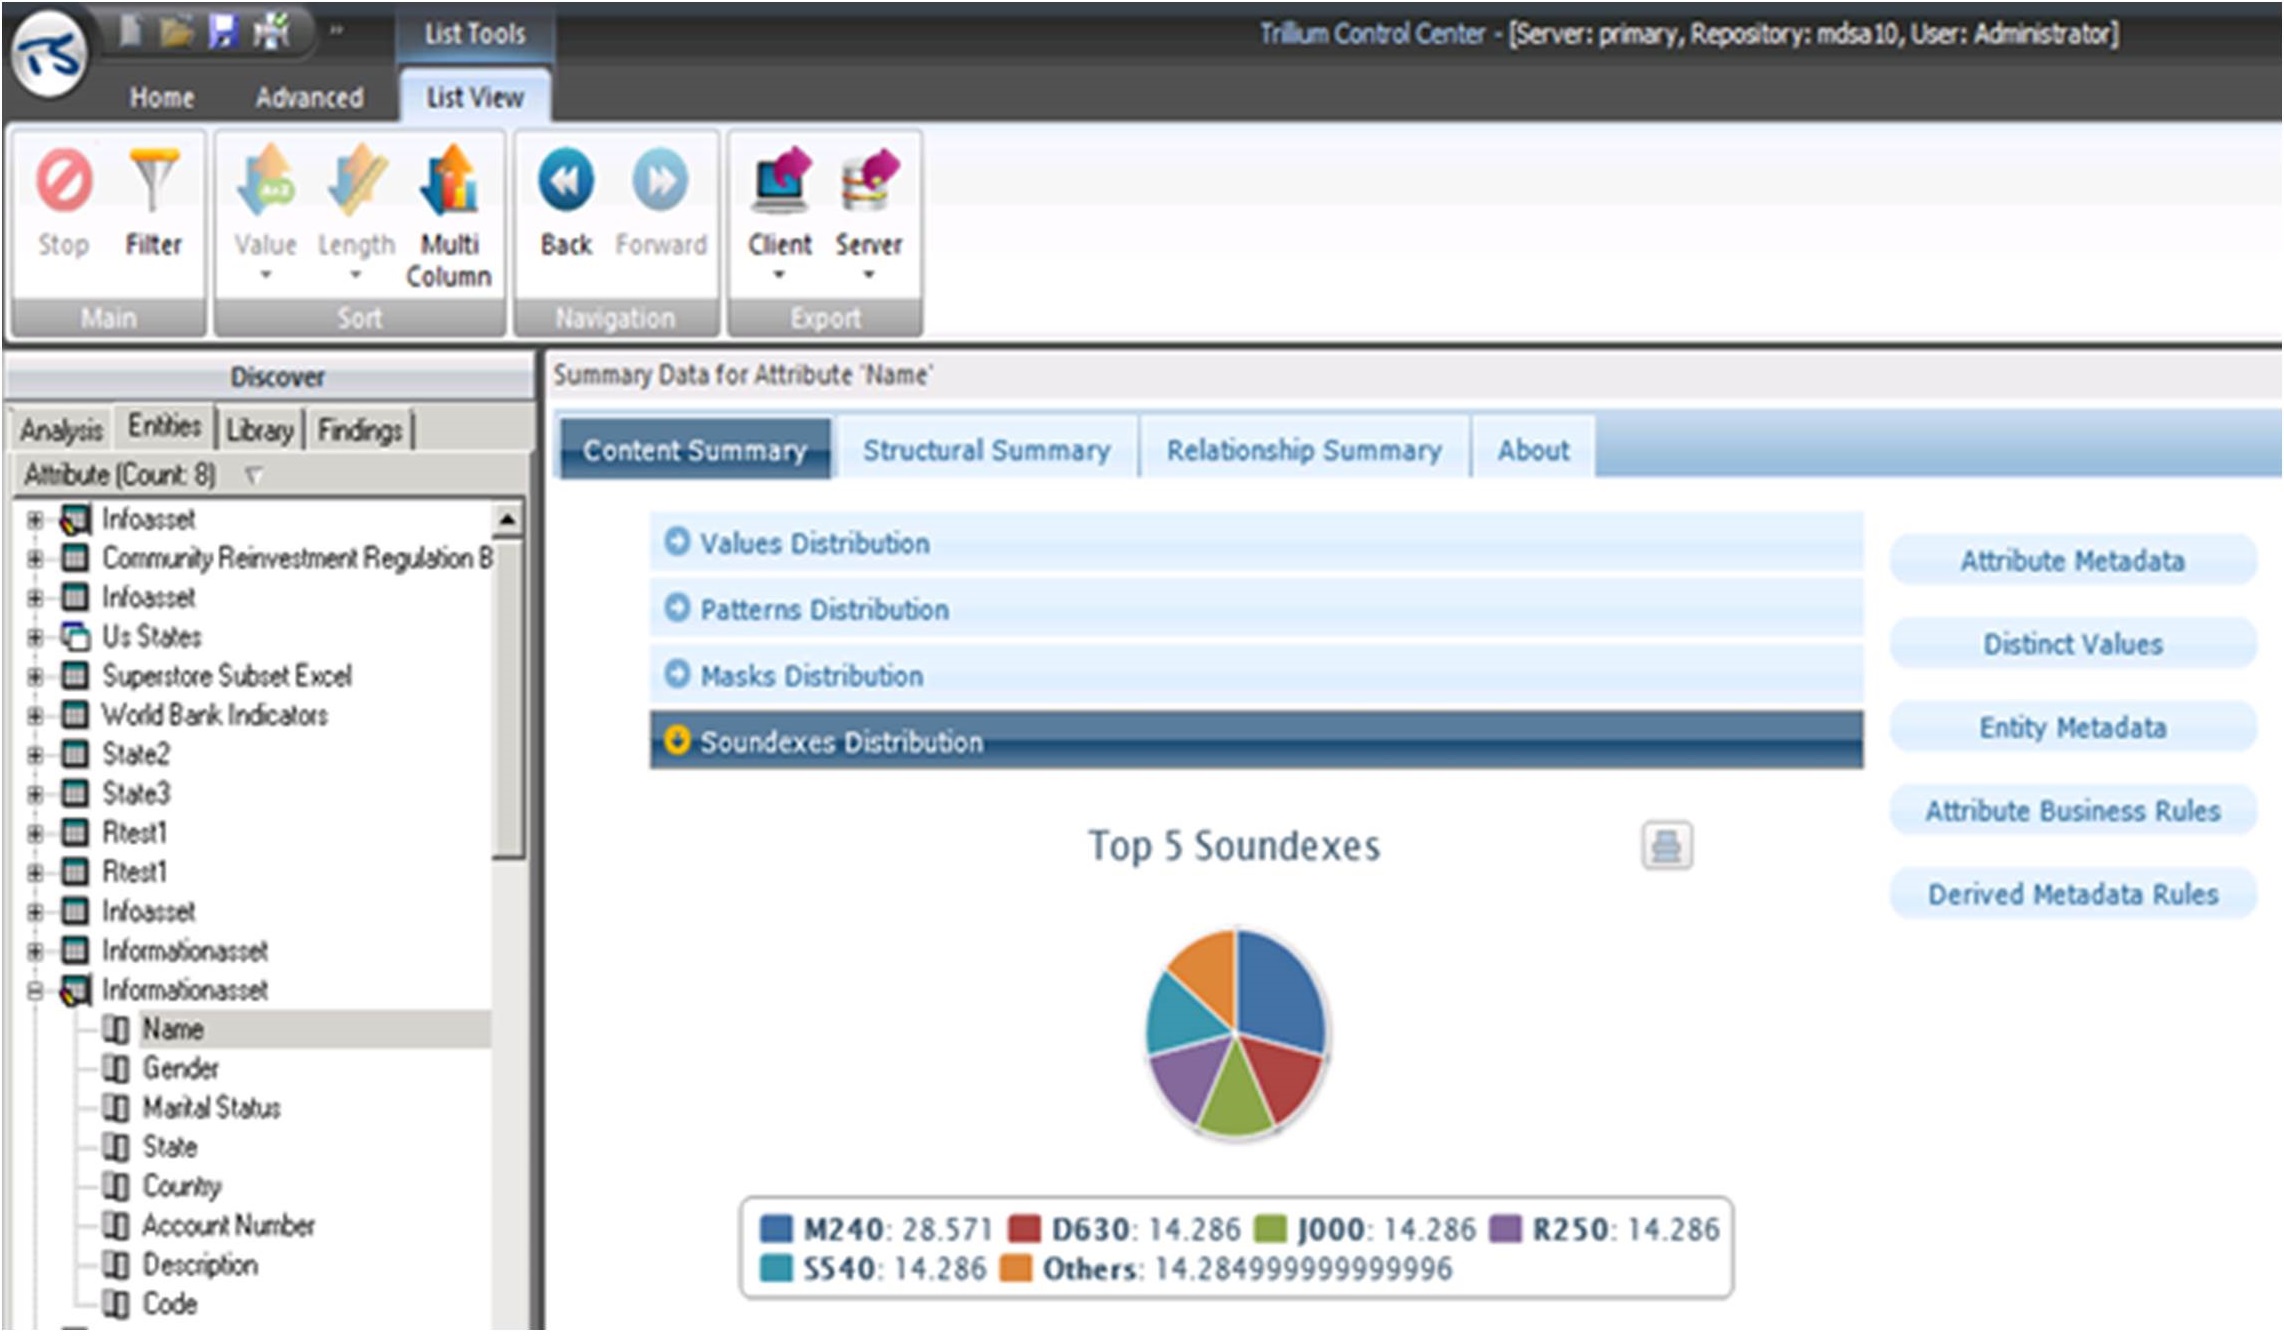
Figure 5.6: The Soundexes Distribution for the Name column in Trillium TS Discovery.

Sunil Soares is the founder and managing partner of Information Asset, LLC, a consulting firm that specializes in data governance. Prior to this role, Sunil was director of information governance at IBM, where he worked with clients across six continents and multiple industries. Before joining IBM, Sunil consulted with major financial institutions at the Financial Services Strategy Consulting Practice of Booz Allen & Hamilton in New York. Sunil lives in New Jersey and holds an MBA in finance and marketing from the University of Chicago Booth School of Business.
MC Press books written by Sunil Soares available now on the MC Press Bookstore.
 |
Big Data Governance Discover not only the “why” but the “how” of governing big data. List Price $59.95 Now On Sale
|
|
 |
Data Governance Tools See why tools are a critical component of a data governance program, and learn how to evaluate them. List Price $59.95 Now On Sale
|
|
 |
IBM InfoSphere: A Platform for Big Data Governance and Process Data Governance Get to know the big data support across the IBM InfoSphere portfolio. List Price $16.95 Now On Sale
|
|
 |
Selling Information Governance to the Business Learn best practices for implementing an information governance program across a variety of specific industries. List Price $49.95 Now On Sale
|
|
 |
The Chief Data Officer Handbook for Data Governance Implement a program that will manage data as an asset while delivering the trusted data your business initiatives require. Now On Sale
|
|
 |
The IBM Data Governance Unified Process Learn the 14 steps to implementing data governance based on IBM products, services, and best practices. Now On Sale
|


 More than ever, there is a demand for IT to deliver innovation. Your IBM i has been an essential part of your business operations for years. However, your organization may struggle to maintain the current system and implement new projects. The thousands of customers we've worked with and surveyed state that expectations regarding the digital footprint and vision of the company are not aligned with the current IT environment.
 TRY the one package that solves all your document design and printing challenges on all your platforms. Produce bar code labels, electronic forms, ad hoc reports, and RFID tags – without programming! MarkMagic is the only document design and print solution that combines report writing, WYSIWYG label and forms design, and conditional printing in one integrated product. Make sure your data survives when catastrophe hits. Request your trial now! Request Now.
 Forms of ransomware has been around for over 30 years, and with more and more organizations suffering attacks each year, it continues to endure. What has made ransomware such a durable threat and what is the best way to combat it? In order to prevent ransomware, organizations must first understand how it works.
 Disaster protection is vital to every business. Yet, it often consists of patched together procedures that are prone to error. From automatic backups to data encryption to media management, Robot automates the routine (yet often complex) tasks of iSeries backup and recovery, saving you time and money and making the process safer and more reliable. Automate your backups with the Robot Backup and Recovery Solution. Key features include:
 Business users want new applications now. Market and regulatory pressures require faster application updates and delivery into production. Your IBM i developers may be approaching retirement, and you see no sure way to fill their positions with experienced developers. In addition, you may be caught between maintaining your existing applications and the uncertainty of moving to something new.
 IT managers hoping to find new IBM i talent are discovering that the pool of experienced RPG programmers and operators or administrators with intimate knowledge of the operating system and the applications that run on it is small. This begs the question: How will you manage the platform that supports such a big part of your business? This guide offers strategies and software suggestions to help you plan IT staffing and resources and smooth the transition after your AS/400 talent retires. Read on to learn:
LATEST COMMENTS
MC Press Online