


IBM’s Intelligent Miner (IM) is a client/server package that provides data mining and statistical functions for mining your DB2 data warehouse. Because of its design and the fact that the heavy-duty processing will run natively on your AS/400, IM is geared to mining large databases. I was recently blessed with the opportunity to use IM against my AS/400 data warehouse. This article overviews IM features, shortcomings, my experiences with the product, and the information about our data that it brought to light.
It’s a Data Shovel!
IM costs $75,000, so a good question to ask is, “What do you get for your money?” As stated earlier, IM is a collection of data mining algorithms and statistical functions that will assist you in prying knowledge nuggets from your warehouse. How does it do this? IM is a complete set of tools for the cleansing, mining, extraction, and visualization of data. This is accomplished by integrating several sets of tools into one package.
IM algorithms are like huge data shovels that sift and move massive amounts of data. The algorithms run on your AS/400 as mining ser-vers. These algorithms can clean your database, perform statistical functions, mine data, and either create models or process existing data models for you. IM will work with any version of DB2 Universal Database, regardless of the platform. Because the server portion runs natively on each platform and all IM algorithms do not require all data to exist in memory, IM is scalable to handle terabyte databases with millions of records.
No database is totally clean, so the tools and statistical functions that IM provides to fill missing historical data, create missing values, aggregate data, and other ditties are useful. The statistical functions can be invaluable for finding metrics about your data. You will find that most data mining begins with the exploration of the data, then the cleansing and preparation of data sets.
IM has a rich visualizer for displaying mining results. By allowing you to interactively visualize mining results, IM supports iterative data mining and knowledge discovery. Iterative data mining is a more interactive and productive mining process. You set up a run, view the results, and spot something interesting. You then refine the model or search criteria and drill into the knowledge vein in search of nuggets.
Like a plant that extracts gold from ore, IM can turn knowledge nuggets into models. Using the IM API, you can apply models created on the server to your database to predict outcomes or forecast results. It’s not just mining; it is the digging, tunneling, processing, and manufacturing of information all rolled into a single product.
Core Mining Details
IM supports the following mining categories:
• Associations
• Classification
• Clustering
• Prediction
• Sequential patterns
• Time sequence analysis Each of the categories employs one or more algorithms, and each algorithm has setup pages that allow you to specify the input data, set parameters, and manipulate the algorithm.
You might have seen this ad: “Every Wednesday at 6:02 p.m., Bill buys beer and diapers. Don’t judge Bill.” Relationships between purchases can be easily found by using the Associations mining algorithm. This can be key in customer-relationship management applications or in finding trends in retail data that can be exploited via cross-promotions. Associations can be mined only against data that has a defined transaction or grouping criteria.
Classification supports both tree-induction and neural methods that can be used to create models. Once a model is created, it can be used to find data that fits the model set. You can use classification to create a tree of decision points that lead to an outcome, whether desired or not. Then, you can pass new data through the model to see which data fits the model, thereby predicting the outcome. Suppose you are an insurance company and have a set of customers who lapse their policies in the first year. Because underwriting and policy origination is expensive, you lose money if the policy lapses this early. Using classification, you can create a model that can predict whether a customer is likely to be a
“lapser” and then act accordingly to attempt to retain the customer.
Clustering models are useful for grouping data into sets that frequently occur and describing those sets for you. Clustering is generally the first algorithm that I use when I begin mining, as it is very automatic and allows for quick understanding of the data. By using IM’s clustering features and visualizing results, someone with domain knowledge of the data can spot interesting sets of like data, drill into the statistics about that data, and use the information to do further directed study against the data set. Once you discover interesting clusters that are germane, you can decide on another mining algorithm to better refine the knowledge or create a model. IM supports both neural (Kohonen feature map) and demographic clustering algorithms.
Prediction can be used to create forecasting models that can predict a value based on inputs. The prediction algorithm in IM is a back-propagating neural network. The nice thing about the IM algorithm is that it can be used to do windowed time periods, which means that you could create a model that is based on something that happens over a time period. Forecasting account profitability for a new bank customer is a type of model that could be created with this function.
Sequential patterns are for finding patterns in your data. Sequential patterns are things that are sequenced in time or by transactions. For instance, customers who buy a new boat insurance policy are likely to buy an umbrella policy within 12 months, and people who have more than three auto accidents a year are fraud candidates. Because sequential patterns occur over time, you must have some type of identifier to group your records. Common identifiers are customer numbers, transaction IDs, and case numbers.
Time sequence analysis is for identifying patterns or associations of activity and their relationship to time. If you had machine maintenance records and instrument readings, for example, you might use this model to identify sequences of instrument readings that correlate to equipment breakdowns, thus creating a model to forecast equipment breakdowns.
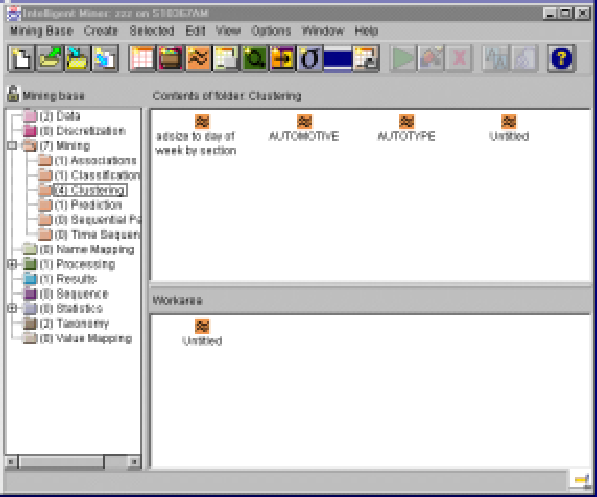
The Front End
IM’s front end runs on Windows 9x/NT, Advanced Interactive eXecutive (AIX), or OS/2 and is written mostly in Java. The IM front end gives you access to every aspect of the IM program. It is presented in an explorer-type view that is easy to navigate and should be a familiar metaphor to most users. A tree view on the left of the workspace expands to show available mining function, results, available processes, and other IM functions. A screen shot of the IM interface is shown in Figure 1.
Once a mining run is complete, you can view results with the visualizer. It allows you to drill down into the display charts and graphs or bring up windows that contain nice printouts of the mathematical data. It’s definitely a fun toy.
Insights of Mine
I work with a company called Advertising Data Scan (ADS) that tracks newspaper advertisers from the top 100 U.S. markets. ADS has a database that details 25,000,000 ad occurrences since 1995 in over 1,000 publications. This is fertile ground for exploration, so I eagerly installed IM on ADS’s AS/400 Model 170. Installing IM was easy, as was installing Windows 98 client software and setting up connectivity.
The first step toward using IM is to define available data. Since I did not want to mine all of the ADS data, I created a “de-normalized” table of advertisements that ran in the state of Florida. Then, I had to tell IM about the data. This is accomplished by using a task- guide based interface that is easy and intuitive. I defined my input table, which was a view of several tables on my AS/400, by selecting the AS/400, library, and table name. I accepted all of the default options that the task guide offered.
Next, I used the statistical functions to get some information about my data. I should note that I had previously run all of these statistical functions against my data, so I pretty much knew what to expect from the product. The functions all performed as expected, ran very quickly, and produced some neat graphs and charts in the visualizer component. The visuals are so much better than staring at strings of numbers. A lot of times, you can “see” the relationship, whereas viewing a grid of numbers offers absolutely no insight.
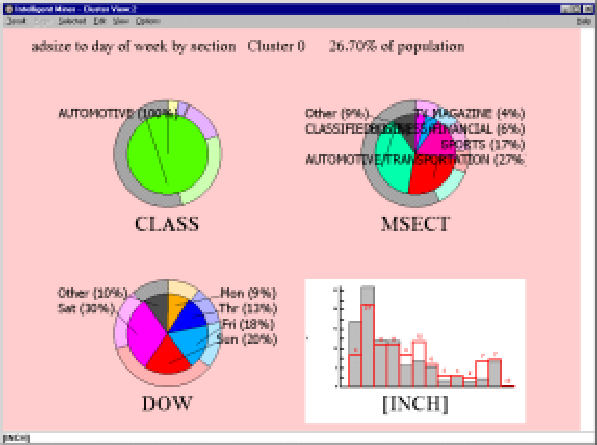
Since I always start a mining project with clustering, I used the task guide to prepare a run against my data set, chose the fields that I wanted to cluster, and turned the puppy loose. Low and behold, the visualizer brought up the screen shown in Figure 2.
The input to this run was newspaper section (MSECTNO), day of week (DOW), size of the advertisement (INCH), and classification or grouping of the advertiser (CLASS). If you look at the figure, you will see the knowledge gem that IM discovered about the target newspaper. First, it found a cluster in automotive advertisements. That cluster had 30 percent of its ads on Saturday, with Sunday running a close second at 20 percent (see DOW). Within these ads, it found that 37 percent were in the classified section and that the next biggest cluster was automotive, with 27 percent (see MSECTNO).
The inch histogram shows how the ad sizes broke out within the cluster. The interesting thing to note is the trend for ad sizes to be smaller for automotive ads than for other types of sections and classifications. This is brought to light by the second bar on the chart. The red bar indicates the number of ads outside of this cluster (i.e., how all other clusters fared in ad sizes). The solid gray bar indicates how this cluster fared. What the chart is saying is that this cluster has 26 percent of its ads in the 10- to 20-inch range, while
the population usually has 21 percent of its ads in the 10- to 20-inch range. As you can see, the visualizer really helps in interpreting the data quickly.
If you want more information on a chart, such as the actual distributions of the data, or want to see the chart zoomed, you just click on the graphic that you want enlarged. Using this feature, I was able to drill down from a graphic representing all of the clusters found to Figure 2, which is the graphic I just described. I can then drill to details about each chart and am able to pull the actual numbers from the visualizer. Navigation through data with the visualizer is a lot easier than trying to interpret a string of numbers!
Figure 2 also gives you an idea of how IM presents data to you. The pie charts are used to represent categorical variables, while the graph is used to indicate continuous variables. I believe that the visualizer is the strongest feature of this product.
Do You Mine?
I used IM for several weeks to explore my data and found some useful insights. For example, florists in the Jacksonville paper always advertise in the food section on Thursday. By creating tree models of the section, advertiser type, and day of the week, I was able to filter my data and look for outliers, things that don’t fit the model. By making models and using the API to incorporate them into my programs, I can make automated data-quality checks against incoming transactions. This will be very useful to my organization, because human quality-control clerks cost money. Since my company adds 40,000 new records per day, there is no way we could hire enough humans to check each entry. By leveraging models created with IM, I can automate my quality-assurance process to find operator errors. Neat.
It’s the Little Things
Let me begin by saying that, overall, I am in love with this product. It is a wonderful marriage of server-based processing and a nifty client viewer. In fact, I used the client from my home and connected to the AS/400 over the Internet with an ISDN line. It really is client/server in its truest sense. The product gives you the ability to find nuggets, then create and implement models that directly affect the bottom line. That is why I like it.
With that said, I would like to point out my frustrations with the product. For $75,000, I want legible documentation. I found the documentation of this product, while complete, lacking in literary value, which is usual for IBM committee-written manuals. While the documentation does have passages about each screen and documents all API calls, it lacks sufficient description of key processes and definitions of key terms. Although I have enough understanding of modeling techniques that I was able to use the product without good documentation (which is a credit to the product design), some users will need more.
I should point out that IBM typically does not just send this product to a customer. IBM has many partners and internal consultants that assist in pilot studies or product implementations, and there are some fine Redbooks and white papers that are available on using and implementing the product, which should come in the box and not have to be purchased separately.
IMHO, the user interface needs a little work. While, overall, it is easy to use, it annoyingly allows you to start tasks that will never finish, and when these impossible tasks finally error out, it gives you a message that adds whole new nether reaches to the word obscure. Do you have a clue as to what the cursor’s being in a bad state has to do with the creation of a neural net? Well, turns out the ignorant user (me) had accidentally asked to predict a categorical variable with an algorithm meant for continuous variables. OK, my mistake. But I would have rather received an error message that read, “Hey, bozo, buy a clue! This algorithm can predict only continuous variables!” before wasting minutes on processing that wasn’t going to bear fruit.
Searching for the Holy Grail
This product brings together some super high-powered algorithms and gives you an easy- to-use interface for exploring your data. I found the product to be extremely usable, and the interface is very intuitive. A few shortcomings in the documentation should be overcome by use of the available Redbooks and white papers, and again, most organizations will purchase this product with some kind of consulting assistance that will make implementation easier.
What’s sad is that with a few changes to the documentation and very small user interface cleanup, IBM could target this product to the uninitiated data miner. The product is excellent and very easy to use. If IBM could redirect its energies to these points, the product could find a niche into the mass market of data mining tools; it’s that good.
Mine Your Own Business
IBM is also going to leverage the product by bringing out versions that are targeted to specific industries, like the version that is currently available for customer-relationship marketing. By the time this goes to press, IBM will have announced versions of Intelligent Miner targeted to the insurance, telecommunications, and finance. These versions will have more defined tasks and documentation on how to use the product within the industry to implement typical data-mining goals that are shared within each industry. These are products to watch if you are in the targeted industries.
Overall, I would recommend that any organization that needs a well-rounded data- mining tool check this product out. Intelligent Miner is definitely one of the best, and since it runs natively against DB2, it deserves a look.
Figure 1: The IM interface is implemented along the intuitive explorer paradigm.
 |
 |


 More than ever, there is a demand for IT to deliver innovation. Your IBM i has been an essential part of your business operations for years. However, your organization may struggle to maintain the current system and implement new projects. The thousands of customers we've worked with and surveyed state that expectations regarding the digital footprint and vision of the company are not aligned with the current IT environment.
 TRY the one package that solves all your document design and printing challenges on all your platforms. Produce bar code labels, electronic forms, ad hoc reports, and RFID tags – without programming! MarkMagic is the only document design and print solution that combines report writing, WYSIWYG label and forms design, and conditional printing in one integrated product. Make sure your data survives when catastrophe hits. Request your trial now! Request Now.
 Forms of ransomware has been around for over 30 years, and with more and more organizations suffering attacks each year, it continues to endure. What has made ransomware such a durable threat and what is the best way to combat it? In order to prevent ransomware, organizations must first understand how it works.
 Disaster protection is vital to every business. Yet, it often consists of patched together procedures that are prone to error. From automatic backups to data encryption to media management, Robot automates the routine (yet often complex) tasks of iSeries backup and recovery, saving you time and money and making the process safer and more reliable. Automate your backups with the Robot Backup and Recovery Solution. Key features include:
 Business users want new applications now. Market and regulatory pressures require faster application updates and delivery into production. Your IBM i developers may be approaching retirement, and you see no sure way to fill their positions with experienced developers. In addition, you may be caught between maintaining your existing applications and the uncertainty of moving to something new.
 IT managers hoping to find new IBM i talent are discovering that the pool of experienced RPG programmers and operators or administrators with intimate knowledge of the operating system and the applications that run on it is small. This begs the question: How will you manage the platform that supports such a big part of your business? This guide offers strategies and software suggestions to help you plan IT staffing and resources and smooth the transition after your AS/400 talent retires. Read on to learn:
LATEST COMMENTS
MC Press Online