


Faster! Faster! Everybody wants their apps and reports to run faster!
All of you have users and bosses who regularly ask if it's possible to make applications and reports run faster on your IBM i. Usually, these applications and reports spend a significant amount of time processing data stored in your DB2 for i databases. This article contains seven DB2 for i performance-tuning tips for speeding up the applications and reports running on your IBM i systems.
The DB2 for i performance-tuning tips included here are focused on the SQL-based data access interfaces. The SQL performance-tuning techniques are being emphasized because there is so much information already available on tuning the performance of RPG and COBOL programs that use the native, traditional record-level access interfaces for accessing DB2 for i.
Due to the number of performance-tuning tips included in this article, there's not room to include all the details related to each SQL performance recommendation. There are two options available to build a deeper knowledge of DB2 for i SQL performance. One way is to attend the DB2 for i SQL Performance Workshop. The other approach is to work with an expert on the DB2 for i Center of Excellence team, which is part of the IBM STG Lab Services and Training organization.
Tip #1: Increase Usage of SQE
IBM delivered the first iteration of the SQL Query Engine (SQE) in V5R2. SQE was designed specifically for the SQL language to deliver competitive performance for SQL workloads running on DB2 for i. Prior toV5R2, all SQL statements were processed by the Classic Query Engine (CQE). CQE is the long-time integrated relational database engine that had been modified over time to support SQL queries. The delivery of an engine designed for SQL allowed IBM to incorporate many industry-leading optimization techniques that have led to significant performance improvements for long-running, complex SQL requests.
One example of these advanced optimization techniques is the Adaptive Query Processing (AQP) support introduced with the IBM i 7.1 release. AQP is a self-learning optimization technology that enables DB2 for i to make real-time plan adjustments—such as changing the join order or utilizing a new index—while the SQL request is running. These adjustments are implemented without any disruption to the application. As a result of SQE's superior performance techniques, some customers have seen the execution times of SQL requests go from hours to minutes; obviously, your mileage will vary.
The easiest way to get more of your SQL statements processed by SQE is to load the latest version of the IBM i operating system. That is because each release delivered since V5R2 has increased the number of SQL requests that can be run by SQE. This staged approach culminates with the IBM i 7.1 release, which is the first release that enables all SQL statements to be processed by SQE. The key enabler of this achievement in IBM i 7.1 is SQE's ability to process SQL statements that contain logical file references on the FROM clause. At a recent conference, a customer who had upgraded to IBM i 7.1 shared that the response time of one SQL statement went from six hours to 20 minutes. That complex SQL statement was referencing a logical file on the FROM clause, so the dramatic performance advancement was simply a result of the SQL statement being processed by SQE instead of CQE. Installing the latest IBM i operating system release was the only action that the client had to take. Support for simple logical file references on the FROM clause is now available on IBM i 6.1 by applying the latest Database Group PTF.
The Query/400 and OPNQRYF interfaces are not supported by SQE. Thus, converting these query definitions over to SQL is another way to increase the usage of SQE and boost the performance of your system at the same time. Some customers have accomplished this conversion through the use of the IBM DB2 Web Query for i product. In addition to providing modern graphical reporting capabilities, DB2 Web Query utilizes SQL within its reporting engine, which enables the usage of SQE. If you're using third-party reporting tools and want to reap the performance benefits of SQE, then you should investigate whether these reporting tools are using SQL or legacy query interfaces, such as the QQQQRY API that are stuck with using CQE.
Applications running on operating system releases older than IBM i 6.1 and executing SQL requests against DDS-created databases can increase the chance of SQE being used by utilizing the IGNORE_DERIVED_INDEX QAQQINI option. A breakdown of the SQL statement types supported by SQE at each release level can be found in the SQE Overview presentation.
Other than faster performance, you might be wondering how to determine which engine is processing an SQL statement. You have perfect timing because that's covered in the next performance tip.
Tip #2: Use "New" DB2 Performance Tools
As shown in Figure 1, DB2 for i provides a wide variety of tools for analyzing and tuning SQL performance. The vast majority of these tools are provided with the System i Navigator client (formerly known as iSeries Navigator and Operations Navigator). The reality is that these tools are not new; all of these tools have been available since V5R4, and many of the tools are available on pre-V5R4 releases. Notice in Figure 1 that several tools appear below a dashed line. All of the tools below the dashed line are considered non-strategic and as a result are not being enhanced by IBM. These non-strategic tools are useless in terms of understanding SQE query plans because the tools haven't been enhanced since the V5R2 release when SQE was introduced. As a result, any users still relying on these tools for feedback from the DB2 for i engine are receiving incomplete or inaccurate information. For instance, none of the enhanced index advice provided by the SQE query optimizer is available to users of the non-strategic tools.
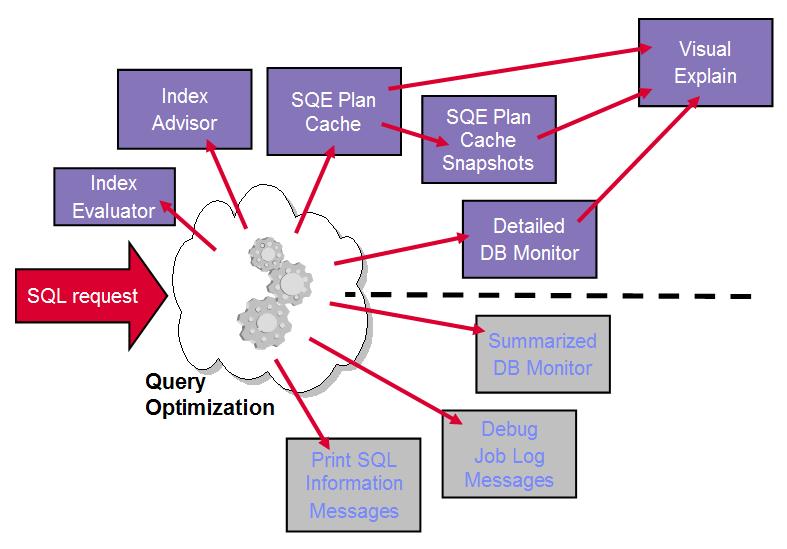
Figure 1: DB2 for i offers many tools for analyzing and tuning SQL performance. (Click images to enlarge.)
Unfortunately, way too many users are still relying on these legacy tools—in particular, the debug job log messages. Figure 2 contains an example of the debug messages written by DB2 into the job log for a query that joins together two tables: Inventory and Orders.
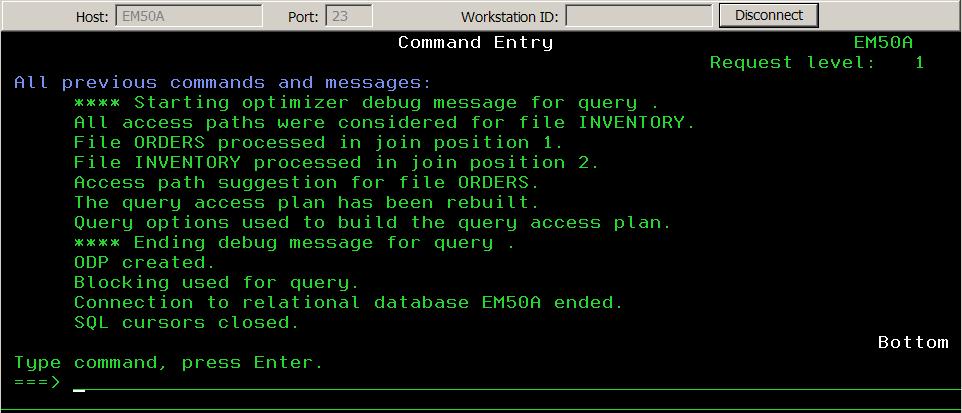
Figure 2: Are you still relying on debug job log messages?
Now, compare this green-screen job log message output with the graphical representation of the query plan in Figure 3 produced by the Visual Explain tool. First, notice that the job log messages do not contain any record of the SQL statement that generated the messages while Visual Explain includes that at the bottom of the window. With debug messages, it's up to you to figure out the SQL statement associated with the messages. Good luck trying to do this when the associated program executes dozens of SQL statements. Second, the job log has no indicator of whether SQE or CQE was used. With Visual Explain, all you need to do is click on the "Final Select" icon and scroll to the bottom of attribute pane on the right. When SQE is not used, the attribute pane will contain an explanation of why CQE was used. Third, the level of detail in the Visual Explain generated plan is also much greater than the job log messages. The job log messages do not contain any record of a temporary data structure, such as a hash table, being used by DB2. A hash table icon is often an indicator that there was not an index available for the query optimizer to use. Speaking of indexes, the job log messages contain only one index recommendation. For this query, the SQE Index Advisor actually recommends three indexes. After comparing just some of the differences between these two tools, it should be abundantly clear that continued usage of the debug messages for SQL performance analysis is ineffective and inefficient.
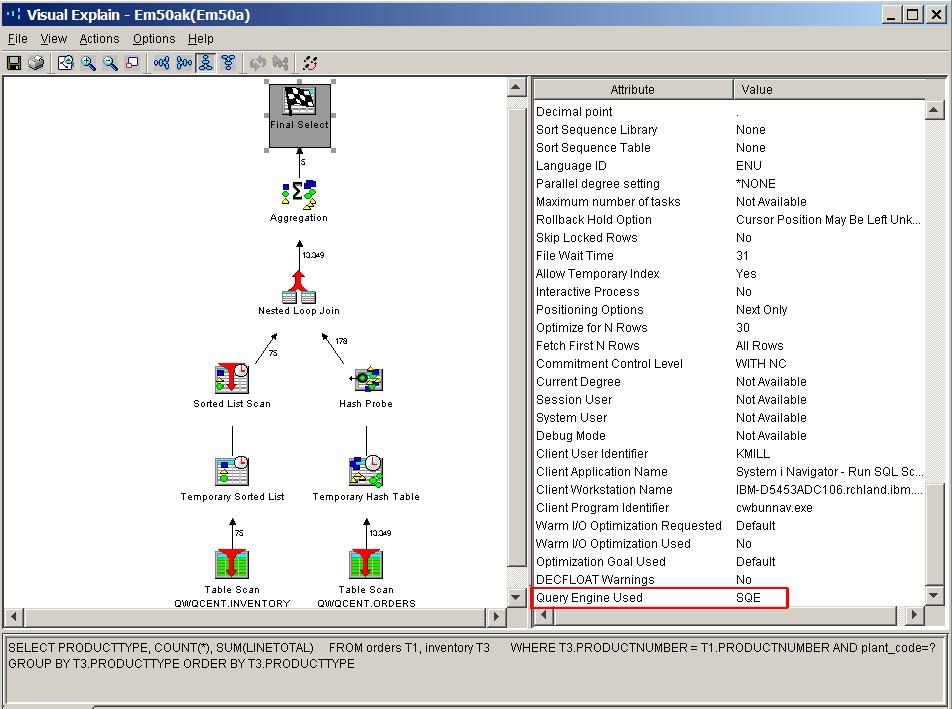
Figure 3: Visual Explain provides much more detailed information than the job log messages do.
Some may think that debug messages are the only analysis tool available for the legacy Query/400 and OPNQRYF interfaces. However, that is no longer true. Starting with the DB2 for i 6.1 release, the SQL Performance Monitor support was enhanced to collect additional data for Query/400 and OPNQRYF requests to enable Visual Explain to be used for analysis of the query plan. As shown in Figure 1, Visual Explain output can be generated only from a detailed SQL Performance Monitor or Plan Cache data.
In addition to collecting the data necessary to produce the graphical Visual Explain output, the SQL Performance Monitor is a trace-level tool that tracks all kinds of metrics related to the execution of SQL statements and queries. As you might expect, one of those metrics is the tracking of SQE and CQE usage. This tracking is demonstrated in Figure 4. This analysis window is produced by right-clicking on a monitor collection and selecting the Analyze task.
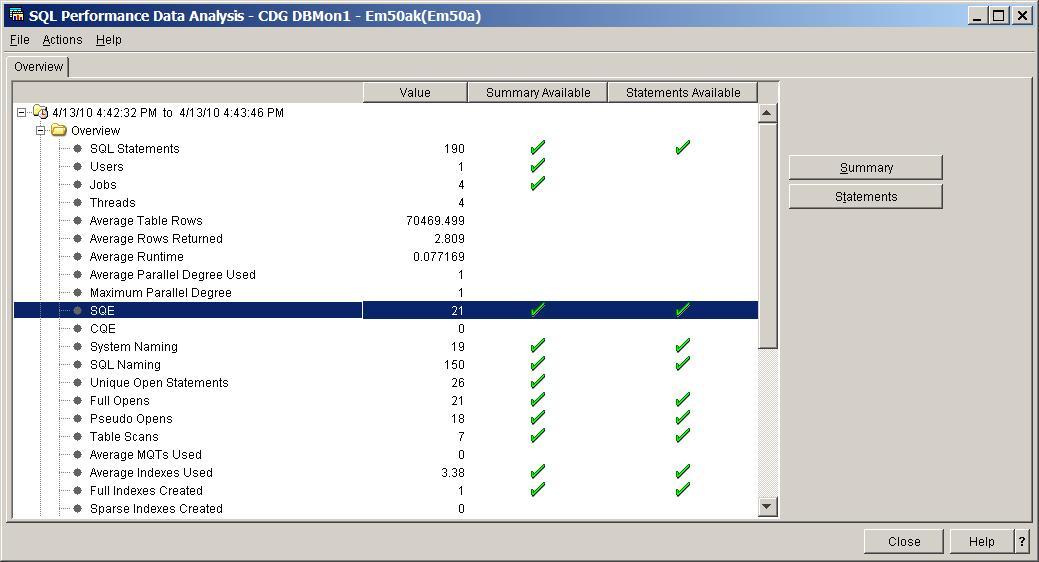
Figure 4: SQL Performance Monitor tracks metrics related to the execution of SQL statements and queries.
The following list of IBM Redbooks and downloadable tutorials are great resources to help you get started with using the new DB2 for i performance tools.
- OnDemand SQL Performance Analysis Simplified on DB2 for i
- SQL Performance Diagnosis on IBM DB2 for i
- System i Navigator DB2 Tool Tutorials
It's critical that users start leveraging the strategic DB2 for i performance tools to be more effective and efficient when analyzing and tuning SQL performance on their system. If you don't care for the DB2 performance tools provided by IBM, then be aware that Centerfield Technology also offers a modern, graphical set of tools for tuning DB2 for i SQL performance.
Tip #3: Eliminate Unnecessary and Expensive Temporary Index Creations
All Relational Database Management Systems (RDBMS) products rely on indexing technology to speed up the performance of SQL requests. As a result, a missing or sub-optimal index is one of the common causes of SQL performance trouble on all platforms. In this regard, DB2 for i is no different from other databases.
However, DB2 for i does try to remedy the issue of missing indexes by automatically creating temporary indexes to improve the performance of an SQL statement. This is a good news/bad news situation. The good news is the temporary index will help the performance of your SQL query. The bad news is a lot of system resources and time is required to build the temporary index before the actual running of SQL statement begins. The bad news is even worse for temporary indexes built by CQE. The temporary indexes built by CQE cannot be shared across users or queries. If there are 50 users running the same report, which results in CQE having to build a temporary index as part of the plan, then all 50 users will end up building their own version of the temporary index. If one of these users runs a slightly different version of the report that would benefit from the temporary index, the temporary index created by CQE cannot be reused. CQE would have to create another instance of the temporary index for the second report.
While the temporary indexes built by SQE are more reusable than those built by CQE, they are still temporary objects, which means they have their own issues. All IBM i temporary objects are deleted when a server is shut down. As a result, the performance of those SQL statements relying on SQE temporary indexes will be slower after a system IPL because the temporary index objects no longer exist. This is due to the fact that the SQE query optimizer usually requires several executions of a query before it can justify the cost of creating a temporary index.
Creating a permanent index to replace the temporary index is the easiest way to avoid the performance degradation associated with temporary indexes. Visual Explain and the SQL Performance Monitor tools are the best tools for identifying the usage of temporary indexes. Figure 5 contains the Visual Explain output for a query plan that utilizes a temporary index as part of its implementation. The names of SQE temporary indexes have a prefix of "MTI" while CQE temporary indexes have a name prefix of "*TEMP".
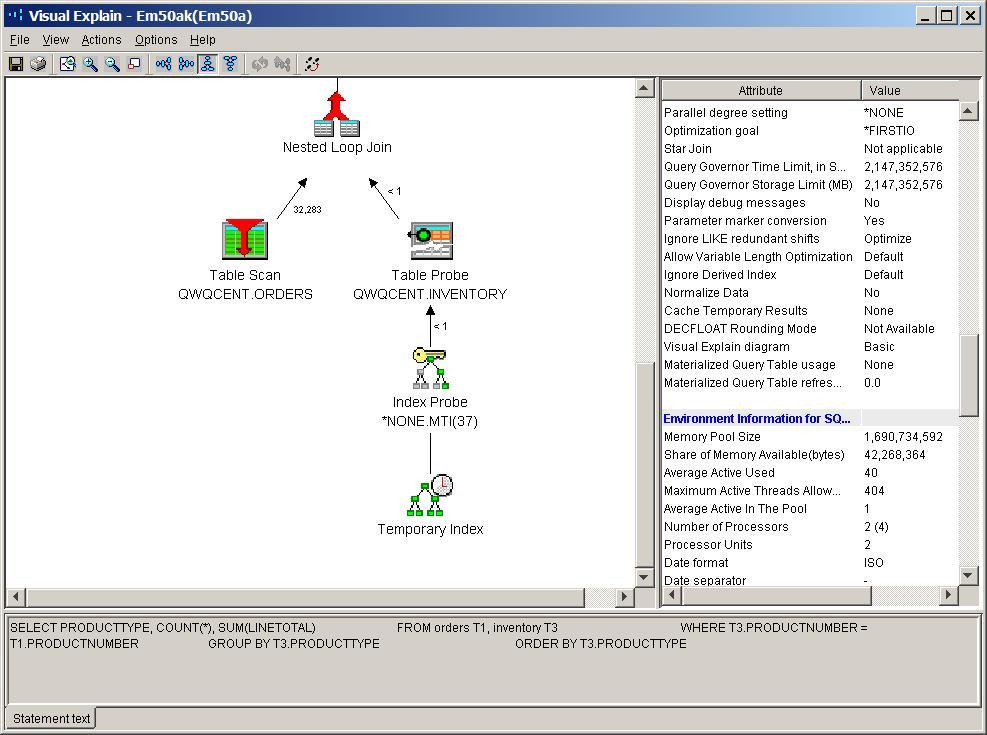
Figure 5: This example query plan utilizes one temporary index.
The SQL Performance Monitor analysis output window in Figure 4 contains a count of the number of temporary indexes created. This example monitor collection recorded only the creation of one temporary index.
Tip #4: Eliminate Inefficient Table Scans
The query optimizer's usage of the table scan method in a query plan can also be an indicator of missing or sub-optimal indexes. In a perfect world, the query optimizer would use the table scan only when a large percentage of the rows in a table need to be processed; the ideal usage is when more than 20–30 percent of the rows in the table need to be accessed.
However, sometimes the query optimizer is forced into selecting the table scan method to retrieve a low percentage of the rows because there are no indexes available for the query optimizer to use. Clearly, scanning one million rows to only return one thousand rows from a table is not an efficient use of system resources.
Identifying inefficient table scans boils down to reviewing query plans that utilize the table scan method and comparing the total number of rows in the table with the number of rows selected. Figure 5 demonstrates how Visual Explain makes it easy to identify the usage of the table scan method by the query optimizer. The Visual Explain detail pane for the Table Scan icon contains the counts for the estimated number of selected rows along with the total number of rows in the table. If the number of rows selected is a low percentage compared to the total number of rows in the table, then you have found an inefficient table scan. At this point, the next step in the analysis is reviewing the list of indexes available for the query optimizer to use as well as any index recommendations from DB2.
Tip #5: Evaluate Index Advice
DB2 for i includes a set of tools that makes it easy to access index advice. Prior to V5R4, the index advice could be accessed only when a tool such as the database monitor had been manually activated prior to the query or application being run. Even if this was done, an analyst had to deal with the complexities of extracting the advised index details of various job logs and database monitor files. To eliminate these complexities, the Index Advisor was enhanced in V5R4 so that it is always running making the index advice available on demand on any system. This capability is known as the System-wide Index Advisor. With this support, accessing index advice is as simple as a mouse click. Just right-click on your Database name within the System i Navigator tree and select the Index Advisor task as shown in Figure 6; you will be given the output displayed in Figure 7. The System-wide Index Advisor data can be filtered to report on a schema or table-level by right-clicking on those objects and selecting the Index Advisor task.
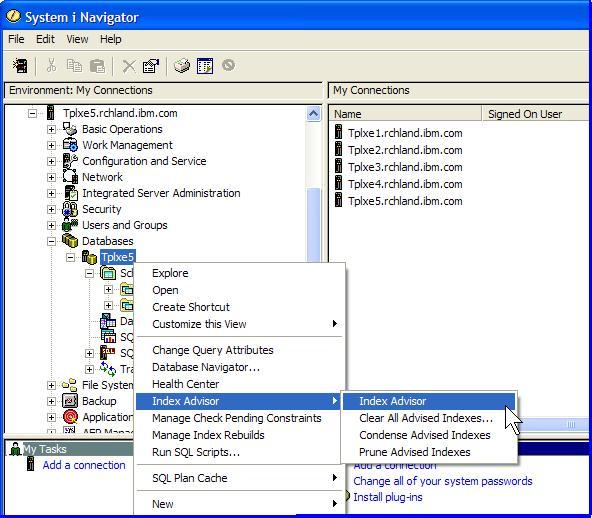
Figure 6: Select the Index Advisor task.
The index advice data shown in Figure 6 is a customized view of the output window. The graphical interface allows the columns to be re-ordered or removed from the view. With the default layout, you must manually scroll to the right side of the output window in order to view the contents of the columns containing the number of times an index was advised along with the last time the index was advised. Quite often, these are the columns that you want to sort on to help identify the indexes that may have the most impact on your system.
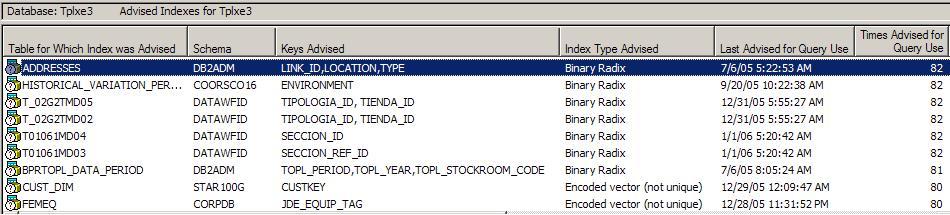
Figure 7: Here's your output.
This interface also makes it easy to create the recommended index. Simply right-click on an index to create it. However, it is not considered best practice to just blindly create the advised indexes from this interface because the SQE and CQE index advisors make several assumptions about your queries and database that may or may not be true. In addition, the index advisors do not have the ability to analyze the entire query. Another advantage of having more queries processed by SQE is that the index advice provided by SQE is much more robust than that provided by CQE.
The query optimizer will never understand your data and queries as well as you. Utilize the index advice as a guide to performance tuning, but always validate the index advice before acting on it. An excellent resource for validating index advice is the Indexing Strategy white paper for DB2 for i. This paper offers an in-depth review of the idiosyncrasies of the generated index advice; it also details the attributes of the ideal indexes to create.
Tip #6: Evaluate Index Usage
The Index Evaluator tool provides usage information on all of the indexes that are available for the query optimizer to use. This usage information helps you identify which indexes you should keep around and which indexes you should consider deleting to reduce the index maintenance overhead on your system. The list of indexes of course includes those index objects created with SQL along with the indexes supporting primary key constraints, unique constraints, foreign key constraints, keyed logical files, and keyed physical files.
The Index Evaluator is launched by right-clicking on a table object and selecting the Show Indexes task, which will produce the output shown in Figure 8.
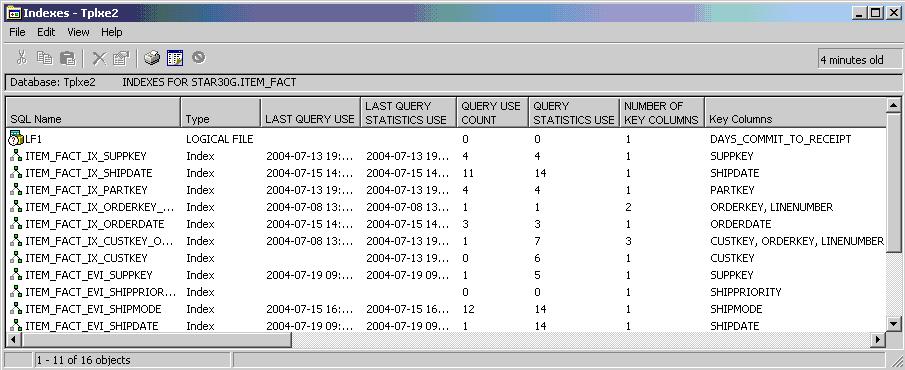
Figure 8: The Index Evaluator provides information that can help you decide which indexes to keep and which to delete.
The window in Figure 8 has been customized to move the query usage columns to the front of the window. Normally, a user must scroll to the right to access the query usage columns for an index. The first two columns contain the index name and type (whether the index was provided by an SQL index, a keyed logical file, etc). The next four columns contain the data that will help you determine the value of an index from a query optimizer perspective. The Last Query Use and Last Query Statistics Use columns contain the timestamp value of the last time an index object was used by the optimizer for statistics or execution of a query. Correspondingly, the Query Use Count and Query Statistics Use columns tell you how often the index was used for one of these purposes. These usage metrics are not returned by the Display File Description (DSPFD) command.
Before getting too carried away with deleting indexes with low usage counts to improve performance, please review how often some of your reports are run. An index that is used to speed the performance of a quarterly financial report will have lower usage counts than indexes used in the query implementation of daily repots.
Tip #7: Check the Optimization Goal
While there are no settings that allow you to directly control the behavior of the query optimizer, there are several settings that enable you to influence the query optimizer. These settings allow you to provide information to the optimizer about the environment and application usage. Optimization Goal is one of those settings that you can control to impact SQL performance. The Optimization Goal value provides the DB2 for i query optimizer with information on how a result set is going to be consumed. The values for the Optimization Goal are *FIRSTIO and *ALLIO.
Let's apply these settings to a query that returns 1,000 rows. An optimization goal setting of *FIRSTIO tells the optimizer to use a query plan that will return the first set of rows (e.g., 20 rows) out of a 1,000 row result set back to the application as fast as possible because it is an interactive application where the user is waiting to see some results. The *FIRSTIO setting usually results in the optimizer avoiding the usage of access methods that copy data into temporary data structures like a hash table. Copying data into a temporary structure means that no results can be returned to the application until after the copy is completed.
The *ALLIO value directs the optimizer to use a set of methods in the query plan that will return all 1,000 rows back to the application as fast as possible. This setting is usually more suited to batch workloads, where there is no interactive response time goals that need to be met; instead, it just processes the data with the method that processes the entire result set as quick as possible. Using the setting of *ALLIO tells the optimizers that it is OK to use access methods that make copies if that's the fastest way to return all 1,000 rows in the result set.
Here's a real-world analogy to help you better understand the Optimization Goal setting. You are asked to paint the exterior of a house, and the available methods are a paint brush or a paint sprayer. It is easy to see that the paint sprayer method is the fastest method to paint the entire house exterior (i.e., *ALLIO). However, would your choice change if you were told to only paint a three-foot square on the house? Yes, just a couple of dips of the brush into the paint can and the square is done. The paint brush method (i.e., *FIRSTIO) can be used to complete the task before a person with the paint sprayer can even get the sprayer filled with paint. The brush method startup costs are much lower than the paint sprayer method. Depending on the overall goal, the startup overhead either helps or hurts the overall performance.
Again, the Visual Explain and SQL Performance Monitor tools are the best to use to determine which optimization goal setting was applied to the execution of an SQL statement. The default setting for the majority of the dynamic SQL interfaces (ODBC, JDBC, etc.) is *FIRSTIO while the default setting is *ALLIO for static SQL requests and those applications using the Extended Dynamic connection property.
There are several ways to control the Optimization Goal setting. One method is to use the QAQQINI option named OPTIMIZATION_GOAL. Another technique is to use the connection property that's available with the ODBC, ADO. NET, and JDBC middleware products that are included with IBM i operating system. The Optimization Goal value can also be controlled at the SQL statement level using the OPTIMIZE FOR n ROWS clause. A low value for n will result in the *FIRSTIO value being used while a high value for n such as the ALL clause will cause the usage of the *ALLIO value.
Get Your System Humming!
As you can see, IBM has provided a variety of ways to improve the performance of SQL requests and queries running on DB2 for i. Now, it's up to you to take advantage of them. Your management and users will thank you for it!
as/400, os/400, iseries, system i, i5/os, ibm i, power systems, 6.1, 7.1, V7, V6R1


 More than ever, there is a demand for IT to deliver innovation. Your IBM i has been an essential part of your business operations for years. However, your organization may struggle to maintain the current system and implement new projects. The thousands of customers we've worked with and surveyed state that expectations regarding the digital footprint and vision of the company are not aligned with the current IT environment.
 TRY the one package that solves all your document design and printing challenges on all your platforms. Produce bar code labels, electronic forms, ad hoc reports, and RFID tags – without programming! MarkMagic is the only document design and print solution that combines report writing, WYSIWYG label and forms design, and conditional printing in one integrated product. Make sure your data survives when catastrophe hits. Request your trial now! Request Now.
 Forms of ransomware has been around for over 30 years, and with more and more organizations suffering attacks each year, it continues to endure. What has made ransomware such a durable threat and what is the best way to combat it? In order to prevent ransomware, organizations must first understand how it works.
 Disaster protection is vital to every business. Yet, it often consists of patched together procedures that are prone to error. From automatic backups to data encryption to media management, Robot automates the routine (yet often complex) tasks of iSeries backup and recovery, saving you time and money and making the process safer and more reliable. Automate your backups with the Robot Backup and Recovery Solution. Key features include:
 Business users want new applications now. Market and regulatory pressures require faster application updates and delivery into production. Your IBM i developers may be approaching retirement, and you see no sure way to fill their positions with experienced developers. In addition, you may be caught between maintaining your existing applications and the uncertainty of moving to something new.
 IT managers hoping to find new IBM i talent are discovering that the pool of experienced RPG programmers and operators or administrators with intimate knowledge of the operating system and the applications that run on it is small. This begs the question: How will you manage the platform that supports such a big part of your business? This guide offers strategies and software suggestions to help you plan IT staffing and resources and smooth the transition after your AS/400 talent retires. Read on to learn:
LATEST COMMENTS
MC Press Online