


Did you know DB2 Web Query can send reports directly to Excel spreadsheets? Learn some tips that will help you easily and quickly build Excel spreadsheets.
In my previous article in this series, TechTip: DB2 Web Query and Excel Spreadsheets: Easy as Pie! Part II, I showed you some DB2 Web Query techniques that generated multiple worksheets within an Excel spreadsheet. In this article, we continue the discussion on combining these two technologies by focusing on two special Excel output format options: Excel with formulas and pivot tables.
Excel with Formulas
If you have any experience working with Excel spreadsheets, you probably have written some cell formulas to perform calculations based on the values in other cells. This is very useful when the values of those referenced cells are changed. For example, if you have cell C3 that calculates profit margin based on cell C1 that contains revenue and a third cell C2 that contains cost of goods sold, profit margin will be recalculated if the spreadsheet user changes the value for either revenue or cost of goods sold. Had the profit margin cell contained a value rather than a formula, it would not have this dynamic capability. If a user changed the value of the other cells, a hard-coded value for profit margin would obviously be incorrect.
This is a very simple, yet important feature of Excel, and DB2 Web Query can take advantage of it. For example, you may have reports that contain subtotals that are calculated at various "break levels" (whenever the report reaches the end of a Sort By value). These subtotal cells are calculated and, as such, are natural candidates for formula-based cells. Grand totals that appear at the end of the report also fall into this category. And don't forget about computed fields like profit margin, cost ratio, and returns percentages; these are fields that typically aren't stored in your database and often need to be calculated on the fly. Cell formulas are the way to go here, particularly if your Excel users intend to make any changes to the cell values in the spreadsheet. Turning on this feature in DB2 Web Query is quite easy. Simply select the Excel output format option titled Excel Formula as demonstrated in Figure 1.
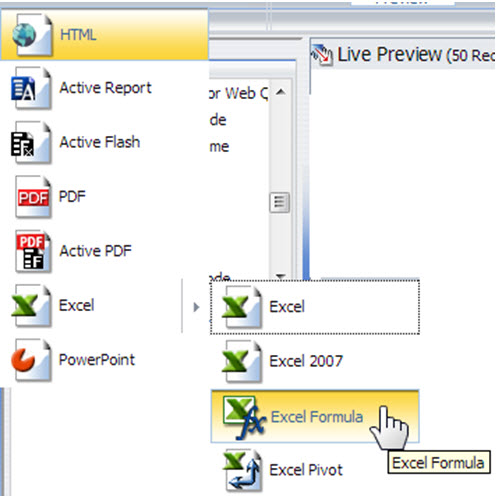
Figure 1: Select Excel Formula.
Here are a couple of considerations when determining which Excel output format option to select:
- The other Excel formats (Excel, Excel 2007, and Excel Pivot) do not generate forumulas. Cells containing computed fields, subtotals, and grand totals contain values that are resolved at report execution time.
- Excel Formula will generate a .xls (Excel 2000) file.
In my example report, I'm sorting by the fields Country, Region, and Store Name. For my Sum fields, I specified Quantity and Returns. I also have a computed field named ReturnsPct that calculates the rate of product returns for each Sort By field. The defintion of this computed field is shown in Figure 2.
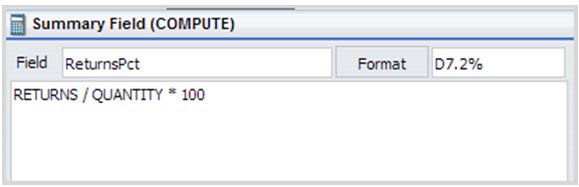
Figure 2: Here's an example of a computed field.
At this point, my report definition looks like the example provided in Figure 3.
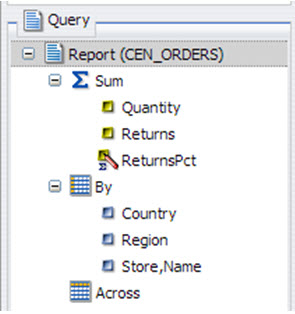
Figure 3: This example shows the report definition.
Finally, I would like to break on the Region report column and calculate subtotals. Figure 4 shows how to activate column subtotaling by right-clicking on the Region column.
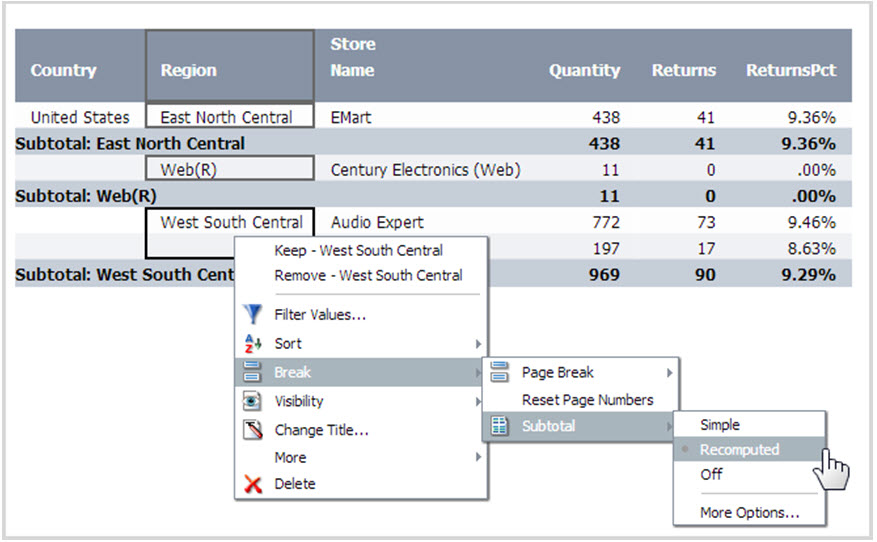
Figure 4: Set up column subtotals.
When this report is run, the Excel spreadsheet is opened as shown in Figure 5.
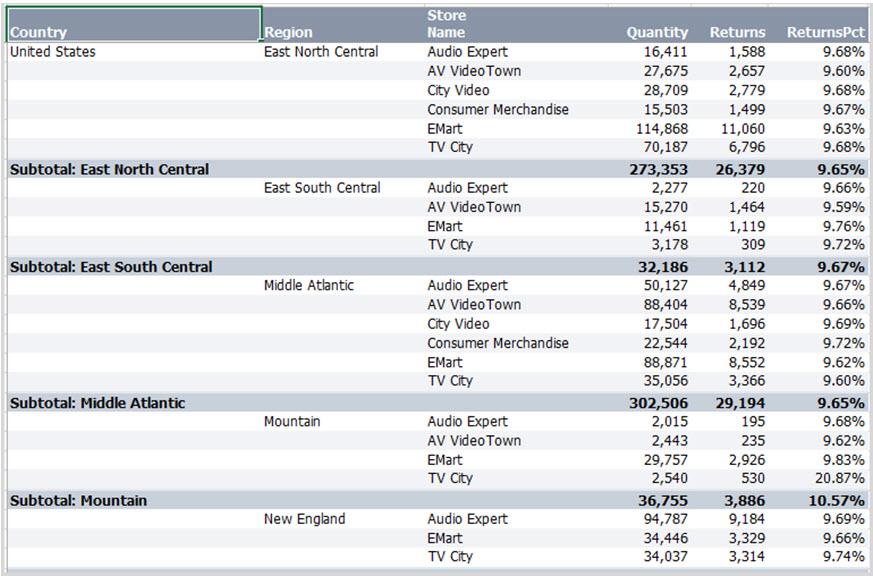
Figure 5: The report results go directly to Excel.
The report looks good, but how do I know if formulas were generated for my computed field (ReturnsPct) cells and the cells that contain subtotals? There's an easy Excel trick to verify this. Simply hold down the Ctrl key and press the tilde (~) key on the keyboard to display cell formulas instead of the actual values.
Notice in Figure 6 that the subtotal cells are based on a SUM formula for that column and that the ReturnsPct is based on a formula that matches the computed field definition. ReturnsPct is also calculated at the subtotal level by applying that same formula to the other subtotal values!
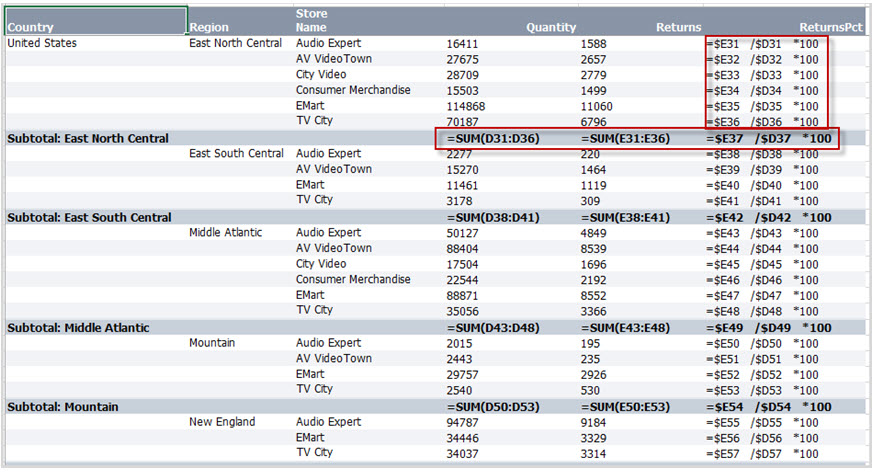
Figure 6: Show the formulas.
Now if an analyst runs this report and changes values to perform some "what if" scenarios, the values for subtotals, grand totals, and ReturnsPct will be calcualted dynamically and will remain accurate!
Pivot Tables
A very powerful feature in Excel is the pivot table. If you're unfamiliar with pivot tables, I strongly encourage you to give them a try! They provide an interactive "drag and drop" interface for summarizing and analyzing a large amount of data. Within this interface, you can analyze, sort, filter, compare, and discover trends in your data. You can pivot (or "transpose") the data very easily and quickly. This in effect moves rows to columns (or vice versa). And because the report has already been run and the data has been downloaded to the spreadsheet, the performance is quite impressive. Heck, it almost makes analyzing your data a fun task instead of a chore!
There are many online resources for learning about pivot tables and how to create and use them (just use your favorite search engine), so I'm just going to focus on how you can create DB2 Web Query reports and send the data directly into a pivot table.
When you create a report in DB2 Web Query, the default behavior is to summarize the data. This means that the data will be aggregated (grouped) on the Sort By fields that you specify. Because Pivot Tables summarize the data in the spreadsheet, I actually do not want DB2 Web Query to perform the summarization. Instead, I want to create a detail report where a row is included for each row that's retrieved from the database. To change the report from a Sum to a Print report, simply right-click on the Sum line and change it to Print as shown in Figure 7.
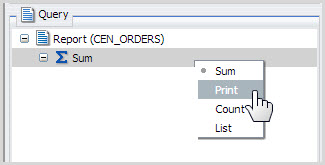
Figure 7: Change Sum to Print.
In my example report, I include several measure fields and sort by Product Type, Product Category, and Product Name. I specified Country as a sort across field. The definition is shown in Figure 8.
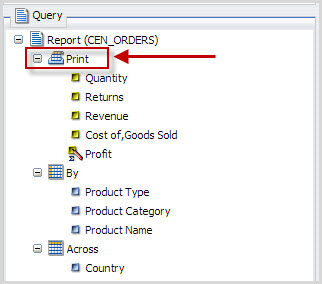
Figure 8: This is the report definition for my pivot table.
Just as with Excel Formulas, sending your output to a pivot table is a breeze. Simply select the Excel output format option titled Excel Pivot as demonstrated in Figure 9.
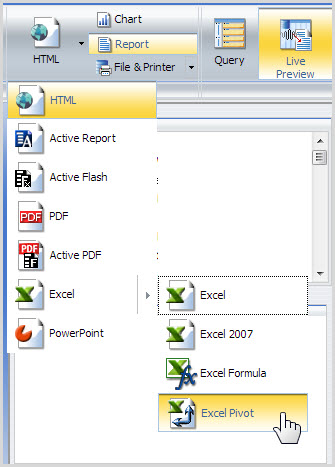
Figure 9: Make it an Excel pivot table!
When the report runs, the output is opened in Excel. Notice in my example in Figure 10 how the data is summarized. Also notice the interfaces and tools; they provide multiple ways to manipulate the report to perform thorough analysis of the data.
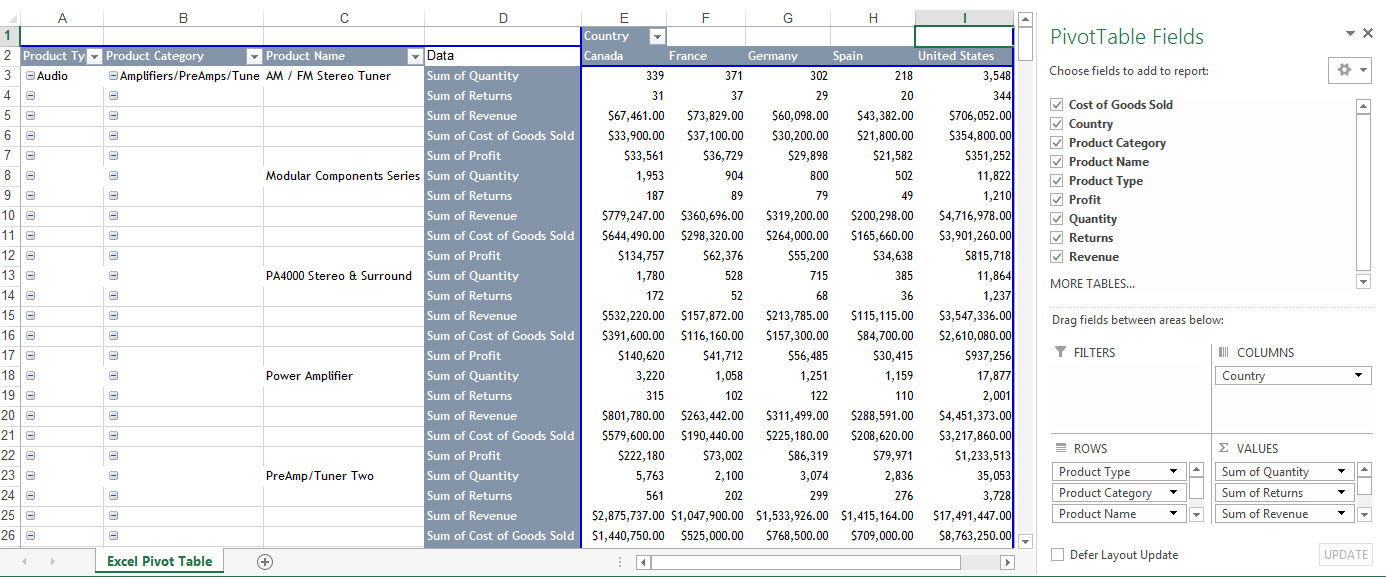
Figure 10: Here's the Excel pivot table output.
Again, if you haven't done so already, I recommend doing some research and familiarizing yourself with all the features and benefits of Excel pivot tables. Once you get the hang of it, you just might find yourself spending hours doing data analysis!
Summary
In this article, I talked about a couple of additional DB2 Web Query output options to Excel. In my final article in this series, I'll introduce you to the DB2 Web Query Spreadsheet Client, an Excel add-in that lets you create or run DB2 Web Query reports from within the Excel framework. This allows you to leverage and reuse your existing spreadsheets and templates, and pull data down into them using DB2 Web Query—something you might find very useful!


 More than ever, there is a demand for IT to deliver innovation. Your IBM i has been an essential part of your business operations for years. However, your organization may struggle to maintain the current system and implement new projects. The thousands of customers we've worked with and surveyed state that expectations regarding the digital footprint and vision of the company are not aligned with the current IT environment.
 TRY the one package that solves all your document design and printing challenges on all your platforms. Produce bar code labels, electronic forms, ad hoc reports, and RFID tags – without programming! MarkMagic is the only document design and print solution that combines report writing, WYSIWYG label and forms design, and conditional printing in one integrated product. Make sure your data survives when catastrophe hits. Request your trial now! Request Now.
 Forms of ransomware has been around for over 30 years, and with more and more organizations suffering attacks each year, it continues to endure. What has made ransomware such a durable threat and what is the best way to combat it? In order to prevent ransomware, organizations must first understand how it works.
 Disaster protection is vital to every business. Yet, it often consists of patched together procedures that are prone to error. From automatic backups to data encryption to media management, Robot automates the routine (yet often complex) tasks of iSeries backup and recovery, saving you time and money and making the process safer and more reliable. Automate your backups with the Robot Backup and Recovery Solution. Key features include:
 Business users want new applications now. Market and regulatory pressures require faster application updates and delivery into production. Your IBM i developers may be approaching retirement, and you see no sure way to fill their positions with experienced developers. In addition, you may be caught between maintaining your existing applications and the uncertainty of moving to something new.
 IT managers hoping to find new IBM i talent are discovering that the pool of experienced RPG programmers and operators or administrators with intimate knowledge of the operating system and the applications that run on it is small. This begs the question: How will you manage the platform that supports such a big part of your business? This guide offers strategies and software suggestions to help you plan IT staffing and resources and smooth the transition after your AS/400 talent retires. Read on to learn:
LATEST COMMENTS
MC Press Online