


Jump-start your BI analytics by generating an automatic suite of dashboards and reports—over your data—with a few clicks of the mouse!
IBM recently delivered a new Wizard Analytics feature within DB2 Web Query. It allows individuals to automatically generate an impressive suite of reports and dashboards against their DB2, spreadsheet, or delimited flat file data in a few minutes and with only a few clicks of the mouse.
The feature consists of two wizards. The Upload Wizard, highlighted in TechTip: Wizard Analytics on DB2 Web Query, Part 1, guides users though the process of uploading data from Excel spreadsheets or delimited flat files, creating descriptive metadata over the data and then automatically creating a set of reports over the data. The Metadata Wizard, featured in this Part 2 article, connects instead to existing DB2 data sources or, if you have Web Query Standard Edition, to a Microsoft SQL Server. The DB2 connection can be local on the IBM i or can be remote to any DB2 family member on IBM i, DB2 for Linux/UNIX/Windows (LUW), or z/OS.
The Metadata Wizard
To launch the Metadata Wizard from the Web Query BI portal, create a top-level folder to store the reports (or choose an existing one). Right-click it, select Metadata, and then select Wizard, as shown in Figure 1.
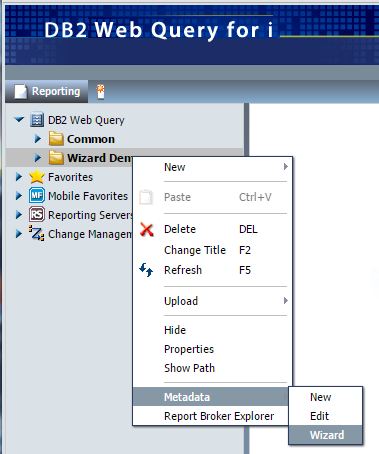
Figure 1: Launch the Metadata Wizard from the Web Query BI portal.
The Metadata Wizard guides you through four simple steps:
- Add a connection for access to your data source if you don't already have one.
- Specify what relational tables or objects you want to build the reports over.
- Indicate how the tables relate to each other in terms of joins.
- Optionally, change any assumptions the Wizard makes about your data relationships.
The steps are described in more detail below.
Step 1: Connect to SQL
When you launch the Wizard, the first step, Connect to SQL, is highlighted on the ribbon, as in Figure 2.
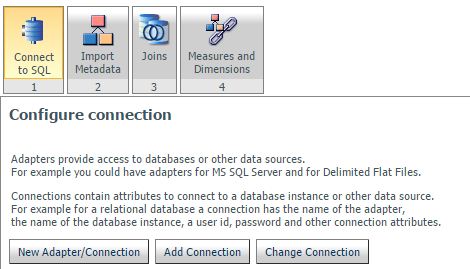
Figure 2: The first step is to ensure a connection exists to the data.
Here you can configure a connection to your data source. If the data resides in the local DB2 database or on a remote DB2 or Microsoft SQL Server connection already configured to Web Query, click Step 2 to skip this step.
Step 2: Import Metadata
Metadata is a very important concept in BI analytics. It is data about data…a descriptive layer that facilitates manipulation, use, and understanding of the data by report writers and end consumers of the data. In DB2 Web Query, metadata is contained within "synonyms."
In this step, you will first select the connection to use to access your data. In Figure 3, the default local DB2 CLI connection is chosen and is in most cases the one you'll use. This represents the DB2 database in the same server or LPAR where DB2 Web Query is running.
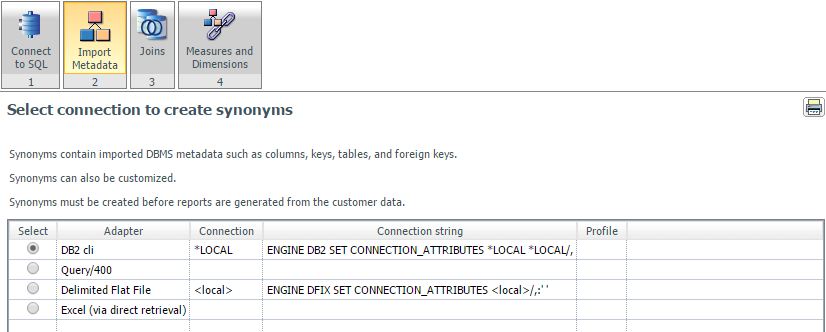
Figure 3: Select the connection to your data source.
You can then select which relational database objects you want to create the metadata (and ultimately the reports) over. The Wizard will present you with a list of candidate objects to choose from, but the dialog in Figure 4 allows you to optionally narrow the list to a particular object type, library, or object name.
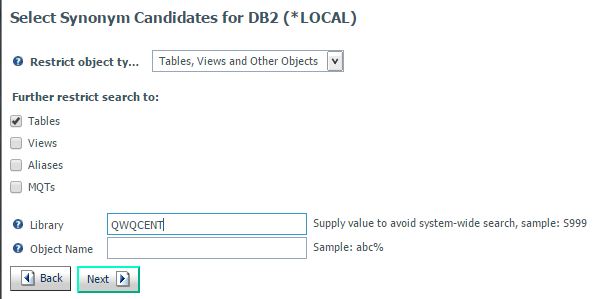
Figure 4: In this example, objects are restricted to tables in the Web Query sample library, QWQCENT.
When you click Next, you will see the final list of database objects to choose from. The Wizard will build metadata for you based on what you select. Note the parameter "Application": metadata is stored in an Application Folder. Normally, you will take the default, which is the same name as the top-level folder you created, but you have the opportunity to change this. You might also consider a suffix or prefix for the synonym name to easily identify it later amongst a larger list of synonyms. Click Next again to create the synonyms.
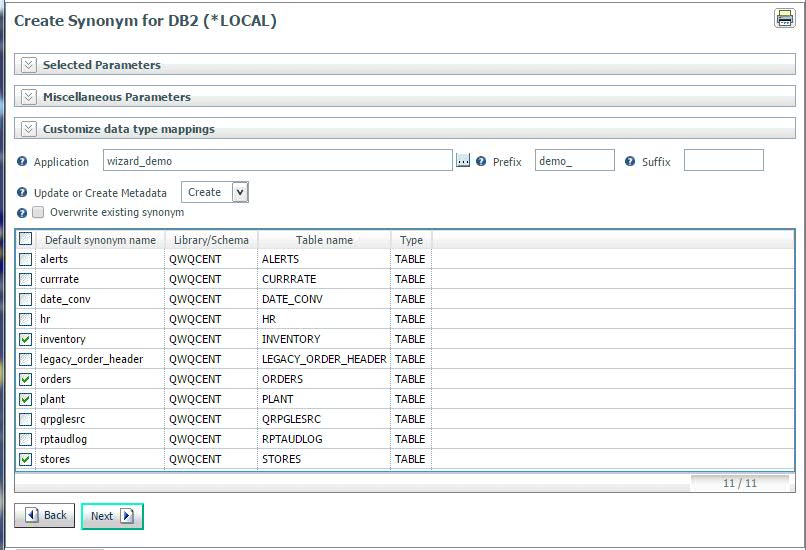
Figure 5: Create the synonyms.
A status screen notifies you when the synonyms are successfully created. Click Next.
Step 3: Joins
In this step, you can specify how the objects relate to each other in terms of joins or clusters. The terminology used here is one common in relational data modeling for multi-dimensional business intelligence. But for now, think of a Fact Table as your primary table that joins in other tables. The wizard is just building metadata over existing database structures. The dialog in Figure 6 allows you to select a Fact Table.
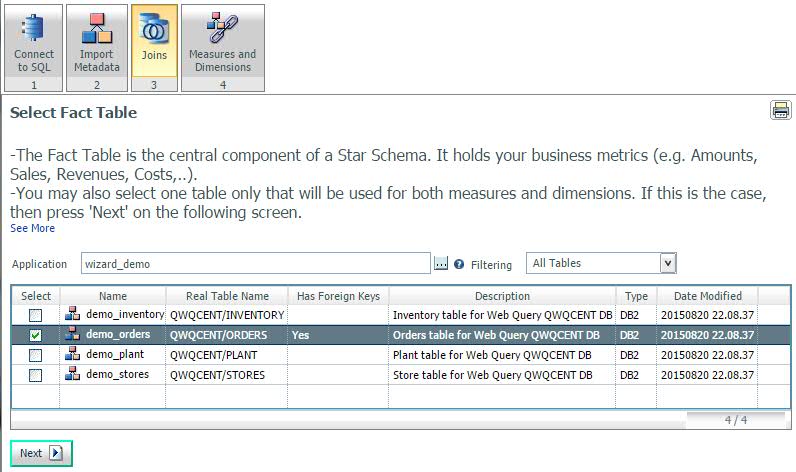
Figure 6: The Orders table is selected as the Fact Table.
And the dialog in Figure 7 allows you to select dimension tables or secondary tables that you want to join to the Fact Table. Make your selection and click Next.
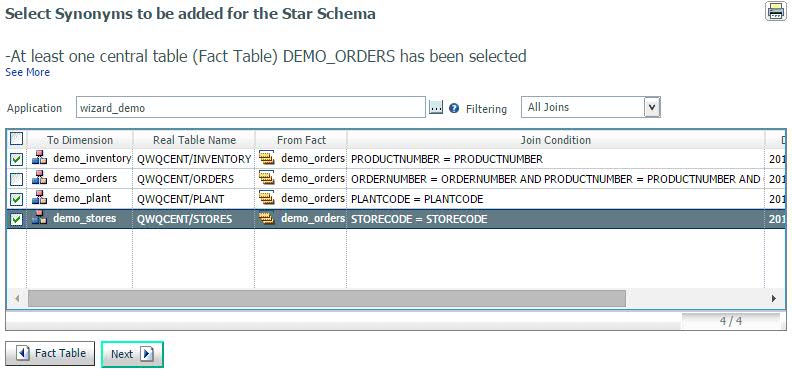
Figure 7: The Inventory, Plant, and Stores tables are joined to the Orders table.
Step 4: Measures and Dimensions
Before the wizard creates the reports, it gives you the opportunity to review the metadata definitions it created (based on assumptions it made) and make any desired changes.
A measure is a field upon which calculations can be done, such as sum, count, or average. Example measures are Quantity and Revenue. The wizard assumes all numeric fields are measures. If your data has numeric fields that aren't measures, such as Customer Number or Order Number, you can drag them into Dimensions. Figure 8 shows an example screen.
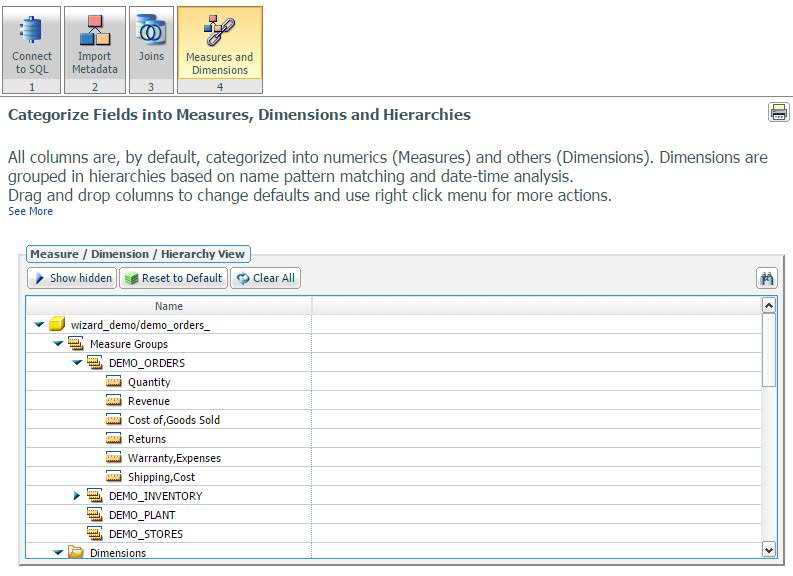
Figure 8: Metadata in the Orders tables is organized into Measures and Dimensions.
Dimensions are non-measures, such as persons, places, things, or times. They are often organized into hierarchies, which are important to BI analytics for both performance and usability. Hierarchies provide relationships that are leveraged in auto drill-down or slicer reports, or with chained parameters.
If the data contains geographic fields like country, region, state, and city, the wizard will automatically create a hierarchy where country drills down to region, which drills down to state, which drills down to city. If the order isn't correct for your business, you can reorder it. You can also rename a hierarchy or create a new one.
If the data contains a date field, two hierarchies are automatically created to decompose the date:
- A simple hierarchy breaks the date into year, quarter, month, and day.
- A compound hierarchy combines year, year-quarter, year-month, and month-day-year.
Figure 9 shows the two categories.
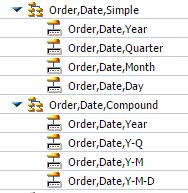
Figure 9: The order date is decomposed into virtual fields.
Before the Wizard generates the reports, you must save the synonyms. In Figure 10, the "_cls" in the file name indicates there is a cluster join.
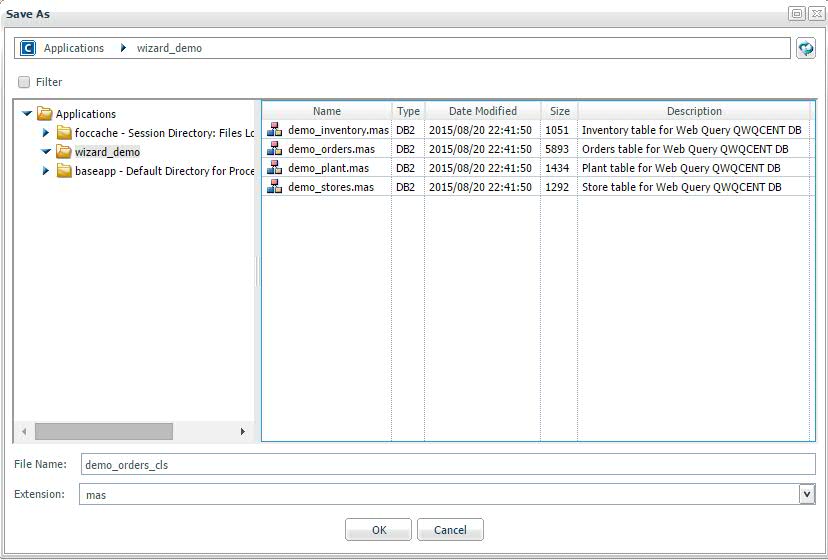
Figure 10: On this screen, you will save the synonyms.
Voila! The Reports
When you save the synonyms, the Express Analytics Generator goes into action and builds a suite of 20 to 40 reports, charts, and dashboards. Figure 11 shows a sample dashboard created by the Wizard that consists of three charts and an Active Report. The dashboard features the latest capabilities of HTML5 with animation and eye-catching effects. On the left, in the portal tree, you can see all the reports that were automatically created into subfolders of the top-level folder you started with.
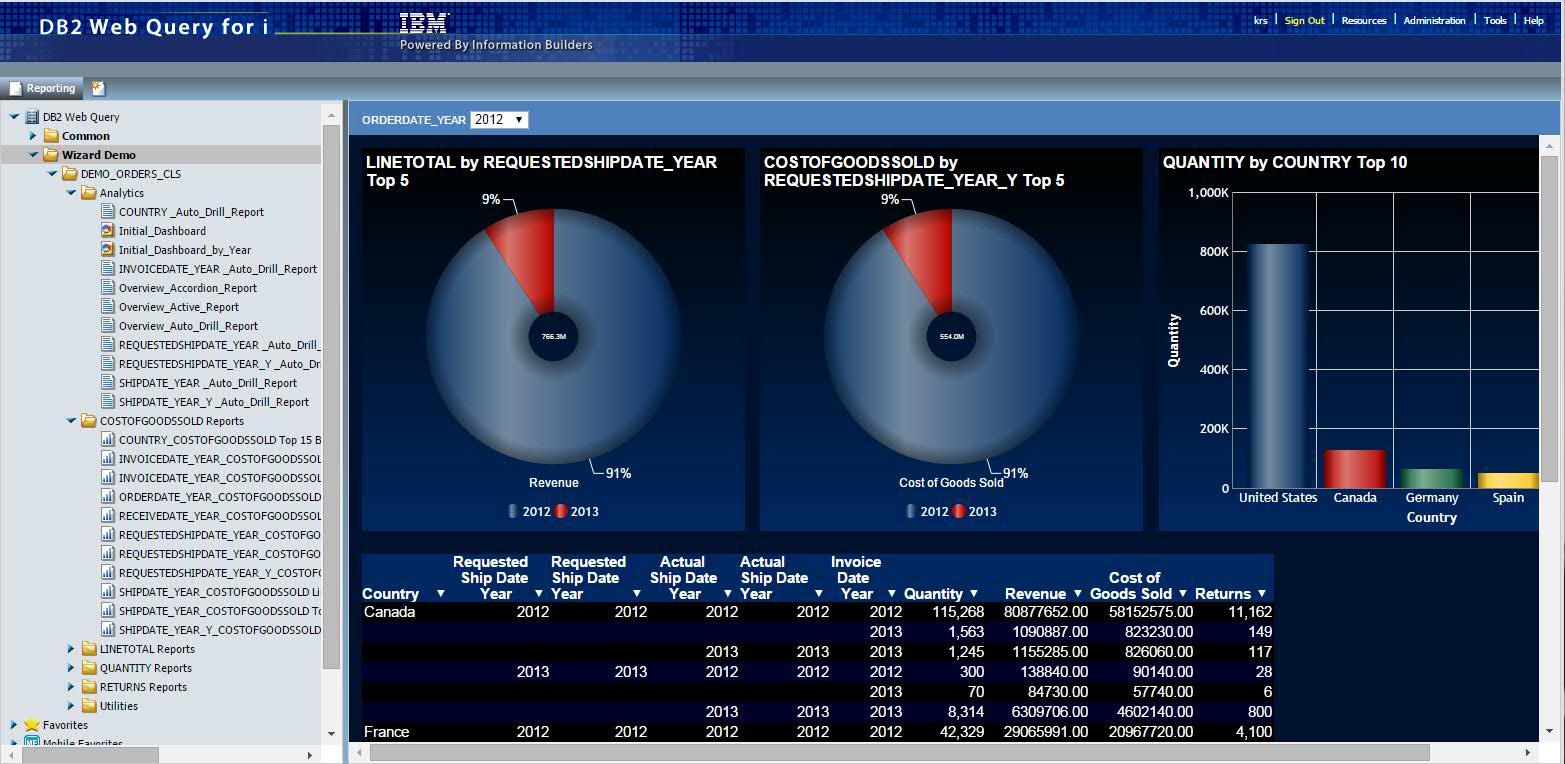
Figure 11: This initial dashboard by Year was generated by the Metadata Wizard.
The generated reports can be deployed in many ways; schedule them and send them to dynamic distribution lists, provide custom application websites for end users to run them, or synch them with mobile devices. The reports provide a jump start into Web Query. Use them as is or use them—or the underlying metadata—as a base for building advanced, customized reporting.
Part 1 of this TechTip describes the reports, as well as the Upload Wizard, in more detail. Both wizards are available in the recently released Web Query 2.1.1 (and in 2.1.0 group PTF level 10 or later). To learn more, see the Wizard videos on the Web Query wiki.


 More than ever, there is a demand for IT to deliver innovation. Your IBM i has been an essential part of your business operations for years. However, your organization may struggle to maintain the current system and implement new projects. The thousands of customers we've worked with and surveyed state that expectations regarding the digital footprint and vision of the company are not aligned with the current IT environment.
 TRY the one package that solves all your document design and printing challenges on all your platforms. Produce bar code labels, electronic forms, ad hoc reports, and RFID tags – without programming! MarkMagic is the only document design and print solution that combines report writing, WYSIWYG label and forms design, and conditional printing in one integrated product. Make sure your data survives when catastrophe hits. Request your trial now! Request Now.
 Forms of ransomware has been around for over 30 years, and with more and more organizations suffering attacks each year, it continues to endure. What has made ransomware such a durable threat and what is the best way to combat it? In order to prevent ransomware, organizations must first understand how it works.
 Disaster protection is vital to every business. Yet, it often consists of patched together procedures that are prone to error. From automatic backups to data encryption to media management, Robot automates the routine (yet often complex) tasks of iSeries backup and recovery, saving you time and money and making the process safer and more reliable. Automate your backups with the Robot Backup and Recovery Solution. Key features include:
 Business users want new applications now. Market and regulatory pressures require faster application updates and delivery into production. Your IBM i developers may be approaching retirement, and you see no sure way to fill their positions with experienced developers. In addition, you may be caught between maintaining your existing applications and the uncertainty of moving to something new.
 IT managers hoping to find new IBM i talent are discovering that the pool of experienced RPG programmers and operators or administrators with intimate knowledge of the operating system and the applications that run on it is small. This begs the question: How will you manage the platform that supports such a big part of your business? This guide offers strategies and software suggestions to help you plan IT staffing and resources and smooth the transition after your AS/400 talent retires. Read on to learn:
LATEST COMMENTS
MC Press Online