


You may already know how easy it is to create a Web page that accesses data on the iSeries. When your application is created using Active Server Pages (ASPs), this ability is enhanced by the ability to use ActiveX controls within your ASP. A great example of this is to use the charting object included with the Microsoft Office Web Components (OWC) to create a chart or graph from your iSeries data within a Web page. In this article, you'll explore using OWC charts within an ASP.
Software Requirements and Setup
To use the examples within this article, you'll need a Windows server running Microsoft Internet Information Services (IIS). In addition, you'll have to install OWC on the Web server. If you have Microsoft Office, you can install this from the Office Setup CD, or you can download OWC from the Microsoft Web site. Once you've installed OWC on your IIS server, you're ready to go.
OWC Chart Object Model
The OWC Chart component is a simple ActiveX control that allows you to create a graph or chart. If you're familiar with creating graphs and charts in Microsoft Excel or any other spreadsheet package, the concept behind the OWC chart object won't be too foreign to you. Figure 1 shows a graphic representation of the OWC chart object model.
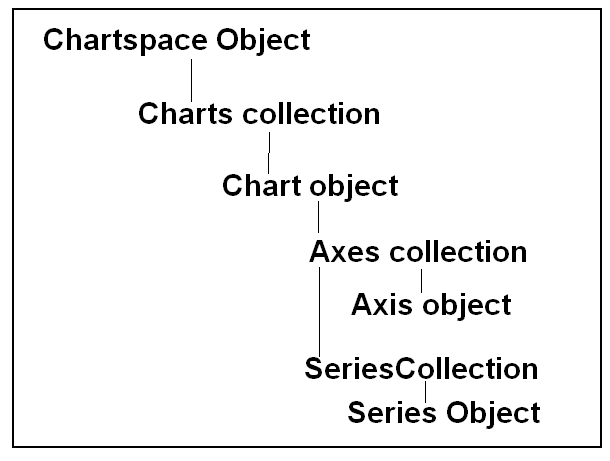
Figure 1: The OWC Chart component allows you to create a chart. This is the OWC Chart object model. (Click images to enlarge.)
As this figure shows, the base component used for creating a chart is the Chartspace object. One Chartspace object can contain multiple Chart objects within a Charts collection. The Chart object's data is supplied through the Axis and Series objects. Figure 2 shows a sample of what the Axes and Series represent within your data.
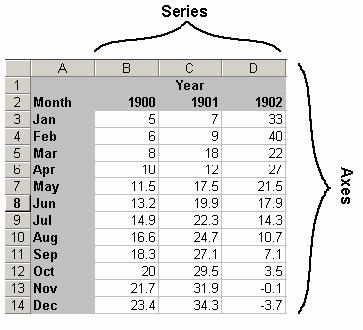
Figure 2: This example illustrates what the Axes and Series represent within your data.
In this example, Series represents the number of columns within your data. Axes represents the rows within each column. In the example above, 1900, 1901, and 1902 represent the three items within the Series collection. The months and their corresponding values represent the Axes within the object.
Creating Charts Server-Side
When using the OWC Chart component, you have the option of creating the chart on the Web server or within the client browser. There are pros and cons to each of these. If you create the chart server-side, you need to have the OWC component installed only on the Web server, not on each client PC that accesses the page. On the other hand, a client-side chart can be changed dynamically through client-side VB Script or JavaScript code. One main difference between the two techniques is that, while the client-side technique loads an ActiveX control into the browser window, the server-side technique simply displays the chart as an image file. For the examples in this article, I'll be focusing on the server-side technique. For more information on the client-side technique, see the book Active Server Pages Primer from MC Press.
Using the Sample Application
Before you get to the actual code for this example, you'll need to go into the root HTTP folder on your IIS server (usually, this will be c:inetpubwwwroot) and create a subfolder named ASPChart. You'll use this folder to store your source code and the temporary image files that will contain your charts. Figure 3 contains the source for the file "global.asa." Place it in the folder you just created.
|
Figure 3: This is the code for the file global.asa.
This file is used to create script source to be executed whenever the page loads. The example here contains two VBScript functions: Session_Onstart, which is executed each time a user creates a new session by logging into any Web page in this folder, and Session_OnEnd, which is run when a user ends a session by closing the browser or navigating away from the Web site.
This file can also contain Application_OnStart, which is executed the first time a user accesses the page and each time the IIS server is restarted, and Application_OnEnd , which occurs when the IIS server is ended.
Within your OnStart event, you need to do several things. First, create a Session variable that contains a Scripting.Filesystemobject ActiveX control, which can be used to manipulate files on the Web server. A Session variable can be accessed anytime throughout a user's "session" as described above, even from a different ASP. Next, create a second session variable, which will act as a simple counter to be used later. Finally, set the session timeout to one minute. This will cause the session to expire if no activity occurs for one minute.
The Session_OnEnd event performs cleanup tasks by using the two session objects created earlier to delete the temporary image files created during the life of the session using the .Deletefile method of the Scripting.Filesystemobject. The parameter supplied points to session variables containing the names of each of the image files created by the application. Figure 4 contains the source for ASPChart.asp, which is responsible for actually creating and displaying the chart.
|
Figure 4: This is an example of how to code an OWC chart.
This sample ASP will chart the top libraries based on number of files per library. The number of libraries displayed is selected using a drop-down box. The type of chart display (pie or bar) is also defined using a drop-down box. The data for this page is read in using an ActiveX Data Object (ADO) connection and recordset. The data is moved from the fields within a record into two arrays. One of these will contain all of the library names from your file. The other one will contain the file counts for each corresponding library.
Load the values into the arrays so that they can be transferred into the chart object. Then, create the reference to the Chartspace and add a new chart to that chartspace. Depending on the value of the drop-down box, your chart will be either a pie chart or a bar chart. Next, add a new Series collection to your chart and define the chart's caption. Define the headings and values using the SetData method of your Series object. Use the constant chDimCategories to identify that you are defining the categories for the report and the constant chDimValues to define the actual chart values themselves. The constant chDataLiteral identifies that the values being passed into the chart are simple data variables. Now, identify whether your chart should display a legend containing the chart colors and associated categories. When that piece is complete, use your Scripting.Filesystemobject so that you can output your next chart as a GIF file. This is done through the ExportPicture method of your Chart object. You also write to a session variable the name of the file containing your new chart so that you can clean it up when the session's ON_END event occurs.
Figure 5 shows a side-by-side example of a bar chart and a pie chart created using this example.
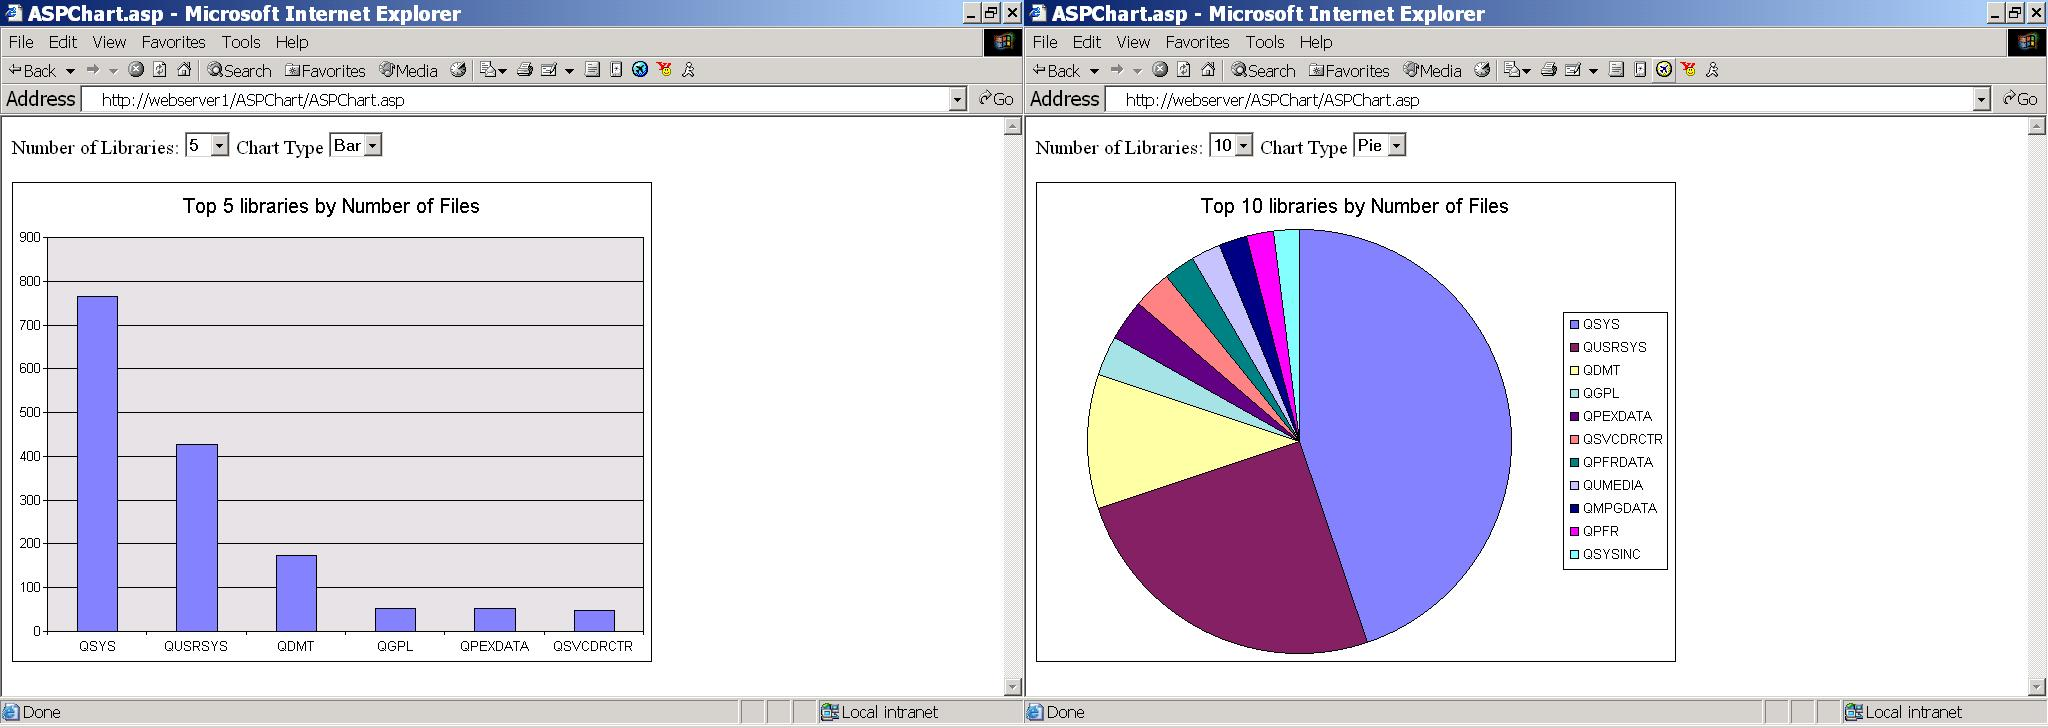
Figure 5: These sample bar and pie charts were created using this example.
This example shows the top 10 libraries expressed as a bar chart and as a pie chart. The nice thing about this specific example is that it is completely browser-independent. Since the graph itself is sent to the browser as a GIF image, there are no special requirements for the client browser--or the operating system, for that matter.
Full Steam Ahead!
The sample ASP application shown here can easily be customized to suit your specific needs. By simply changing the SQL statement used with the ADO recordset, you can modify what data is used for the categories and values for the chart. With a little tweaking, you can allow users to easily generate custom charts, all through a simple browser interface.
Mike Faust is MIS Manager for The Lehigh Group in Macungie, Pennsylvania. Mike is also the author of the books The iSeries and AS/400 Programmer's Guide to Cool Things and Active Server Pages Primer from MC Press. You can contact Mike at

Mike Faust is a senior consultant/analyst for Retail Technologies Corporation in Orlando, Florida. Mike is also the author of the books Active Server Pages Primer, The iSeries and AS/400 Programmer's Guide to Cool Things, JavaScript for the Business Developer, and SQL Built-in Functions and Stored Procedures. You can contact Mike at
MC Press books written by Mike Faust available now on the MC Press Bookstore.
 |
Active Server Pages Primer Learn how to make the most of ASP while creating a fully functional ASP "shopping cart" application. List Price $79.00 Now On Sale
|
|
 |
JavaScript for the Business Developer Learn how JavaScript can help you create dynamic business applications with Web browser interfaces. Now On Sale
|
|
 |
SQL Built-in Functions and Stored Procedures Unleash the full power of SQL with these highly useful tools. Now On Sale
|

 More than ever, there is a demand for IT to deliver innovation. Your IBM i has been an essential part of your business operations for years. However, your organization may struggle to maintain the current system and implement new projects. The thousands of customers we've worked with and surveyed state that expectations regarding the digital footprint and vision of the company are not aligned with the current IT environment.
 TRY the one package that solves all your document design and printing challenges on all your platforms. Produce bar code labels, electronic forms, ad hoc reports, and RFID tags – without programming! MarkMagic is the only document design and print solution that combines report writing, WYSIWYG label and forms design, and conditional printing in one integrated product. Make sure your data survives when catastrophe hits. Request your trial now! Request Now.
 Forms of ransomware has been around for over 30 years, and with more and more organizations suffering attacks each year, it continues to endure. What has made ransomware such a durable threat and what is the best way to combat it? In order to prevent ransomware, organizations must first understand how it works.
 Disaster protection is vital to every business. Yet, it often consists of patched together procedures that are prone to error. From automatic backups to data encryption to media management, Robot automates the routine (yet often complex) tasks of iSeries backup and recovery, saving you time and money and making the process safer and more reliable. Automate your backups with the Robot Backup and Recovery Solution. Key features include:
 Business users want new applications now. Market and regulatory pressures require faster application updates and delivery into production. Your IBM i developers may be approaching retirement, and you see no sure way to fill their positions with experienced developers. In addition, you may be caught between maintaining your existing applications and the uncertainty of moving to something new.
 IT managers hoping to find new IBM i talent are discovering that the pool of experienced RPG programmers and operators or administrators with intimate knowledge of the operating system and the applications that run on it is small. This begs the question: How will you manage the platform that supports such a big part of your business? This guide offers strategies and software suggestions to help you plan IT staffing and resources and smooth the transition after your AS/400 talent retires. Read on to learn:
LATEST COMMENTS
MC Press Online