


So what's behind the flashy paint job of the GUI and graphs? This question has been asked by many customers, both large and small. The attractive screens and cute icons, which are part of the iSeries Navigator interfaces, may be visually pleasing but, like a good paint job, the luster will dull rapidly if you can't get the data you want or need. So forget about the interface and get your hands dirty by digging into collecting system statistics!
Data Is Key
Data is everywhere on the system. The key questions to answer are where to store, what is important, and who uses the system statistic. In V4R4, a new term, "Collection Services," was introduced through iSeries Navigator (formerly, Operations Navigator). Collection Services was built to provide a single collection mechanism to consolidate a wide range of information in the most efficient and flexible way possible. By V5R1, it had been enhanced to the point where it contained a superset of all the information collected by the performance monitor. The result was the withdrawal of the Start Performance Monitor (STRPRFMON) command and convergence to Collection Services as the one way to amass ongoing system statistics.
Ouch! I hear the moans and groans, but change is good! The best way to change is to learn how to use the tool and experience some of the key benefits. First, you must install iSeries Navigator on your PC. If this is new to you, I would suggest visiting the iSeries Navigator Web site for more information about the capabilities. With the software installed on your PC, you are ready to begin.
Open the iSeries Navigator application on your PC, to the point shown in Figure 1, and select Collection Services from the menu in the left pane. Since data has never been collected on this system, the right pane will contain no items in the list. By clicking on the green arrow in the toolbar (leftmost icon), you will get a dialog to start Collection Services. This dialog provides you with all the options available to configure, locations to put the data, rate to collect data, and choices of data to collect. Feel the POWER!
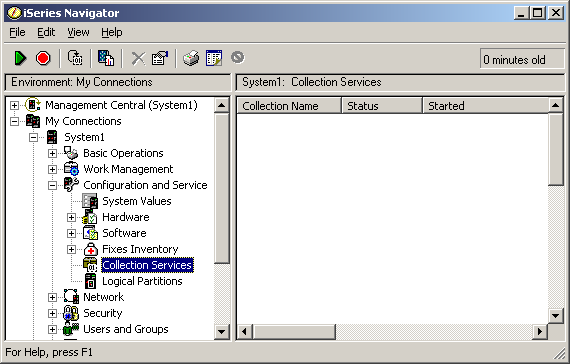
Figure 1: Open Collection Services directly from iSeries Navigator. (Click images to enlarge.)
Where to Put Data
When data is collected, it is placed in management collection objects (*MGTCOL). These objects can be saved and restored just as you would any object on the system. The default library will be set to QPFRDATA. The format of the location may not be what you would normally see when looking at a library, but do not let the file system notation fool you. It is a real object stored in a library, just like a program (*PGM) or command (*CMD) object. To ensure you maintain control of the number of management collection objects created, configure the length of time that data will be collected for each object. This can be done daily by specifying a time. The action of "cycling" will terminate the usage of one management collection object and create a new one for the next time cycle. Once the data is no longer being added to the object, it will have a status of Cycled, as shown in Figure 2.
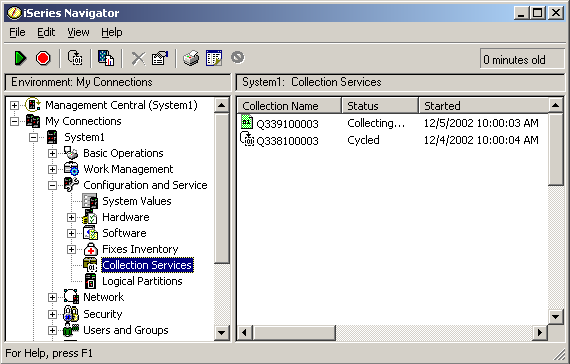
Figure 2: While data is being collected, the status of a management collection object will show as Collecting.... Upon completion, the status changes to Cycled.
Besides detailed management collection objects, there are two additional types of repositories--databases and summarized collections--that check boxes help you to manage. These additional repositories may be required at a later time, depending on the tools you plan on using in the future. By default, the databases used by products such as Performance Tools and Performance Monitor are not generated. If you need them, you can customize the data placed in the databases by using the Create Performance Data (CRTPFRDTA) command or the iSeries Navigator option to generate database files.
The key thing to remember is that generating databases consumes both system processing and storage resources. If you plan to use the iSeries Navigator Graph History option, it is important to leave the Create Graph Data option selected. This provides a condensed version of the detailed data that can be rapidly accessed to display graphs. If you have started Performance Monitor/400, the Summary option can be configured and viewed using iSeries Navigator Graph History for a longer period of time. The length of time to be displayed will be constrained by summarized collections available and time duration selected when showing the graph. Again, the many options can be confusing, so work with the default settings and make modifications over time as you get comfortable with the tools.
The General page, shown in Figure 3, offers simple options to help control two key items: how often to collect data when defaulted and how long to keep the data that's collected. Yes, these too will affect system resources such as storage and processing required for Collection Services. As with other settings, the defaults are a good point of reference for getting started.
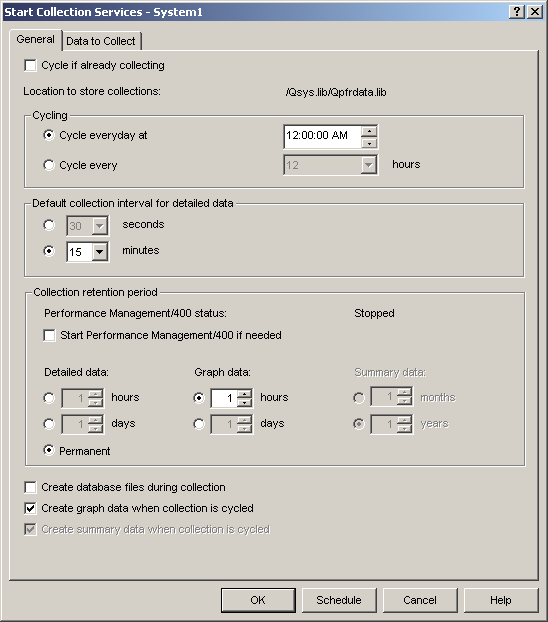
Figure 3: This screen allows you to set how often to collect data and how long to keep it.
Now, you know some of the basics about how to configure where to put data, how to store it, when to get it, and how long to keep it. So let's move on to determining what information on the system is available for you collect!
What to Collect
You can choose what data to collect by using a collection profile. The collection profile can be one provided by IBM or a custom one you define. This is really up to each customer, since needs vary from business to business. If this is not something you feel comfortable with, you may want to consider using the "standard" profile to get started.
If you scroll down the categories to "Collect Table," as shown in Figure 4, you will see a wide range of data to choose from, depending on your needs. The Help button provides detailed descriptions of each category available.
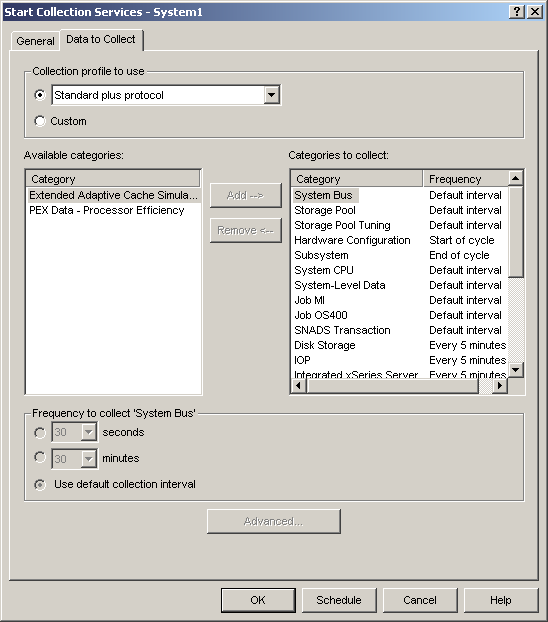
Figure 4: Choose what data to collect.
Once you feel comfortable collecting data, you should also notice that each category can be separately configured to collect data at different intervals. The General page allowed you to set the overall collection interval default value. Typically, the default or profile values give you a general category grouping. However, if you are trying to nail down a problem or reduce data, you may increase or decrease the collection interval, respectively. Flexibility, flexibility, and yet more flexibility! This can be confusing, so start slowly.
Connecting the Components
Now is the time! Press OK and start Collection Services. As the data is being collected, you will see the status of a management collection object as Collecting..., as shown in Figure 2. As the collections cycle, additional objects will be created, and the existing management collection object will go to a status of Cycled. Up to this point, you have used the primary interface to control the data collection process, and though there are many options, it is really a single request that requires only a few clicks of the mouse to get things running.
Now that you have the data, what tool will you use to view or analyze your data? Well, this is when things get a bit more complicated. Collection Services, the single mechanism for collecting system statistics, will be used by other tools to register their requirements for data, including categories, intervals, and retention. Collection Services will adapt its collecting processes to ensure it can satisfy all the requests. For example, if a System Monitor asks for data every minute and Performance Monitor asks for data every 15 minutes, Collection Services will collect the data every minute. As you can guess, the amount of data to be collected can grow faster than expected if you did not understand their relationship, as shown in Figure 5!
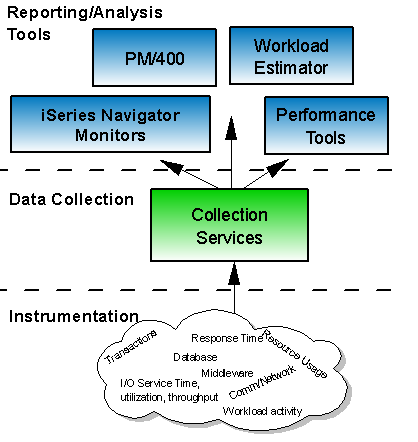
Figure 5: It's important to understand the relationship between the data collection mechanism (Collection Services) and the tool you'll use to view your data.
As the primary methods of controlling the generation of management collection objects, Collection Services or Performance Monitor/400 will produce the same Collecting... status when one is active, as indicated previously. So what's the exception? If other tools are used, such as the System Monitor, the status will differ by indicating Stopped--Collecting For System Only. When you see this status, you should be asking yourself if this data will be useful in the future. If your answer is "yes," then you might reconsider directly configuring Collection Services.
Decisions, Decisions...
Wow! Collection Services offers many options and choices for providing more flexibility for the administrator. Whether you want to control where to store the data, how often to gather the data, or how to categorize the data gathered, there are options available to give you ultimate control. By going through each piece of Collection Services, you now know what is behind the graphs, how to control data collection, and how to tune collecting to get the most information from your system!
Sue Townsend is a Senior Software Engineer at IBM Rochester. Her focus throughout her career with IBM has been on designing and developing system management solutions. Sue can be contacted at


 More than ever, there is a demand for IT to deliver innovation. Your IBM i has been an essential part of your business operations for years. However, your organization may struggle to maintain the current system and implement new projects. The thousands of customers we've worked with and surveyed state that expectations regarding the digital footprint and vision of the company are not aligned with the current IT environment.
 TRY the one package that solves all your document design and printing challenges on all your platforms. Produce bar code labels, electronic forms, ad hoc reports, and RFID tags – without programming! MarkMagic is the only document design and print solution that combines report writing, WYSIWYG label and forms design, and conditional printing in one integrated product. Make sure your data survives when catastrophe hits. Request your trial now! Request Now.
 Forms of ransomware has been around for over 30 years, and with more and more organizations suffering attacks each year, it continues to endure. What has made ransomware such a durable threat and what is the best way to combat it? In order to prevent ransomware, organizations must first understand how it works.
 Disaster protection is vital to every business. Yet, it often consists of patched together procedures that are prone to error. From automatic backups to data encryption to media management, Robot automates the routine (yet often complex) tasks of iSeries backup and recovery, saving you time and money and making the process safer and more reliable. Automate your backups with the Robot Backup and Recovery Solution. Key features include:
 Business users want new applications now. Market and regulatory pressures require faster application updates and delivery into production. Your IBM i developers may be approaching retirement, and you see no sure way to fill their positions with experienced developers. In addition, you may be caught between maintaining your existing applications and the uncertainty of moving to something new.
 IT managers hoping to find new IBM i talent are discovering that the pool of experienced RPG programmers and operators or administrators with intimate knowledge of the operating system and the applications that run on it is small. This begs the question: How will you manage the platform that supports such a big part of your business? This guide offers strategies and software suggestions to help you plan IT staffing and resources and smooth the transition after your AS/400 talent retires. Read on to learn:
LATEST COMMENTS
MC Press Online