


Biting off more than we can chew is something we're all guilty of at times. Take the case of the enthusiastic homeowner who decided to have a go at rewiring his home. Take the case of the gifted amateur sprinter who entered the marathon (he was winning...for a while). Take the case of the busy IT manager who didn't notice that his CPU was at 90% and climbing. Alas, none of these tales has a happy ending. The moral of the story is to know our limits and adhere to the warning signs of stress that tell us we've taken on more than we can handle.
IT managers are required to be aware of the limits of the domains they survey, but luckily for them, technology has replaced the grinding of teeth, the clenching of fists, and the pounding of the chest with an altogether more reasonable solution: the performance monitor. Think of it as a tolerance barometer for your system. Signs of "stress" can be highlighted, recorded for future reference, acknowledged, and resolved before things escalate out of control.
Optimum performance is the state of perfect harmony on the machine, and it underpins many of the broader concepts of high availability and successful systems management. It is the delicate ecosystem of CPU and response time ticking along nicely, the end user community feeling no urge to call you and ask why their PCs are so slow, jobs that are processing on time, applications that are up and running, the gentle hum that is in the air...unmistakably, all is well in iSeries land. The only trouble is, we want this state 24x7. No, we need this 24x7. We demand it! Feel the hum slip away as the phones start ringing off their hooks and the system grinds to a halt. There goes your throbbing jugular....
It may be time to enlist the help of a performance monitor because even the most powerful iSeries has its limits; knowing them, anticipating them, and working with them is the key to maximizing the performance of your machines. The really wonderful part is that a good performance monitor eliminates the guesswork. No need for psychic powers; no need even to ask if something is the matter. This incredible piece of software exists to tell you, in intricate detail, exactly how it's feeling all the time. Sounds a bit like information overload, right? Well that's true; we don't need to know everything all the time, just what's going slightly awry when it happens so we can stop it before it begins to affect performance. Achieving this state introduces a new approach commonly known as a "management by exception" environment and is the first step to utilizing both human and automated resources in a truly proactive manner, the benefits of which quickly add up to more time for your operators and more money saved from your budget.
Of the many competent iSeries performance monitors on the market, CCSS's QSystem Monitor typifies the many aspects of performance that a monitor of this nature will help you control in a typical iSeries environment. Performance is a multi-faceted creature after all, so the more we understand, the better. Most performance monitors will keep a watchful eye on the basics--the usual suspects of CPU, response time, Active to Wait, auxiliary storage, etc. A truly versatile solution will also let you pick and choose other elements to keep a check on--an important job, a key application, or even an entire subsystem. (Figure 1 shows real-time performance monitoring).

Figure 1: Real-time performance monitoring allows you to see what's going on all the time. (Click images to enlarge.)
The flexibility of a versatile performance monitoring solution can reverberate benefits beyond basic system parameters, extending to reassurance of application stability. Operators can use the configurable monitors to be alerted to the status of their TCP servers or listeners. The latter is a program that controls a network port and accepts
incoming connections. It listens for either TCP data (data streams) or UDP data (individual data packets). If the listener becomes inactive, a dedicated text bar on the graphical interface will flash red, immediately alerting operators to the situation. A command can be run to check that the FTP server is running or that the MQSeries server jobs are active. Critical applications running on the iSeries--such as WebSphere, Domino, and MQSeries--or indeed, any application that supports TCP/IP to communicate--can be monitored through the sheer functionality of a performance monitor.
This level of detail becomes the fingerprint of your performance management, the small details that hold particular significance to your network or machine alone. Having these conditions tracked in real-time makes all the difference. The IT manager who has this level of performance tracking and monitoring in place can be congratulated on truly knowing the idiosyncrasies of his system or network. At once, he has elevated the network from a standard, one-solution-fits-all approach to something altogether more sophisticated and unique. His reward will be optimal performance, and on the strength of that, he may go on to achieve the dual goals: successful systems management and high availability.
Having established the areas to monitor, the next task is to assign individual thresholds for each. Thresholds (in conjunction with visual or audible alerts) make the entire philosophy of performance monitoring work. In short, they give a team time to react. Time, that most precious of all resources, will help resolve just about any situation you'll ever encounter on the iSeries. These thresholds act as a bridge between a particular action taking place on the iSeries and a reaction occurring in your end user community. Response time may be creeping up, and in the twilight minutes between the root cause of the problem and the inevitable onslaught from the users, there is time to rectify the situation.
Analyzing system history can help greatly to shape the unique identity and limits of a system's capacity for the future. How did the system react when a new application was loaded last month? What was the impact on users, and can we change or alter the circumstances in future plans to lessen this? Simple capacity planning can be easily calculated in such scenarios so that performance remains optimal at all times. This helps operators to make best use of their time because they don't need to be constantly on red alert for signs of trouble. Rather, they can be assured that when a threshold is breached, they will be notified in time to carry out the correct resolution procedure. In the meantime, their skills are best deployed in technical projects and planning issues.
Functionally rich performance products can help resolve capacity planning issues with capabilities that can include directories as well as native iSeries objects in applications. Users of many PC-based applications, such as PeopleSoft World, as well as Domino and WebSphere, all of which store data in the IFS, can now easily gain a true representation of application size and make accurate predictions for application growth.
Tapping into a historical track record can prove invaluable for addressing ongoing problems. No one wants to constantly troubleshoot the same problems, so differentiating transient problems from recurring ones and examining the circumstances surrounding them can dramatically reduce their incidence over time. An intuitive PC front-end to the performance monitor can make light work of these kinds of tasks. For instance, a simple line graph (as shown in Figure 2) showing the peaks and troughs of disk usage can be instrumental in drilling down to scrutinize which jobs using the most CPU were running at a particular time and, in turn, which users were running the jobs. Such information, when presented in easy-to-read management reports, quickly communicates areas of concern and considerations for the future, with many organizations choosing to share such system information among management personnel by instantly exporting them (in .jpg or .bmp formats) to the company intranet.
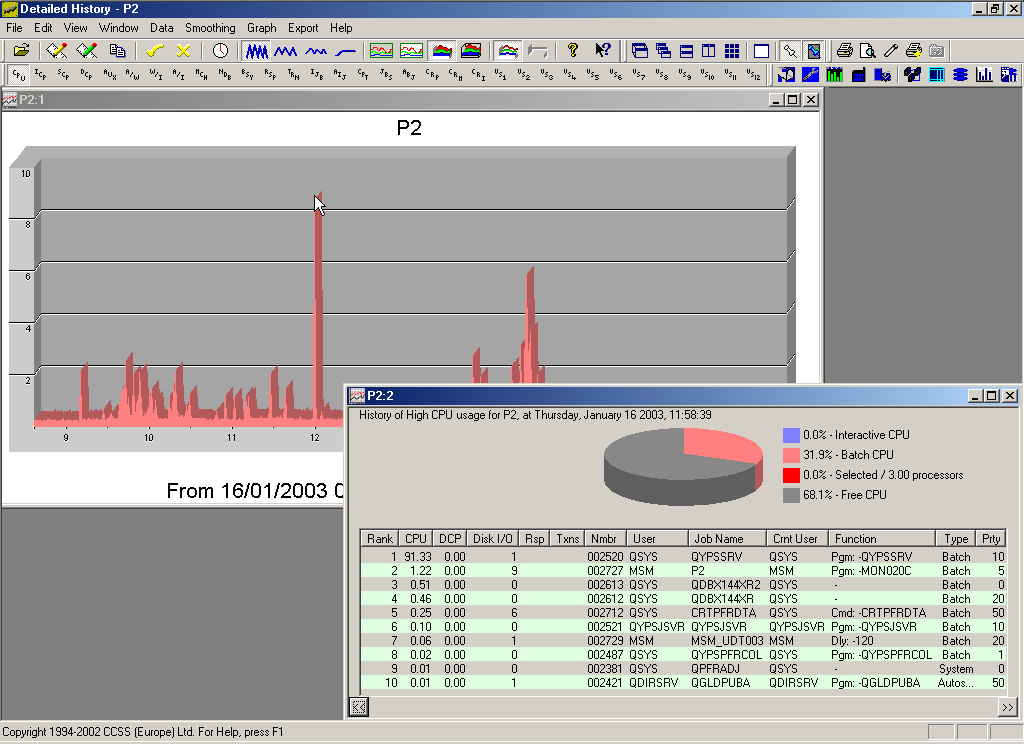
Figure 2: A graph shows the peaks and troughs of disk usage.
A comprehensive performance monitor can simplify the important and previously laborious area of job monitoring. Simple commands can be used to instantly retrieve information on key jobs generated by applications such as Movex, WebSphere, or Domino as well as products from companies such as DataMirror, Pentasafe, and Fiserv. Commands such as these cut through a mass of information, quickly delivering logical summaries or lists that operators need to make accurate decisions. The careful retrieval of precise information in a no-nonsense format reinforces the "less is more" approach, supporting any management-by-exception environment without compromising on depth of knowledge or detail when required.
In large organizations or outsourcing companies where different customers or internal divisions of a company are paying for proportional resource, keeping a constant vigil on system usage and performance levels becomes critical. Service-level agreements and job accounting features become the "proof" and "contracts" upon which business is secured and maintained. In these large network environments, the potential for problems is of course multiplied by the number of systems, but with an adequate performance monitor in place, offering a centralized view of the entire network and automating the precision monitoring of each system's most critical performance components, that potential for problems is radically reduced. If it wasn't, outsourcing companies simply wouldn't exist.
If your system is giving you the silent treatment, it's time to get a performance monitor. You may not like everything it has to say, but the best relationships are always based on honesty. Let your performance monitor keep an eye on all the systems parameters all the time; after all, you're only human--know thy limits!
Greer Hahn is a freelance IT writer, who occasionally works for CCSS (USA) Corp. CCSS is an industry leader in the development and marketing of IBM iSeries System Performance Monitoring, Message Management, and M-Commerce Wireless Products to maximize availability and optimize resources.


 More than ever, there is a demand for IT to deliver innovation. Your IBM i has been an essential part of your business operations for years. However, your organization may struggle to maintain the current system and implement new projects. The thousands of customers we've worked with and surveyed state that expectations regarding the digital footprint and vision of the company are not aligned with the current IT environment.
 TRY the one package that solves all your document design and printing challenges on all your platforms. Produce bar code labels, electronic forms, ad hoc reports, and RFID tags – without programming! MarkMagic is the only document design and print solution that combines report writing, WYSIWYG label and forms design, and conditional printing in one integrated product. Make sure your data survives when catastrophe hits. Request your trial now! Request Now.
 Forms of ransomware has been around for over 30 years, and with more and more organizations suffering attacks each year, it continues to endure. What has made ransomware such a durable threat and what is the best way to combat it? In order to prevent ransomware, organizations must first understand how it works.
 Disaster protection is vital to every business. Yet, it often consists of patched together procedures that are prone to error. From automatic backups to data encryption to media management, Robot automates the routine (yet often complex) tasks of iSeries backup and recovery, saving you time and money and making the process safer and more reliable. Automate your backups with the Robot Backup and Recovery Solution. Key features include:
 Business users want new applications now. Market and regulatory pressures require faster application updates and delivery into production. Your IBM i developers may be approaching retirement, and you see no sure way to fill their positions with experienced developers. In addition, you may be caught between maintaining your existing applications and the uncertainty of moving to something new.
 IT managers hoping to find new IBM i talent are discovering that the pool of experienced RPG programmers and operators or administrators with intimate knowledge of the operating system and the applications that run on it is small. This begs the question: How will you manage the platform that supports such a big part of your business? This guide offers strategies and software suggestions to help you plan IT staffing and resources and smooth the transition after your AS/400 talent retires. Read on to learn:
LATEST COMMENTS
MC Press Online