


Are performance
problems on your iSeries causing you stressful days and sleepless nights? They
aren't for me anymore. That's because I'm running the new Job Watcher monitor on
my critical systems. I no longer worry about whether or not a performance
problem occurs and whether or not I will be able to capture the necessary data.
The Job Watcher monitor captures the data for me 24x7.
Let me tell you
about Job Watcher. If you've never heard about Job Watcher, it's about time
someone starts to spread the good news. Job Watcher is included under the iDoctor suite of tools.
It's a great tool for detecting job waits, seizes, and other types of
contention. Job Watcher allows you to watch a specific job, a set of jobs, or
all the jobs on your system. Watching all the jobs on your system is especially
useful when you aren't sure which jobs are having performance problems or when
you just want an overview of how your entire system is performing.
Job
Watcher returns real-time information, and you don't have to wait until all the
data is collected before you start your analysis. You can start looking at the
data almost immediately. The data is displayed in an easy-to-view graphical
format. Job Watcher also gives you drill-down capability to determine the impact
that a wait condition is having on the entire system or on a particular job.
Even if you are not a performance expert and are not able to completely
interpret the results, it will at least enable you to pinpoint a particular
problem and lead you in the right direction to get additional assistance if
needed. Job Watcher collects the data from the jobs, threads, and tasks you're
watching in a manner that does not affect other jobs on the system while it is
collecting, so it won't add to your performance problems.
As if Job
Watcher didn't have enough great features, a Job Watcher monitor function has
now been added (available for release V5R3 and above), which you can run 24x7 on
your system. It includes all the great features of Job Watcher but gives you the
added capability of running Job Watcher collections continuously rather than for
just a specific period of time. I can't tell you how effective this has been in
helping me solve a considerable number of performance problems and issues that I
would not have been otherwise able to resolve.
Let me explain to you
how it works and then give you some examples of how the Job Watcher monitor was
able to help me resolve some performance problems. The Job Watcher monitors can
be started via the GUI or by using traditional 5250 green-screen commands.
Monitors must be manually ended; however, an IPL will also end a monitor.
Monitors must be manually restarted after an IPL. We simply added code to our
startup program by using the available green-screen commands to ensure that the
monitors automatically restart after an IPL. The Job Watcher monitor will keep a
predefined number of historical collections, and collections can overlap so no
activity is lost.
After you've downloaded and installed Job Watcher,
click on the iDoctor for iSeries icon on your desktop. This will automatically
pick up any iSeries Navigator connections you already have established and
display them.
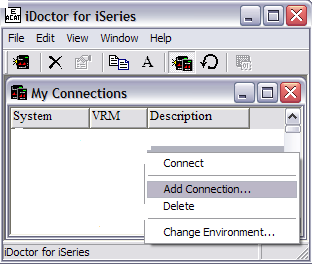
If you don't have any connections or need to add a new
one, right-click anywhere within the window and select Add Connection.
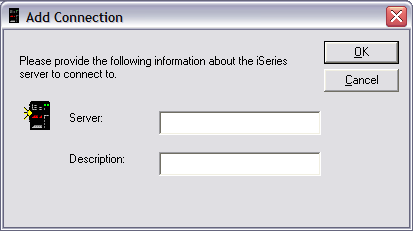
Enter the name of your iSeries server and give a brief
description (not required). Then click on OK to add the new connection to the
list.
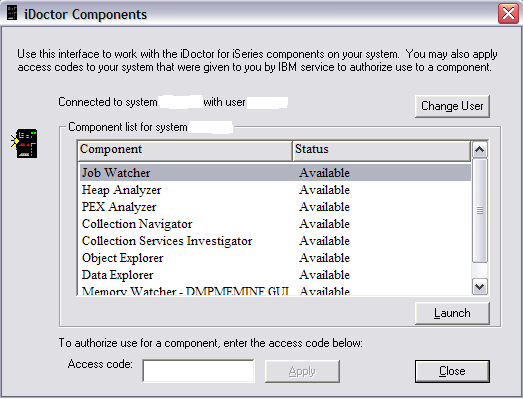
In your list of connections, double-click on the system
of your choice. This will bring up the sign-on display for the iSeries system.
Your profile should automatically be displayed. Type in your password and press
OK to get the list of iDoctor components that are currently installed on this
particular system. Ensure that the Job Watcher component is highlighted and
click on Launch or double-click on Job Watcher.
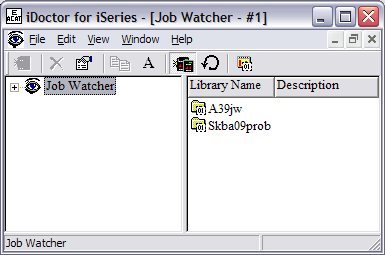
This brings you to the main Job Watcher display.
To start the monitors via the GUI, right-click on Job
Watcher. Then select Work with Monitors.

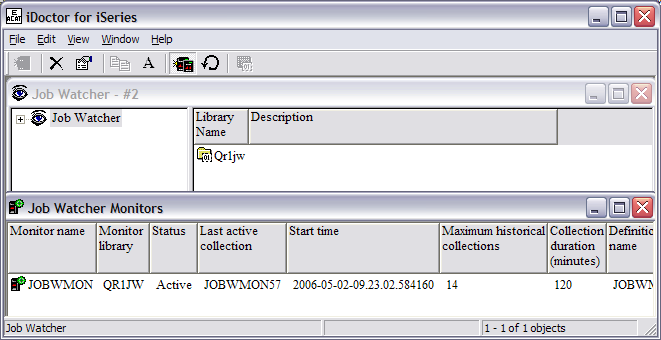
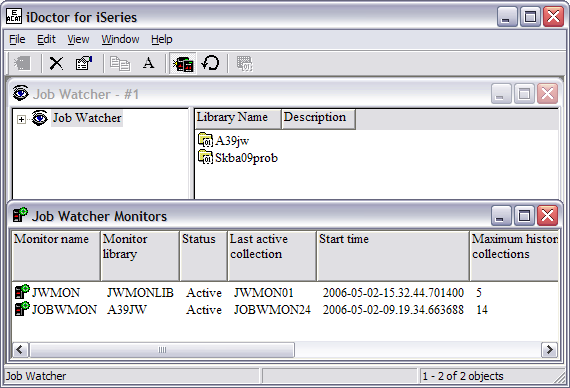
A new window is created where all previous Job
Watcher monitors, active or not, will be listed. If no Job Watcher monitors are
available on your system, the new window will be empty. In this example, one Job
Watcher monitor, JOBWMON, is already active.
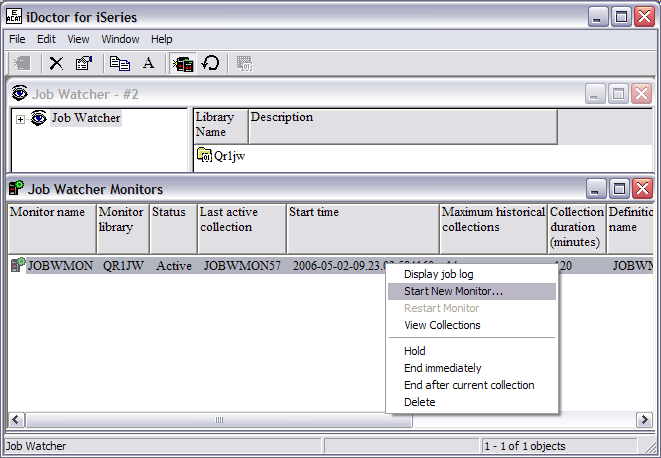
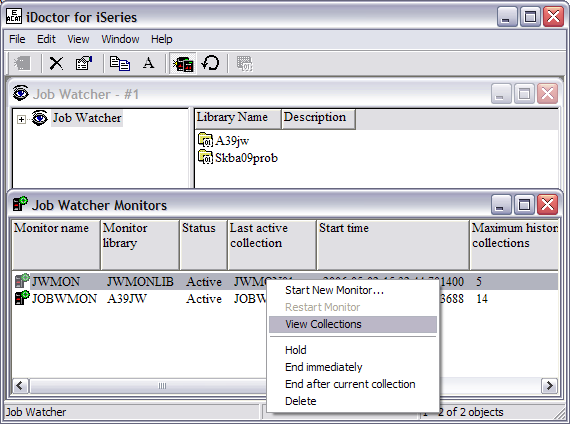
Right-click anywhere in the new window and click on
Start New Monitor. In this example, our system already has an active monitor. By
right-clicking on the active monitor, you will get different options than if you
right-click anywhere else in the new window. With an existing monitor, you can
view the current collections, hold a monitor, end it immediately, end it after
the current collection, or delete a monitor.
Before starting a new monitor, you need to fill out a
few details specific to your monitor. Give your monitor a name and decide which
library you want the collected data to be stored in. In the example that
follows, we will call our monitor JWMON, and we will store the collected data in
library JWMONLIB.
How long do you want each collection to run? In this
example, each collection will run for 60 minutes. How many collections do you
want to keep? In this example, five historical collections will be kept. So in
this example, you will be collecting data for one hour and keeping five of these
collections as historical data. If there was a performance problem, you would be
able to go back five hours in time. After five hours, the oldest collection is
overlaid and new data is collected in its place. You have to decide if this is
enough historical data for you to keep. If you typically have customers who
don't call you for several hours or until the next day, maybe you want to keep
more than five historical collections. This will allow you to go back further in
time to resolve performance issues. Do you see where I'm going with this? On our
more critical systems, I have two-hour collections and I keep 14 of these so I
can go back 28 hours in time. This amount of data allows me to go back far
enough to find the problem. Be aware that storing this much data takes a fair
amount of DASD . However, we don't have a storage problem, so I am being allowed
to keep this much data. In the future, though, this might not be the case.
In this example, there is a collection overlap of 30 seconds. So 30
seconds before the current collection ends, the new collection will start so you
don't lose any data.
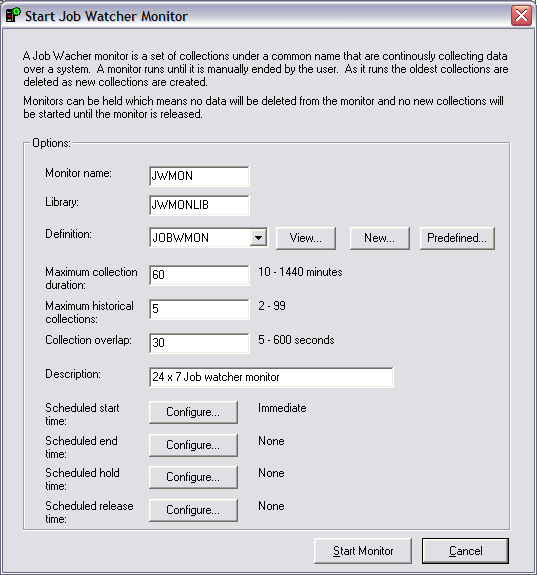
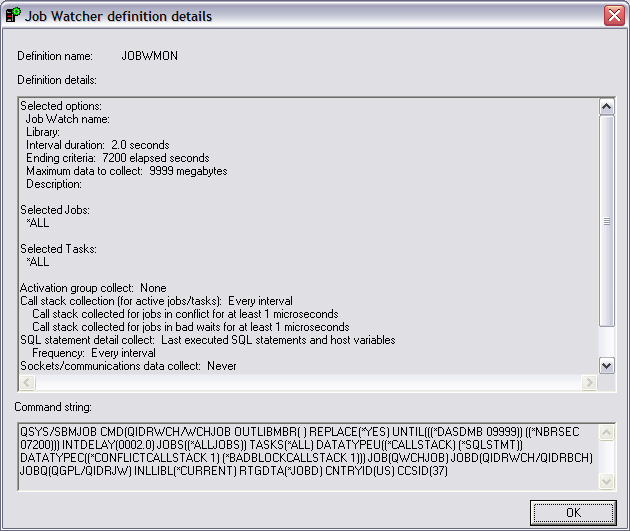
You also need a Job Watcher definition. A
definition gives Job Watcher the specific details of what you want
collected. You can use an existing definition by clicking on View. If there are
existing definitions, they will appear here. You can also create a new
definition or use one that has been predefined. To create a new Job Watcher
definition, you need to give it a name. In this example, we call our definition
JWMONDEF.
Now, decide how long you want each of your individual
collections to run. You can select up to 1440 minutes for your collection
duration. You probably don't want your collections too large. This really
depends on the size of your system. Very large systems can collect a large
amount of data in a fairly short amount of time.
The interval duration
is the amount of time in between the Job Watcher collection snapshots. The
smaller the interval duration, the more information you will be able to collect
and have available to you. If a seize or object lock only lasts for one second
and you have your collection interval set to five seconds, you may miss it. So
be sure to set your interval duration accordingly.
What other
information do you want included? Make sure you include call stacks. This is one
of the great features of Job Watcher and is especially useful when you are
drilling down into a particular problem. You want to make sure you are including
this information.
Include SQL statements if your users or applications
typically use SQL functions. This will allow Job Watcher to capture the SQL
statement (along with host variables) and you can view it later if you think the
SQL statement is causing performance problems.
You can also include
communications data if you want; however, currently there are no packaged Job
Watcher queries, graphs, or reports related to communications data.
Force first interval means all jobs and tasks will be included in the
first interval. Normally, only jobs and tasks that use CPU during an interval
would be included. If you are starting Job Watcher when a problem is already in
progress, it's a good idea to include idle jobs and tasks. But if you are
starting Job Watcher prior to a problem occurring (for example, as a monitor),
there is no need to include all jobs and tasks.

These are some of the predefined iDoctor-supplied
definitions. If you aren't sure how to set up your first monitor definition, try
some of these and decide if they work for you. You can always change your
monitor later using a different definition.

If you have some existing Job Watcher monitor
definitions already created and you can't remember the details, you can click on
View. This will show you the details for an existing definition.
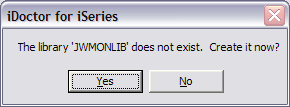
Now, you are ready to start the monitor. Click on Start
Monitor. If the library you specified does not exist, you will be prompted with
the following message:
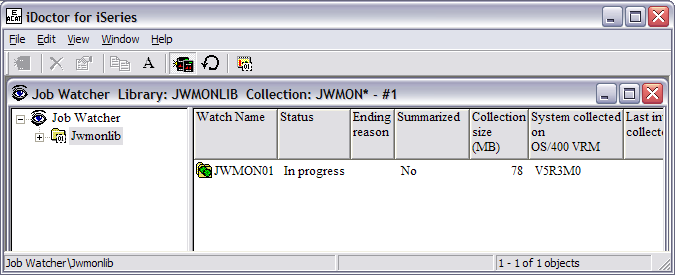
You will see the newly-created monitor with a status of
Active.
Right-click on the active JWMON monitor and select View
Collections.
This brings up the library that contains your stored
collections.
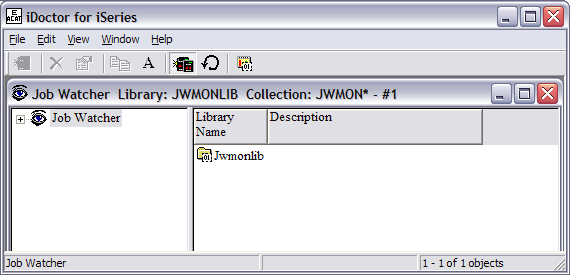
Double-click on the library name, JWMONLIB, to view the
collections. Since we just started the monitor, there is only one collection
available. Notice that this collection is called JWMON01. Subsequent collections
will be named JWMON02, JWMON03, JWMON04, etc. After the maximum number of
historical collections is reached, the oldest collection will be deleted and a
new collection created.
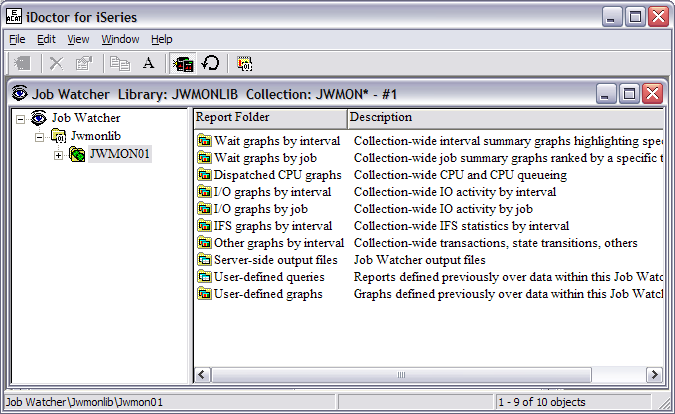
Double-click on JWMON01 to see the available graphs and
output files.
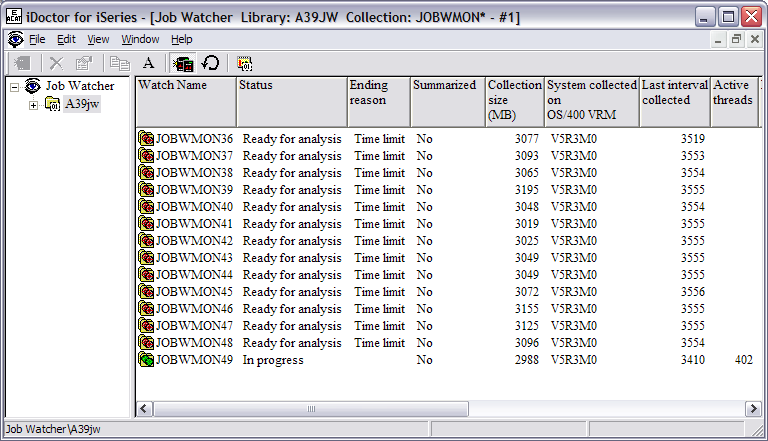
In this example, there are 13 historical collections
with one current collection in progress. When JOBWMON50 is created, JOBWMON36
(the oldest collection) will be deleted.
Several Job Watcher green-screen commands are
available, and these can be found in library QIDRWCH.
- ADDJWDFN—Add Job Watcher Definition
- STRJWMON—Start a Job Watcher Monitor
- HLDJWMON—Hold a Job Watcher Monitor
- RLSJWMON—Release a Job Watcher Monitor
- ENDJWMON—End a Job Watcher Monitor
- RSTJWMON —Restore a Job Watcher Monitor
- ENDJWCOL—End a Job Watcher Collection
- DLTJWMON—Delete a Job Watcher Monitor
Now that your
Job Watcher monitor is active and collecting data, you can relax, sit back, and
let the performance problems begin. When your customer calls and says there was
a problem at 1:00 this afternoon, you can confidently go to your Job Watcher
collected data and start investigating. Unfortunately, without the Job Watcher
monitor, you may have to tell your customer that the problem needs to reoccur
before you can capture the right data. Don't get me wrong. The Performance Tools
LPP (5722PT1) provides some great reports, and there are some other real-time
performance commands—like WRKSYSACT (Work with System Activity), WRKACTJOB
(Work with Active Jobs) and WRKSYSSTS (Work with System Status)—that can
give you some great information. But no tool captures job waits, seizes, and
other object contention like Job Watcher. So now that you know how to start your
Job Watcher monitor, let me show you what it can do for you.
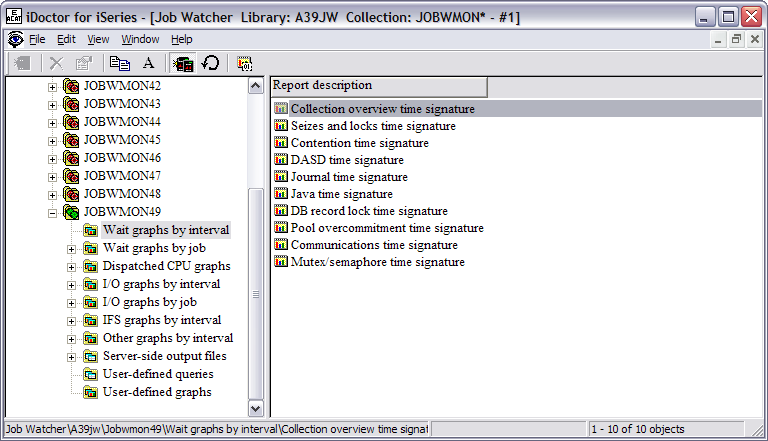
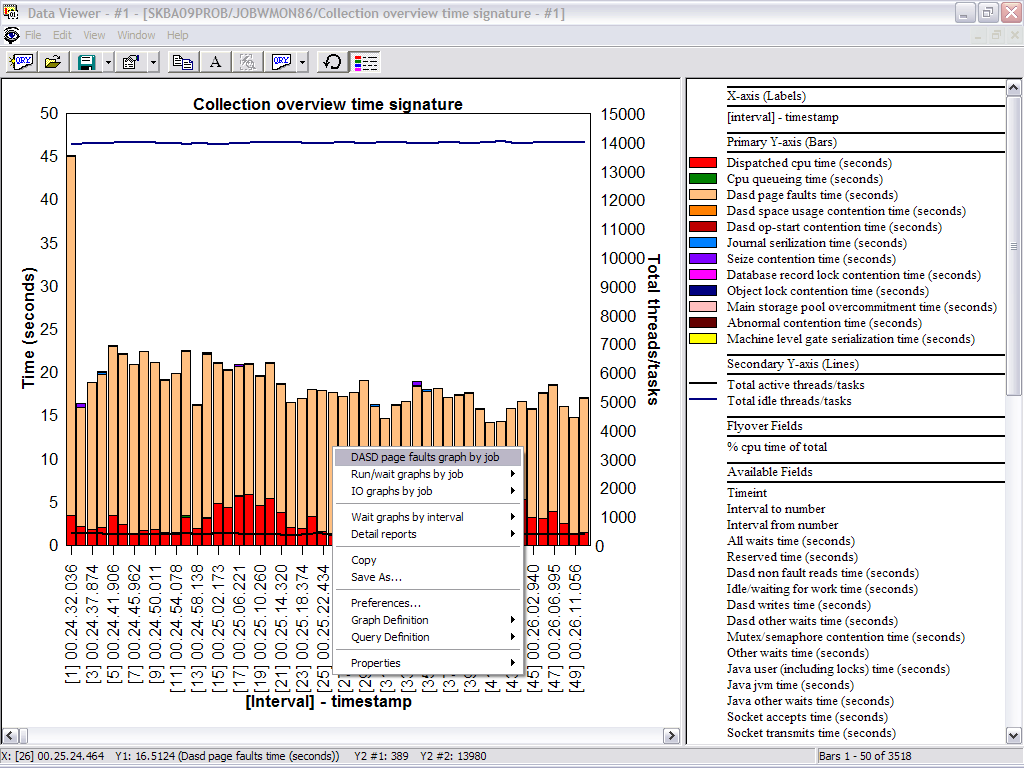
Job Watcher
provides you with a large amount of graphs. If you don't know where to start, go
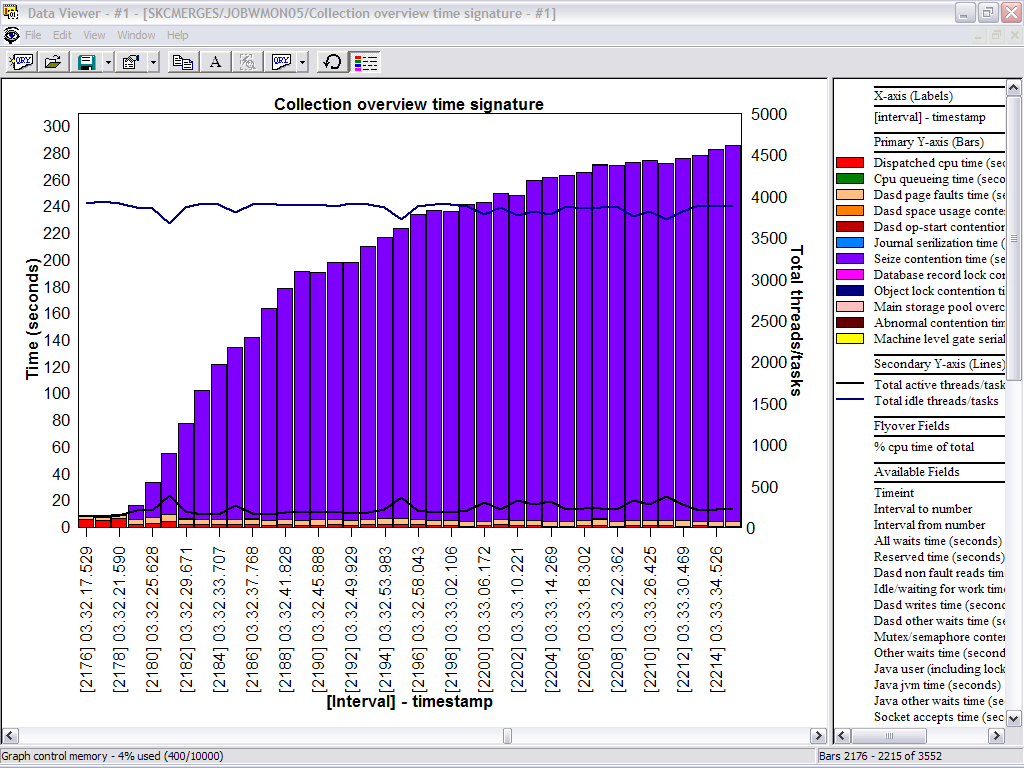
to the Wait Graphs by Interval and click on Collection overview time signature.
This graph gives you a good overview of what's happening on your system, and
it's a very good starting place.
One day as I was leisurely browsing through my Job
Watcher collections, I started with the Collection overview time signature. This
graph happened to show a high amount of DASD page faults (indicated by the light
brown color in the graph). If you didn't already know this, you could look at
the legend that is associated with the graph and displayed on the right side or
use your mouse to fly over the graph and see the interval details. The customer
hadn't reported any problems or issues; but because I was using the Job Watcher
monitor, I was able to look through the data on my own time and at a relaxed
pace.
In this example, each of the intervals is two seconds. So each bar
you see here represents a two-second interval. You can set this collection
interval to any value between .1 and 3600 seconds. But remember, the smaller the
collection interval, the more detailed information you will be able to see. If a
seize or object lock lasts for only one second and you have your collection
interval set to five seconds, you may miss it.

From this graph, I was able to drill down into any one
of these different intervals by right-clicking on one of them and selecting DASD
page faults graph by job.
By drilling down into the collected Job Watcher data, I
was able to see a list of all the jobs ranked by DASD page faults for that
particular interval.
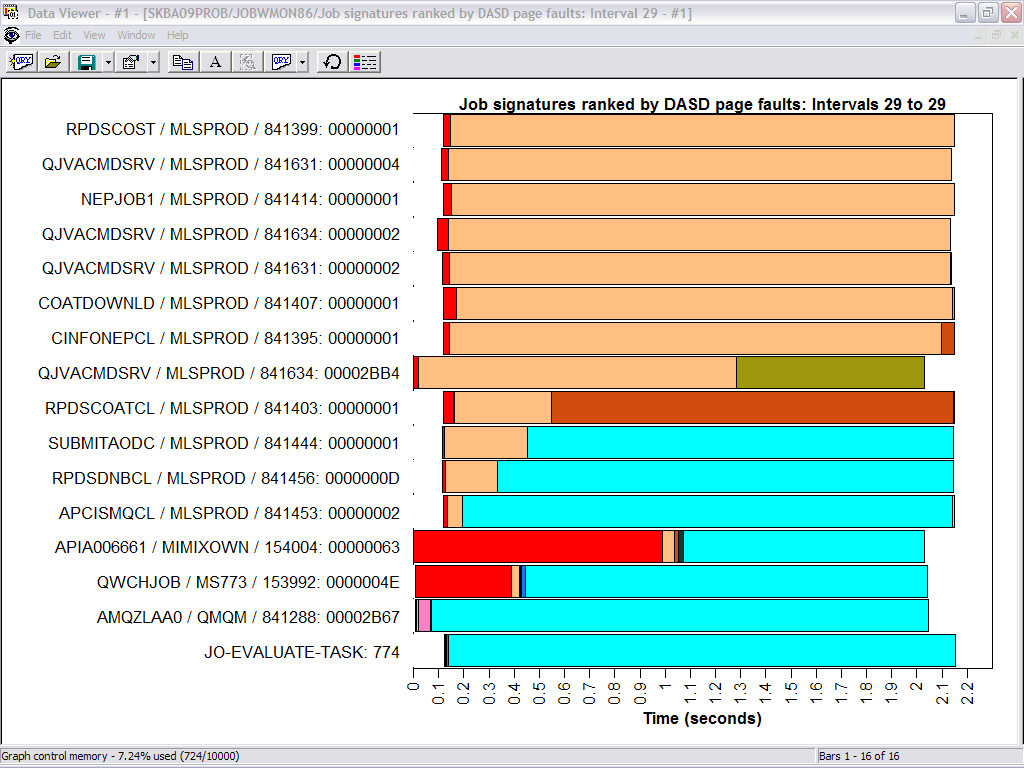
From here, I was able to drill down even further into
each one of these jobs by double-clicking on the horizontal bar graph following
a particular job. By looking at this Interval Details screen, I was able to
determine that each of these jobs with the highest DASD page faults was
occurring in the same pool and the same subsystem.
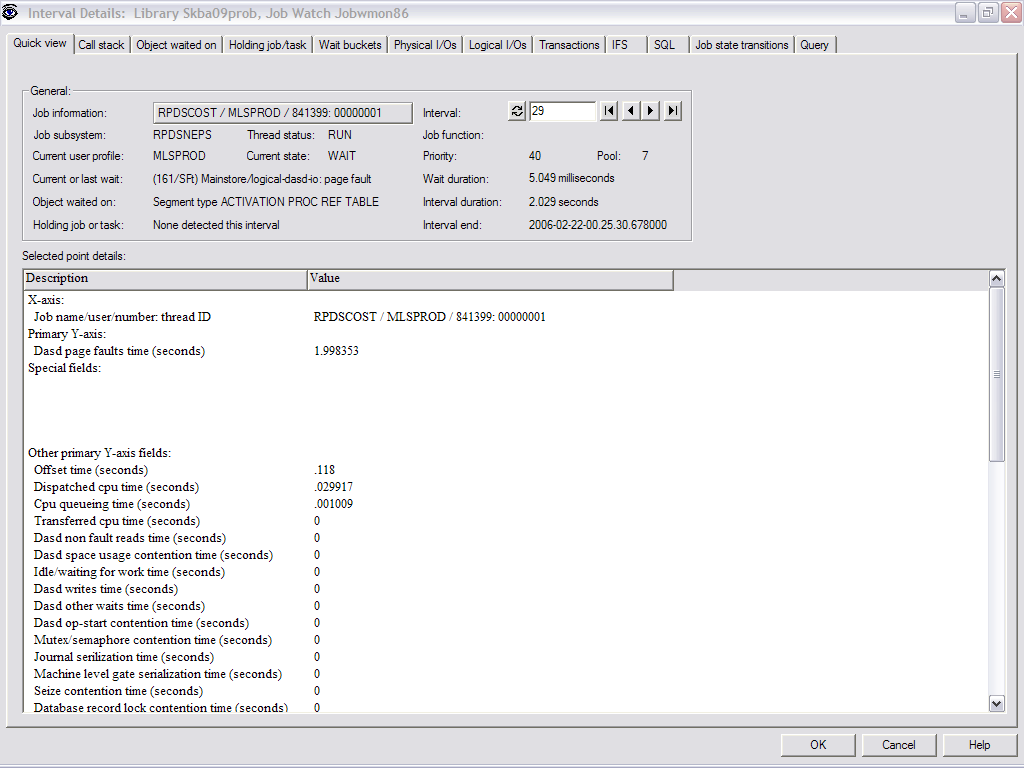
Upon further investigation on the iSeries system
itself, I noticed that these jobs were running in a subsystem that had
originally been set up with a private pool. This private pool size may have been
sufficient in the past; however, the customer had recently been adding more and
more jobs to this subsystem, and the size of the private pool was no longer big
enough to handle the workload. I was able to change the pool for this subsystem
to a shared pool (but not being used by any other subsystems), and the
performance adjuster (system value QPFRADJ) was then able to adjust the size of
the pool according to the workload. DASD page faults were drastically reduced.
All of this was done proactively before the customer even detected or reported
any type of slowdown or performance issue.
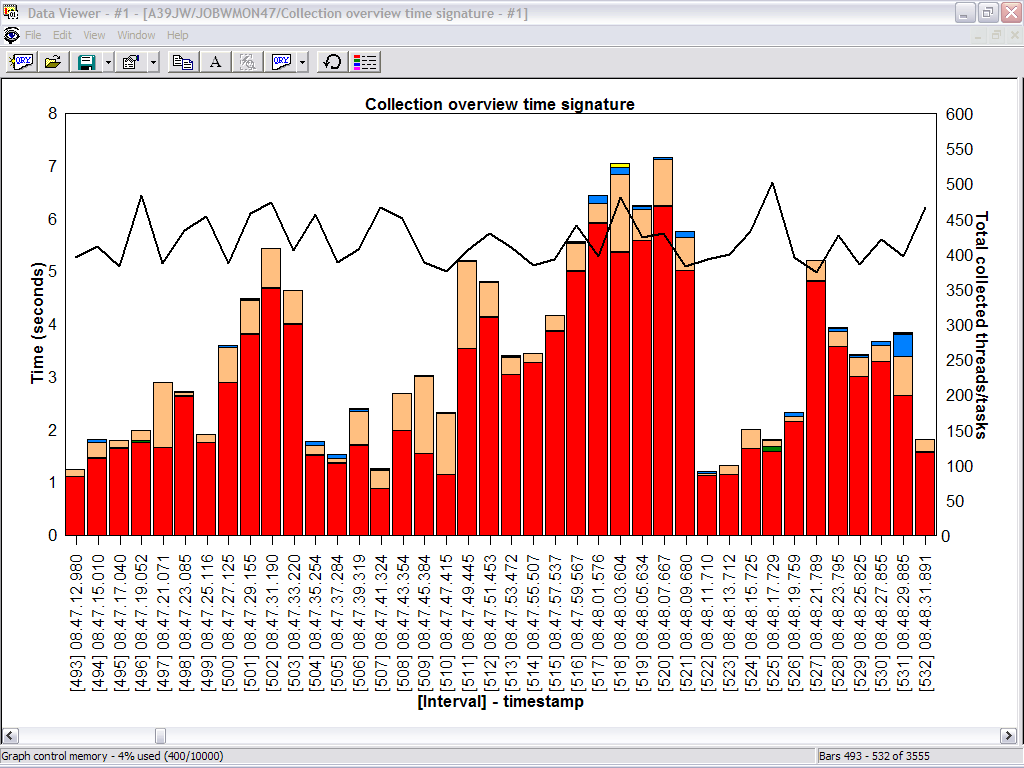
After the change was made, I
was able to go back to my Job Watcher data and see the difference. As you can
see from this graph, there are still some intervals with DASD page faults but
they have been significantly reduced. Next problem, please.
Here's where Job Watcher really shines. A problem was
reported to me, and I was also given the timeframe in which the problem
occurred. This helped me narrow my search through the collected data. I was able
to go directly to the collection that occurred over this timeframe. Since I
still wasn't sure what I was looking for, I went to the Wait graphs by interval
and then clicked on the Collection overtime time signature graph. When I reached
the problem timeframe, it was very obvious by looking at the Job Watcher data.
The purple in this graph indicated a seize contention problem. In this example,
you can see the problem started in interval 2179 and just continued to build.
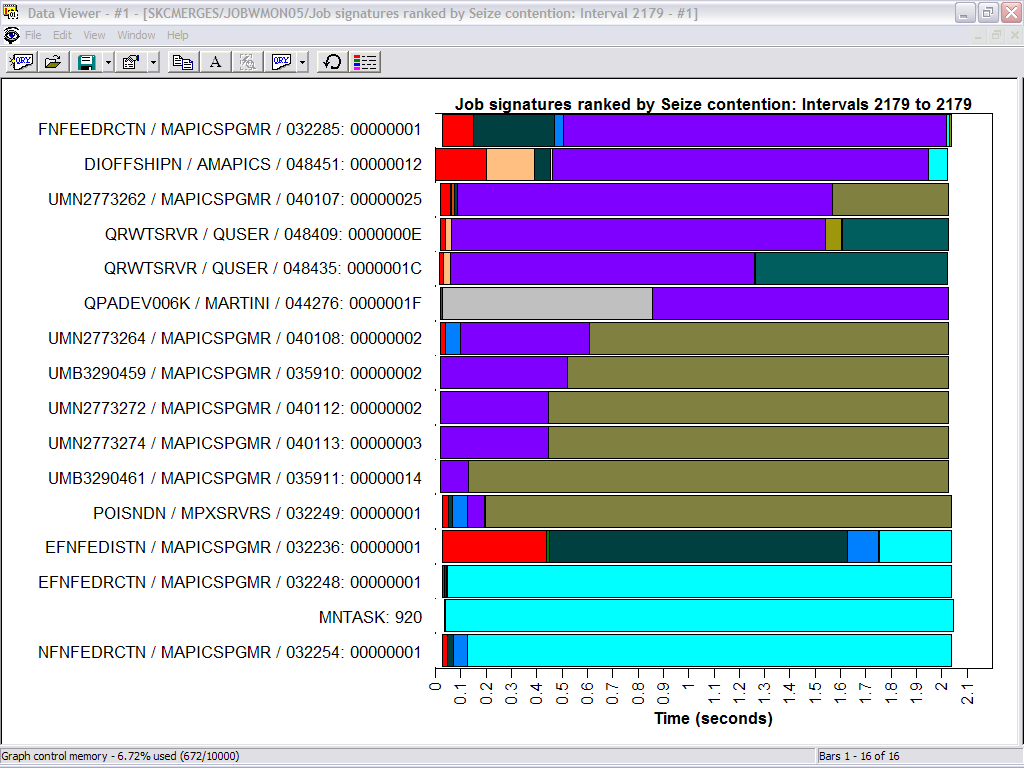
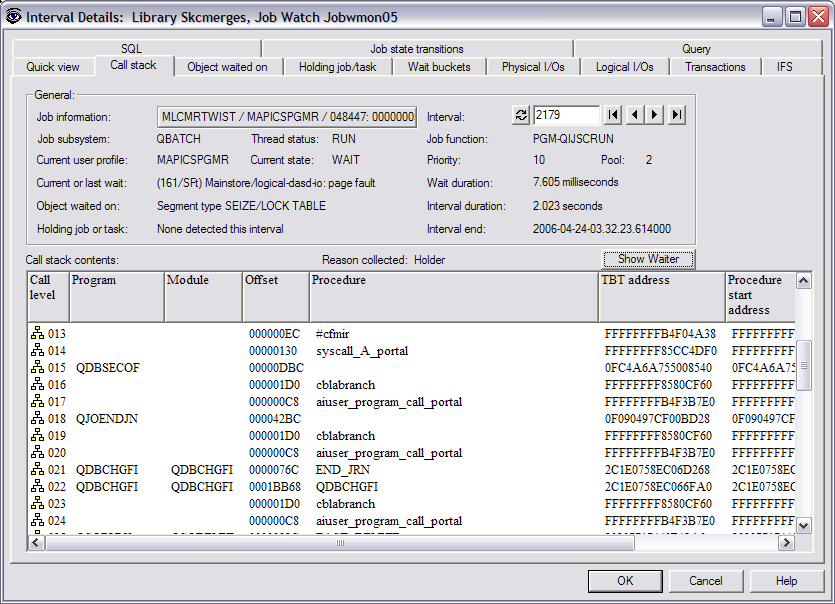
In this example, I drilled down into interval 2179 to
see what was going on. I right-clicked on interval 2179 in the purple area and
clicked on Seize contention graph by job.

This gave me a list of the jobs ranked by seize
contention. From here, I could drill down even further by double-clicking on any
one of the horizontal bar graphs. In this example, I drilled down into the first
job.
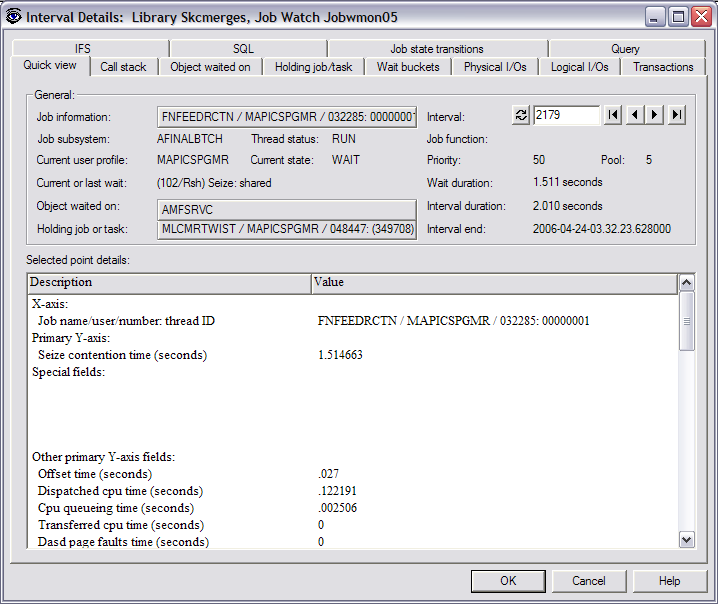
This screen gave me all the details for this particular
job during this interval (2179). You can see the job name, the subsystem and
pool it was running in, priority, etc. It also showed me the Current or last
wait, which was Seize: shared. This screen showed that the job was waiting on
object AMFSRVC, and it also identified the holder of the object. If I didn't
know what AMFSRVC was, I could click on the Object waited on tab, and it would
show me the object type. In this case, it was a library. As I continued to look
at the other jobs on the previous screen, I started to see a pattern. All the
jobs were waiting on the same object, and it was being held by the same job.
To further investigate, I clicked on the Call stack tab
to see the call stack of the waiting job. In this example, the waiting job was
opening a file, as indicated by QDMCOPEN.
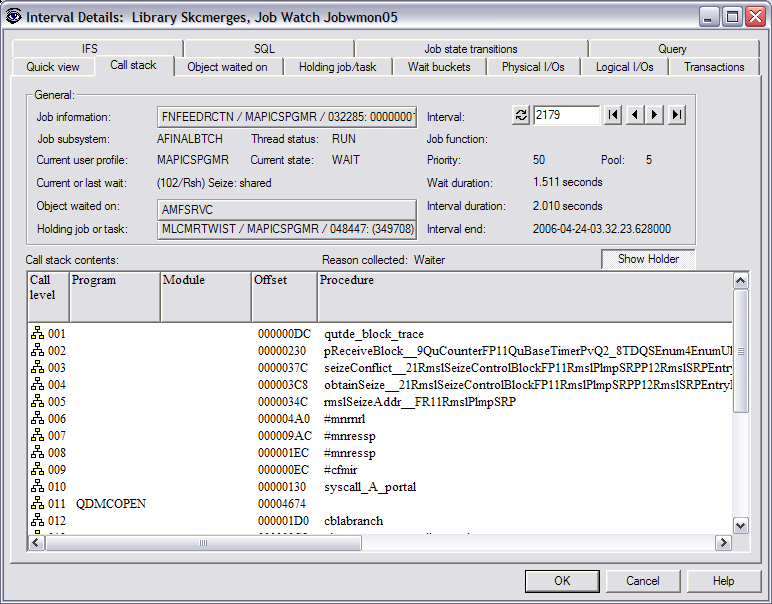
From here, I was able to look at the call stack of the
holder job by clicking on Show Holder. From the call stack of the holding job, I
was able to tell that it was doing an ENDJRNPF (End Journal Physical File) as
indicated by the QJOENDJN program in the call stack. It was also doing a CHGPF
as indicated by the QDBCHGFI before the QJOENDJN. So what do ENDJRNPF and CHGPF
have to do with seize problems? Well, I may not know the exact answer to that
question, but at least I know what's happening, so now I can work with the
appropriate people to determine how to fix this situation and prevent it from
happening again.
See how easy that was? As you can see from these
examples, Job Watcher is a very powerful tool for solving your performance
problems, particularly job waits and seize conditions. When you add in the Job
Watcher monitor capabilities, it becomes even more powerful.
So how do
you get started using Job Watcher? If you do not already have Job Watcher
installed on your iSeries or i5 server, you can obtain a 45-day trial version by
filling out and submitting a trial
agreement form. For the trial agreement form, you must provide the serial
number of your iSeries or i5 system and your OS/400 (i5/OS) version and release
level.
After the form is submitted, you should receive a reply email
within 24 hours that will contain
a temporary access code. The access code
can be added either during the installation of Job Watcher or after Job Watcher
has been installed. The access code must be entered before you can start a Job
Watcher monitor or collection or analyze an existing Job Watcher collection that
has been restored from another iSeries or i5 system.
Sandi Chromey is an Advisory IT/Architect with
IBM Global Services. She provides iSeries performance support to both internal
and external customers within IBM Global Services. Sandi has been with IBM for
24 years, with 13 of those years being in IT. She also has experience in iSeries
development and component test.


 More than ever, there is a demand for IT to deliver innovation. Your IBM i has been an essential part of your business operations for years. However, your organization may struggle to maintain the current system and implement new projects. The thousands of customers we've worked with and surveyed state that expectations regarding the digital footprint and vision of the company are not aligned with the current IT environment.
 TRY the one package that solves all your document design and printing challenges on all your platforms. Produce bar code labels, electronic forms, ad hoc reports, and RFID tags – without programming! MarkMagic is the only document design and print solution that combines report writing, WYSIWYG label and forms design, and conditional printing in one integrated product. Make sure your data survives when catastrophe hits. Request your trial now! Request Now.
 Forms of ransomware has been around for over 30 years, and with more and more organizations suffering attacks each year, it continues to endure. What has made ransomware such a durable threat and what is the best way to combat it? In order to prevent ransomware, organizations must first understand how it works.
 Disaster protection is vital to every business. Yet, it often consists of patched together procedures that are prone to error. From automatic backups to data encryption to media management, Robot automates the routine (yet often complex) tasks of iSeries backup and recovery, saving you time and money and making the process safer and more reliable. Automate your backups with the Robot Backup and Recovery Solution. Key features include:
 Business users want new applications now. Market and regulatory pressures require faster application updates and delivery into production. Your IBM i developers may be approaching retirement, and you see no sure way to fill their positions with experienced developers. In addition, you may be caught between maintaining your existing applications and the uncertainty of moving to something new.
 IT managers hoping to find new IBM i talent are discovering that the pool of experienced RPG programmers and operators or administrators with intimate knowledge of the operating system and the applications that run on it is small. This begs the question: How will you manage the platform that supports such a big part of your business? This guide offers strategies and software suggestions to help you plan IT staffing and resources and smooth the transition after your AS/400 talent retires. Read on to learn:
LATEST COMMENTS
MC Press Online