


OS/400 allows you to logically slice memory into sections called pools. You can look at the size of these pools using commands such as Work with System Status (WRKSYSSTS) or Work with Shared Pools (WRKSHRPOOL). However, these commands only show the numeric values of the pool sizes. What if there were a way to display these pool sizes in a graphical representation? These numbers would instantly take on a whole new meaning. For example, the relationships between the pool sizes would become immediately evident. You would also be able to quickly identify how much of your total memory each pool was using.
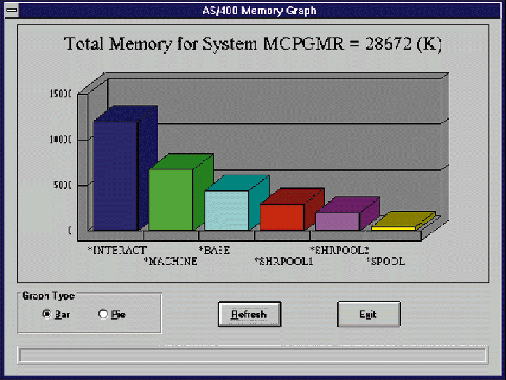
In this article, I'll introduce you to a client/server program that does just that. The Graph AS/400 Memory (GRAPHMEM) utility graphs your AS/400's memory by storage pool. You can see an example of the output in 1. To accomplish its task, this utility uses a Visual Basic (VB) program on the PC side and a CL and an RPG program on the AS/400 side. In this article, I'll explain how to implement this utility and how to use it once it's installed. I'll also take you on a tour of the code that makes all of this possible. Then, I'll conclude with some considerations and describe some ways to enhance this utility.
In this article, I'll introduce you to a client/server program that does just that. The Graph AS/400 Memory (GRAPHMEM) utility graphs your AS/400's memory by storage pool. You can see an example of the output in Figure 1. To accomplish its task, this utility uses a Visual Basic (VB) program on the PC side and a CL and an RPG program on the AS/400 side. In this article, I'll explain how to implement this utility and how to use it once it's installed. I'll also take you on a tour of the code that makes all of this possible. Then, I'll conclude with some considerations and describe some ways to enhance this utility.
Before running this utility, you'll need to start a Client Access for Windows connection. You don't need to start any other Client Access components (e.g., emulation session or shared folders); just a basic router connection will do. If you've installed the utility (as described in the sidebar, "Installing the Graph Memory Utility"), you can, for example, double-click the Graph AS/400 Memory icon created when you ran the SETUP.EXE installation program. If you want to run the source code from within the VB development environment, then start VB and open the GRAPHMEM.MAK file and select the run button on the toolbar.
When you run the utility, it goes to work gathering information about the memory pools for the default AS/400 system defined in your Client Access configuration. This may take several seconds, depending on the performance of your AS/400. For this reason, a status bar at the bottom of the window gives you an indication of the progress the utility is making. The status bar fills with blue from left to right and shows a numerical percentage value representing the percentage complete in the center of the bar.
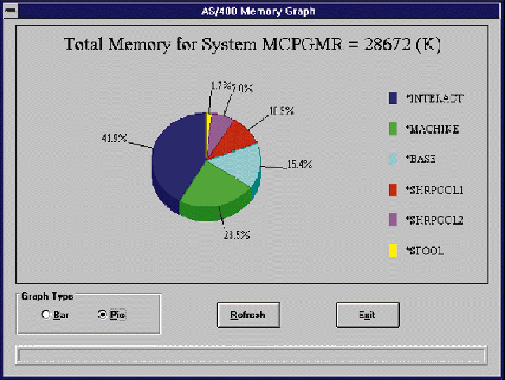
When the utility finishes gathering all the information about the memory pools, it draws a bar graph in the window. The title of the graph identifies the system name and the total amount of memory. You can switch from a bar graph to a pie chart by clicking the Pie radio button. 2 shows an example of a pie chart. The pie chart gives you some additional information not shown on the bar graph. It identifies the percentage of total memory used by each of the pools shown on the graph.
When the utility finishes gathering all the information about the memory pools, it draws a bar graph in the window. The title of the graph identifies the system name and the total amount of memory. You can switch from a bar graph to a pie chart by clicking the Pie radio button. Figure 2 shows an example of a pie chart. The pie chart gives you some additional information not shown on the bar graph. It identifies the percentage of total memory used by each of the pools shown on the graph.
There is very little delay when switching between a bar graph and a pie chart because the AS/400 does not gather the information again. The utility simply presents the same static information in two different formats. If you want to refresh the information on the graph, you can use the Refresh button. Pressing the button will cause the utility to go back out to the AS/400 and gather the pool information again. You'll want to use the Refresh button if you're changing pool sizes on the AS/400 using an emulation session while you're running this utility. You might also want to use it if you have the QPFRADJ (Performance Adjustment) system value set to 3, which causes the system to automatically adjust the size of your storage pools based on system utilization. When you're finished using the utility, select the Exit button to quit.
As with most client/server applications, this utility has two major components: the code that runs on the PC and the code that runs on the AS/400. I'll start by describing the AS/400 code. Here, you'll find two programs, one written in CL and the other in RPG.
3 shows the code for the CL program MEM001CL. The purpose of this program is to make sure that an empty work file called MEM001PF exists in QGPL, and then to call the RPG program that loads this file. The work file is used to store pool information that will subsequently be downloaded to the PC. The work file is created as a simple "flat" file by specifying a record length on the Create Physical File (CRTPF) command. This allows the program to create the file without the need for any DDS source code.
Figure 3 shows the code for the CL program MEM001CL. The purpose of this program is to make sure that an empty work file called MEM001PF exists in QGPL, and then to call the RPG program that loads this file. The work file is used to store pool information that will subsequently be downloaded to the PC. The work file is created as a simple "flat" file by specifying a record length on the Create Physical File (CRTPF) command. This allows the program to create the file without the need for any DDS source code.
4 contains the code for the RPG program MEM001RG. The purpose of this program is to retrieve storage pool information and write it out to the work file. Because the work file only contains a single 20-byte field, I decided to simply code it as a program-described file. This means that the file doesn't need to exist when the program is compiled (which it probably won't).
Figure 4 contains the code for the RPG program MEM001RG. The purpose of this program is to retrieve storage pool information and write it out to the work file. Because the work file only contains a single 20-byte field, I decided to simply code it as a program-described file. This means that the file doesn't need to exist when the program is compiled (which it probably won't).
The MEM001RG program starts by retrieving the storage pool information. It accomplishes this by calling the Retrieve System Status (QWCRSSTS) API. This API returns the same type of information found on the Work with System Status display. The first record written to the work file contains only the system name. The subsequent records contain the size of each pool in the first 10 bytes and the name of the pool in the second 10 bytes. The reason for putting the size in the front of each record is that the records are sorted by the client program as they're retrieved, so having the size first means that the records will be retrieved in size order.
The code for the VB program that runs on the PC is shown in5 through 9. Although this code is all part of one file called GRAPHMEM.FRM, I've broken it down into smaller sections to explain how it works. 5 shows the declaration section of the program. The declaration section is nonexecutable code. It's where I've defined the constants, variables, and functions that are used in this program.
The code for the VB program that runs on the PC is shown in Figures 5 through 9. Although this code is all part of one file called GRAPHMEM.FRM, I've broken it down into smaller sections to explain how it works. Figure 5 shows the declaration section of the program. The declaration section is nonexecutable code. It's where I've defined the constants, variables, and functions that are used in this program.
In the function declarations, you can see that I've used three Dynamic Link Libraries (DLLs). The first one is called EHNSRW.DLL and is part of Client Access. It contains functions such as EHNSR_SubmitCommand that allow you to run commands on an AS/400 from within a PC program. The second DLL is called PCSMCPY.DLL and is found in the QIWSTOOL folder. This one contains a function called EHNDT_GetPtr that allows you to retrieve a pointer containing the address of a variable. This one is necessary because VB doesn't natively allow you to do this-as you could in a C program, for example. The last DLL used in this program is called EHNRQW.DLL and contains functions such as EHNRQ_Select that allow you to run SQL statements against the AS/400 database.
The program begins executing at the beginning of the Form_Load subroutine shown in 6. This subroutine starts by disabling controls such as the graph type options and refresh button. This is done so that the user is not able to use these controls until after the graph is drawn. Next, the subroutine presents the form to the user and executes a subroutine to gather information from the AS/400 and generate the graph.
The program begins executing at the beginning of the Form_Load subroutine shown in Figure 6. This subroutine starts by disabling controls such as the graph type options and refresh button. This is done so that the user is not able to use these controls until after the graph is drawn. Next, the subroutine presents the form to the user and executes a subroutine to gather information from the AS/400 and generate the graph.
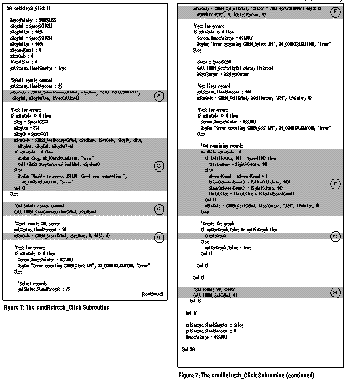
7 contains the code executed when the cmdRefresh button is clicked. This is where all of the API calls take place. At label A, you can see the code that submits a command to the AS/400 to call the MEM001CL program. If any errors occur submitting the command, the code at label B displays an error message. This statement at label C stops the conversation started when the CALL command was submitted to the AS/400. At label D, the remote SQL server job is started on the AS/400. This allows the program to execute SQL statements. label E shows the execution of an SQL statement to select records from the MEM001PF file. At label F, the program performs a loop to retrieve the records in the file after reading the first record. The values are stored in two arrays: one for the size of the pool and one for the name of the pool. The CreateGraph subroutine is executed at label G to draw the graph on the screen. The statement at label H ends the remote SQL server job on the AS/400.
Figure 7 contains the code executed when the cmdRefresh button is clicked. This is where all of the API calls take place. At label A, you can see the code that submits a command to the AS/400 to call the MEM001CL program. If any errors occur submitting the command, the code at label B displays an error message. This statement at label C stops the conversation started when the CALL command was submitted to the AS/400. At label D, the remote SQL server job is started on the AS/400. This allows the program to execute SQL statements. label E shows the execution of an SQL statement to select records from the MEM001PF file. At label F, the program performs a loop to retrieve the records in the file after reading the first record. The values are stored in two arrays: one for the size of the pool and one for the name of the pool. The CreateGraph subroutine is executed at label G to draw the graph on the screen. The statement at label H ends the remote SQL server job on the AS/400.
8 shows the code for the CreateGraph subroutine. This subroutine uses the values retrieved from the AS/400 to draw the graph. First, the subroutine drops into a loop in which it retrieves the sizes and names of the pools and uses these values to set properties of the graph control. Next, it sets the graph type to either bar or pie, based on which radio button is selected. Finally, it formats the title for the graph and draws the graph on the screen.
Figure 8 shows the code for the CreateGraph subroutine. This subroutine uses the values retrieved from the AS/400 to draw the graph. First, the subroutine drops into a loop in which it retrieves the sizes and names of the pools and uses these values to set properties of the graph control. Next, it sets the graph type to either bar or pie, based on which radio button is selected. Finally, it formats the title for the graph and draws the graph on the screen.
In 9, you can see three additional subroutines. Either the optBarGraph_Click or optGraph_Click subroutine executes whenever one of the graph-type radio buttons is selected. The statement in these subroutines causes the CreateGraph subroutine to execute. The cmdExit_Click subroutine unloads the form, which ends the program.
In Figure 9, you can see three additional subroutines. Either the optBarGraph_Click or optGraph_Click subroutine executes whenever one of the graph-type radio buttons is selected. The statement in these subroutines causes the CreateGraph subroutine to execute. The cmdExit_Click subroutine unloads the form, which ends the program.
There are many other ways I could have written this utility. For example, I could have used the ODBC APIs instead of the Remote SQL APIs. In fact, I've heard that IBM is now recommending the use of ODBC over Remote SQL for performance reasons. From my experience, ODBC is fast once you get past the initial connection to the database. The connect time to get ODBC started, however, is much greater on our system than on Remote SQL's. With a small number of records (fewer than 20), such as in this utility, it didn't make sense to use ODBC. If this utility had needed to read a large number of records, it may have made more sense to go with ODBC.
There are many ways in which you could enhance this utility. For example, you could add a Print button that would print the graph when selected. You could also add a menu with a Copy option to copy the graph so that it could be pasted into another Windows application. If you're up for a challenge, you could allow the user to change pool sizes on the graph and update the AS/400 to reflect those changes. Or you might want to expand this concept to other numbers on the AS/400 that would be better represented in a graphical format. As you can see, there are many possibilities.
The AS/400 has very good work management capabilities, and it can present you with lots of numerical values to show you how it's configured. However, it lacks the graphical user interface necessary to present numbers in the most meaningful way. That's where client/server programs such as the Graph Memory utility presented in this article can help. Give this utility a try for yourself and see how the pool size values on your system can take on a whole new meaning.
Robin Klima is a senior technical editor for Midrange Computing. He can be reached by E-mail at
The Graph Memory Utility
Installing the Graph Memory Utility
The Graph Memory (GRAPHMEM) utility was written using Windows for Workgroups 3.11, Microsoft Visual Basic Professional Edition Version 3.0, Client Access for Windows V3R1M1, and OS/400 V3R1. It's likely that this utility will run under different versions of these components. For example, it should work with earlier versions of Client Access or PC Support, provided they are configured to run in the Windows environment.
To implement this utility, you should start by downloading the GRAPHPKG.EXE file. This is a self-extracting file containing all of the source code and files necessary to run the utility. There are two ways to get this file. If you have access to the Internet, you can go to the Midrange Computing Downloadable Programs page at http://www.as400.com/mc/prog/ and download the file from there. If you don't have Internet access, you can dial the Midrange Computing Bulletin Board (MC-BBS) at 619-931-9909. After you log on, go to the Files Area and select MC Magazine's Published Files for AS/400.
After you have downloaded the GRAPHPKG.EXE file, place it in an empty directory on your PC (e.g., C:TEMP) and execute it to extract the files. To install the PC portion of the utility, run the SETUP.EXE from within Windows. This will create a Windows program group and an icon that you can use to run the utility.
Before you run the utility for the first time, you must install the AS/400 portion of the utility. To do this, use Client Access File Transfer (or any other file transfer utility) to transfer the MEM001CL and MEM001RG files from your PC to the AS/400. I recommend transferring these files into source files in your QGPL library. (I recommend this because the utility uses the library list of a communications job to find the programs, and QGPL is usually in the library list of most job descriptions.) Once you have transferred the files to the AS/400, you'll need to compile them. At this point, you should be ready to run the utility.
The Graph Memory Utility
Figure 1: AS/400 Memory Bar Graph
The Graph Memory Utility
Figure 2: AS/400 Memory Pie Chart
The Graph Memory Utility
Figure 3: CL Program MEM001CL
/*==================================================================*/ /* To compile: */ /* */ /* CRTCLPGM PGM(XXX/MEM001CL) SRCFILE(XXX/QCLSRC) */ /* */ /*==================================================================*/ PGM DCL VAR(&MSGID) TYPE(*CHAR) LEN(7) DCL VAR(&MSGDTA) TYPE(*CHAR) LEN(80) /* Send all errors to error handling routine */ MONMSG MSGID(CPF0000) EXEC(GOTO CMDLBL(ERROR)) /* Create work file if necessary */ CHKOBJ OBJ(QGPL/MEM001PF) OBJTYPE(*FILE) MONMSG MSGID(CPF9801) EXEC(CRTPF + FILE(QGPL/MEM001PF) RCDLEN(20) + TEXT('Graph AS/400 Memory Utility ')) CLRPFM FILE(QGPL/MEM001PF) /* Call program to load work file */ CALL PGM(MEM001RG) /* Branch around error handling routine */ GOTO CMDLBL(ENDPGM) /* Error handling routine */ ERROR: RCVMSG MSGTYPE(*EXCP) MSGDTA(&MSGDTA) MSGID(&MSGID) SNDPGMMSG MSGID(&MSGID) MSGF(QCPFMSG) MSGDTA(&MSGDTA) + MSGTYPE(*ESCAPE) ENDPGM: ENDPGM
The Graph Memory Utility
Figure 4: RPG Program MEM001RG
*=============================================================== * To compile: * * CRTRPGPGM PGM(XXX/MEM001RG) SRCFILE(XXX/QRPGSRC) * *=============================================================== *. 1 ...+... 2 ...+... 3 ...+... 4 ...+... 5 ...+... 6 ...+... 7 FMEM001PFO F 20 DISK A * I IDS I B 1 40RCVLEN I B 5 80TOTLSZ I B 9 120ERRCOD IRCVVAR DS 1388 I 17 24 SYSNAM I B 33 360#POOLS I B 37 400POOLOF I B 41 440POOLLN IPOOL DS 84 I B 5 80POOLSZ I 45 54 POOLNM * C CALL 'QWCRSSTS' C PARM RCVVAR C PARM 1388 RCVLEN C PARM 'SSTS0300'FMTNAM 8 C PARM '*YES' RESET 10 C PARM 0 ERRCOD * C MOVE *BLANKS SIZE 10 C MOVELSYSNAM NAME 10 P C EXCPTDATA C POOLOF ADD 1 X 50 * C DO #POOLS C POOLLN SUBSTRCVVAR:X POOL C ADD POOLSZ TOTLSZ C MOVE POOLSZ SIZE C MOVELPOOLNM NAME C EXCPTDATA C ADD POOLLN X C ENDDO * C MOVE *ON *INLR * OMEM001PFEADD DATA O SIZE 10 O NAME 20
The Graph Memory Utility
Figure 5: The Declaration Section of frmGraphMem
Option Explicit 'Constant declarations Const HOURGLASS = 11 Const DEFAULT = 0 Const MB_ICONEXCLAMATION = 48 Const G_DRAW = 2 Const G_PIE3D = 2 Const G_BAR3D = 4 Const G_PERCENTS = 4 Const G_ALL_DATA = 9 'Variable declarations Dim sSysName As String Dim nRtnCode As Integer Dim sMsgBuf As String Dim nMsgBufLen As Integer Dim sMsg As String Dim sMsgID As String Dim nMsgLen As Integer Dim lProcCallBack As Long Dim lSevCode As Long Dim hSelectCursor As Integer Dim sData As String Dim lPointer As Long Dim hGetfCursor As Integer Dim nRecordCount As Integer Dim lSize(16) As Long Dim sName(16) As String Dim lTotalSize As Long Dim sSystemName As String 'Function Declarations Declare Function EHNSR_SubmitCommand Lib "EHNSRW.DLL" (ByVal hWnd As Integer, ByVal sSysName As String, ByVal txtCommand As String, ByVal sMsgBuf As String, ByVal nMsgBufLen As Integer, ByVal lProcCallBack As Long) As Integer Declare Function EHNSR_GetMessage Lib "EHNSRW.DLL" (ByVal hWnd As Integer, ByVal sSysName As String, lSevCode As Long, ByVal sMsgID As String, ByVal sMsg As String, ByVal nMsgLen As Integer, ByVal sMsgBuf As String, ByVal nMsgBufLen As Integer) As Integer Sub EHNSR_StopConversation Lib "EHNSRW.DLL" (ByVal hWnd As Integer, ByVal sSysName As String) Declare Sub EHNDT_GetPtr Lib "PCSMCPY.DLL" (lpVar As Any, lpPtr As Long) Declare Function EHNRQ_Start Lib "EHNRQW.DLL" (ByVal hWnd As Integer, ByVal sSysName As String, ByVal nCommit As Integer, ByVal nBuffSize As Integer, ByVal lProcCallBack As Long) As Integer Declare Function EHNRQ_Select Lib "EHNRQW.DLL" (ByVal hWnd As Integer, ByVal sStmnt As String, ByVal nAllowUpdate As Integer, hSelectCursor As Integer, ByVal lProcCallBack As Long) As Integer Declare Function EHNRQ_Getf Lib "EHNRQW.DLL" (ByVal hWnd As Integer, ByVal hGetfCursor As Integer, ByVal sFmtItems As String, lPointer As Long, ByVal lProcCallBack As Long) As Integer Sub EHNRQ_End Lib "EHNRQW.DLL" (ByVal hWnd As Integer, ByVal lpProcCallBack As Long)
The Graph Memory Utility
Figure 6: The Form_Load Subroutine
Sub Form_Load () 'Disable most controls fraGraphType.Enabled = False optPieGraph.Enabled = False optBarGraph.Enabled = False cmdRefresh.Enabled = False GrfMemory.Visible = False 'Show the form frmGraphMem.Show DoEvents 'Generate the graph cmdRefresh_Click End Sub The Graph Memory Utility
Figure 7: The cmdRefresh_Click Subroutine
The Graph Memory Utility
Figure 8: The CreateGraph Subroutine
Sub CreateGraph () Dim nCount As Integer GrfMemory.Visible = True GrfMemory.DataReset = G_ALL_DATA GrfMemory.NumPoints = nRecordCount For nCount = 1 To nRecordCount GrfMemory.ThisPoint = nCount GrfMemory.GraphData = lSize(nCount) GrfMemory.ThisPoint = nCount If optBarGraph.Value Then GrfMemory.LabelText = RTrim$(sName(nCount)) Else GrfMemory.LegendText = sName(nCount) End If Next nCount If optBarGraph.Value Then GrfMemory.GraphType = G_BAR3D Else GrfMemory.GraphType = G_PIE3D GrfMemory.GraphStyle = G_PERCENTS End If GrfMemory.GraphTitle = "Total Memory for System " & RTrim$(sSystemName) & " = " & LTrim$(Str$(lTotalSize)) & " (K)" GrfMemory.DrawMode = G_DRAW fraGraphType.Enabled = True optBarGraph.Enabled = True optPieGraph.Enabled = True cmdRefresh.Enabled = True End Sub
The Graph Memory Utility
Figure 9: Additional Subroutines
Sub optBarGraph_Click (Value As Integer) CreateGraph End Sub Sub optPieGraph_Click (Value As Integer) CreateGraph End Sub Sub cmdExit_Click () 'Unload the form Unload Me End Sub


 More than ever, there is a demand for IT to deliver innovation. Your IBM i has been an essential part of your business operations for years. However, your organization may struggle to maintain the current system and implement new projects. The thousands of customers we've worked with and surveyed state that expectations regarding the digital footprint and vision of the company are not aligned with the current IT environment.
 TRY the one package that solves all your document design and printing challenges on all your platforms. Produce bar code labels, electronic forms, ad hoc reports, and RFID tags – without programming! MarkMagic is the only document design and print solution that combines report writing, WYSIWYG label and forms design, and conditional printing in one integrated product. Make sure your data survives when catastrophe hits. Request your trial now! Request Now.
 Forms of ransomware has been around for over 30 years, and with more and more organizations suffering attacks each year, it continues to endure. What has made ransomware such a durable threat and what is the best way to combat it? In order to prevent ransomware, organizations must first understand how it works.
 Disaster protection is vital to every business. Yet, it often consists of patched together procedures that are prone to error. From automatic backups to data encryption to media management, Robot automates the routine (yet often complex) tasks of iSeries backup and recovery, saving you time and money and making the process safer and more reliable. Automate your backups with the Robot Backup and Recovery Solution. Key features include:
 Business users want new applications now. Market and regulatory pressures require faster application updates and delivery into production. Your IBM i developers may be approaching retirement, and you see no sure way to fill their positions with experienced developers. In addition, you may be caught between maintaining your existing applications and the uncertainty of moving to something new.
 IT managers hoping to find new IBM i talent are discovering that the pool of experienced RPG programmers and operators or administrators with intimate knowledge of the operating system and the applications that run on it is small. This begs the question: How will you manage the platform that supports such a big part of your business? This guide offers strategies and software suggestions to help you plan IT staffing and resources and smooth the transition after your AS/400 talent retires. Read on to learn:
LATEST COMMENTS
MC Press Online