


"I'm older now but still running against the wind."
—Bob Seger, "Against the Wind"
It's one thing to be able to debug your own job. Life in fact would be so much easier if we only had to debug jobs in test without those pesky users bugging us. However, the real job of a programmer—the way we measure our usefulness at the end of the day—is to make our users more productive. It's as simple as that, and in order to do that job, sometimes we have to deal with a user who is having a problem we can't re-create in test.
You know the situation. The call comes in, and it's usually the person whose job is the most mission-critical job in the company. And even if it isn't, it's the most critical job to that person, and that's really the point. Anyway, the call comes in, and you hear those dreaded words, "It happened again!" What "it" is really isn't that important: It could be anything from a bad balance to a hung session to a hard halt. But whatever it is, you can't get it to happen in test to save Christmas, and you can't get it to happen even sitting at the user's desk logged on as the user, but the user can and will make it reoccur the moment you walk away.
STRSRVJOB, Savior of the Green Screen
The idea is to be able to debug the job after the problem has occurred, to at least be able to poke around in the job and see what's going on and maybe to determine what caused the problem. In the bad old days, we took a dump (pardon the expression). IBM even supplies us with a nice little command called DMPJOB that allows us to generate a massive report of the state of the system. If you feel like wading through reams of paper, it's one way of finding information, but it's typically not very effective. And even the DMPJOB command needs to be run in the job in which the error occurred. If you can get to a command line to run the DMPJOB command, you can run the debugger using the STRDBG command, and doing that will allow you to interrogate the state of all the programs on the stack
The biggest shortcoming of STRDBG is that you need to run the STRDBG command in the job you wish to debug. This is great in a development environment, but not so great when Carl Critical is calling for the third time this week about The Order Entry Problem. It's usually pretty difficult to get Carl's session to a command line so that you can enter the STRDBG command.
However, unbeknownst to many of us, way back in the previous century, IBM gave us this incredible command STRSRVJOB (seriously, this command has been around since at least V3R1 and probably even earlier). If you're not familiar with STRSRVJOB, it's the biggest single leap in debugging capabilities right up until the introduction of the Service Entry Point, which I'll address a little later. Anyway, STRSRVJOB is a magical command that allows you to specify a running job and, provided you have the correct authorities, attach to it (or "service" it).
Once you've attached to the target job, you can enter commands such as STRDBG as if you were on a command line in that job. So let's say that Carl is getting the wrong value in a variable on the screen. You can look at the variables in the program, find out which one is incorrect, and even set breakpoints where the variable in question is being loaded. If you didn't know about STRSRVJOB, just learning about it would be enough for this article. You could stop reading right here and have gotten a full day's worth of Really Cool Knowledge.
But wait! There's more!
WDSC: Debugging with a Vengeance
I love STRDBG. Without it, I would never have been able to develop some of the complex systems I wrote over the years. My productivity was enhanced by being able to set breakpoints, evaluate variables, and even watch them as I executed code.
In my opinion, it's nowhere near as difficult to write code as it is to debug code, and it's even harder to debug someone else's code, which is the task many application developers eventually face. Not only do we have to create brand-new functionality using the latest techniques, but we have to go back and figure out why program XYZ001 written back in 1993 is not working correctly. And during my green-screen development years, STRDBG was essential to that task.
But STRDBG is a little long in the tooth. Take a look at Figure 1. It's not exactly ugly, but you can see that there just isn't much real estate. As code gets a little more verbose and as (hopefully) you continue to include proper documentation, the effective code display area of 16 lines by 70 characters really is a bit squeezed.
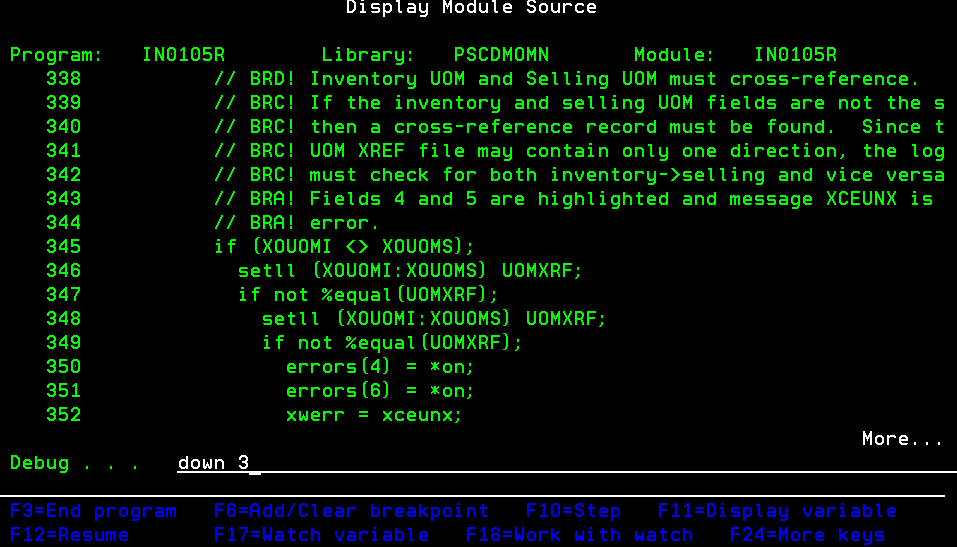
Figure 1: STRDBG isn't a bad tool, but it's not exactly cutting edge. (Click images to enlarge.)
Now compare that to Figure 2, in which I've done a little grooming of the debug perspective in WDSC to best accommodate RPG development. Note that I can see not only my breakpoints on the top, but also the contents of my variables as well as an outline of the code, which I can use as a navigation tool: Click on a subroutine or procedure name, and I'm taken right to it! I can see more than twice as many lines of syntax-colored code (and this is in a 1280x1024 window, which is relatively small by today's standards). Better yet, I can see perhaps 50 lines of code in two members side by side with my widescreen display.
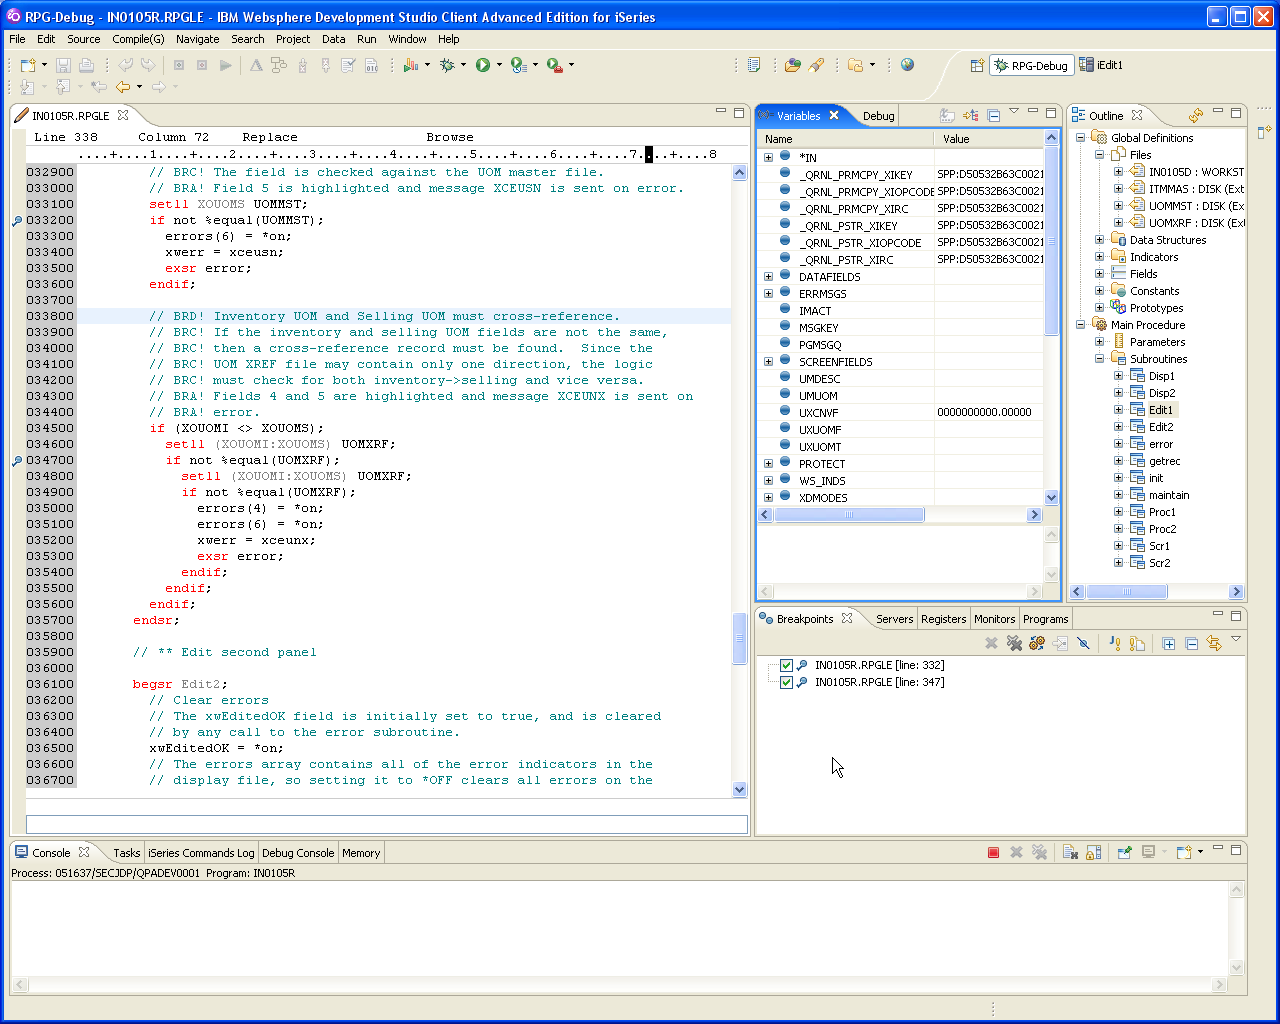
Figure 2: Be honest. Wouldn't you rather use this?
So What's the Catch?
Ah yes, the catch. The catch with WDSC is in how you debug a program. WDSC is built in the tradition of a true client/server development tool, and in that environment a developer is supposed to use something called a "launch configuration." This component has different names in different tools, but in essence it defines all the characteristics of a job to be launched—that is, started. So, by definition, this means two things: It works best with batch jobs, and you can't debug a job that's already started.
This standard WDSC debugging approach is useful if you're debugging business logic that has no user interface; you can create test scenarios to call the business logic with various parameters and submit those scenarios to batch. Small, callable unit test programs are very effective tools. You can create repositories of unit tests that will perform regression testing whenever your business logic changes; this is one of the tenets of agile programming that I really like, and it's easy to debug these tests using a batch job in WDSC.
But that still doesn't help with Carl's order-entry problem. Carl is running a green-screen program, and batch unit test scenarios don't help. WDSC does have a workaround for interactive testing. You can start an interactive session and then issue a command called STRRSESVR. One of the parameters identifies the PC workstation that WDSC is running on, and this in effect slaves the interactive job to the WDSC workbench. You can then issue commands from the workbench and run programs in the interactive session. I have to admit that I've never really gotten this technique to work, and luckily I don't have to.
Debugging Interactive Jobs the Easy Way
There are two ways to easily debug an interactive job. By far the easiest way is to use something called a Service Entry Point, or SEP. You activate an SEP in the WDSC workbench, specifying a combination of System i host, user, and program. Then, when the user invokes the program in any way on that machine (batch job, interactive job, CGI, Java toolbox...), the invoking job will be suspended and control will be given to the WDSC workbench.
Some caveats exist for SEPs. You must have the appropriate authorities to the job that you are trying to debug, and this makes sense. Also, whenever the job suspends (which is every time you step through a line of code or continue to the next breakpoint), it will attempt to switch to the Debug perspective. If you have your own Debug perspective like I do, you need to perform a little extra configuration. If there is a lot of interest on SEPs (personally, I think they're the greatest thing since STRSRVJOB), then I'll do another article devoted to them and detail some of the configuration gotchas.
The problem with SEPs, though, is that they require at least some prior knowledge of what is going to blow up. And while proper interaction with your user can often allow you to identify the program that is having problems, you sometimes get bizarre errors out of nowhere and you have to debug a problem after it has occurred.
Welcome to ad hoc job-debugging the WDSC way!
Step One: Finding the Job
The first step is to find the job you wish to debug. There are a number of ways to do this, but the easiest way is to create a Job Filter. Open your connection in Remote Systems Explorer, right-click on the iSeries Jobs object, and select New/Job Filter..., as shown in Figure 3.
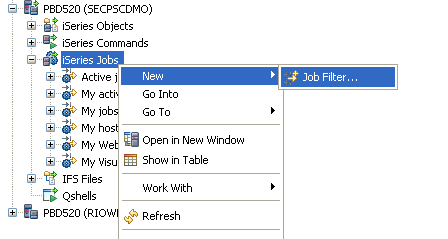
Figure 3: Use the New/Job Filter... menu option to create the filter.
You'll be prompted for various information. Since you're creating a filter to show active jobs for your critical user, simply enter that user's ID in the Job user field, and then, in the Job status check boxes, make sure that only the Active box is selected. Hit Next, and then give the filter a descriptive name, such as "Active jobs for USERID."
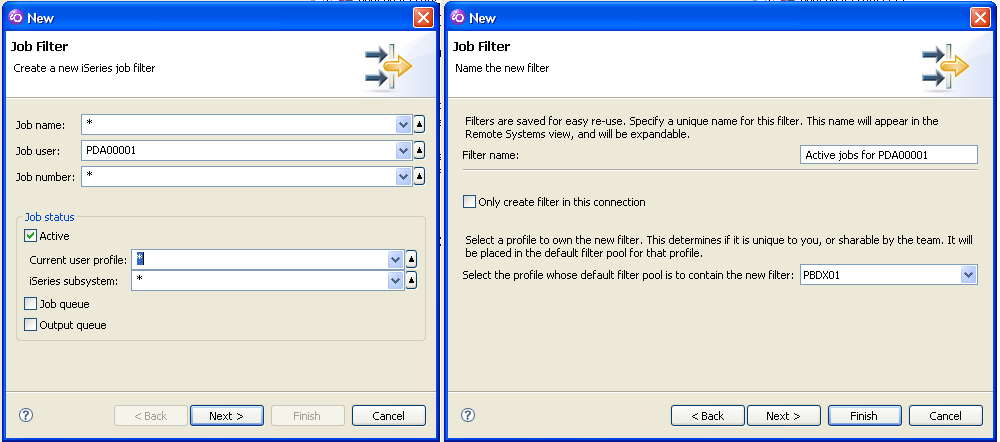
Figure 4: Select the user ID, make sure only Active jobs are selected, and name the filter.
Step Two: Debugging the Job
Now that you've created a filter for that user, you can see the jobs for that user. Just expand the filter as shown in Figure 5. You'll see all the active jobs for that user, grouped by subsystem. In my case, there's only one job and it's in QBASE, so I expand QBASE and there's the job. Next, I right-click on that job to get the context menu and select Debug (Prompt)/iSeries job to invoke the debugging dialog.
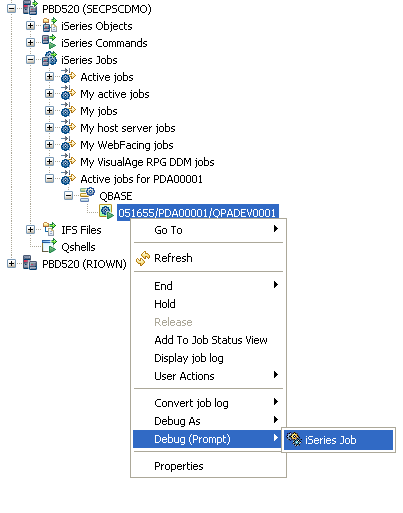
Figure 5: Expand the filter and choose Debug (Prompt) -> iSeries Job from the context menu.
The debugging dialog is prefilled with information about the selected job, but you also need to identify the program to debug. Unfortunately, I don't know of a way today to look at the program stack for the job without first putting it into debug mode. But since you need to know the program to debug before you launch the debug dialog, it's a little bit of a chicken-and-egg situation. Me, I use the green-screen to identify the program currently running and then enter that information into the debug dialog. Hit the Add button as shown on the left side of Figure 6 and then enter the program and library names as shown on the right side. Hit OK.
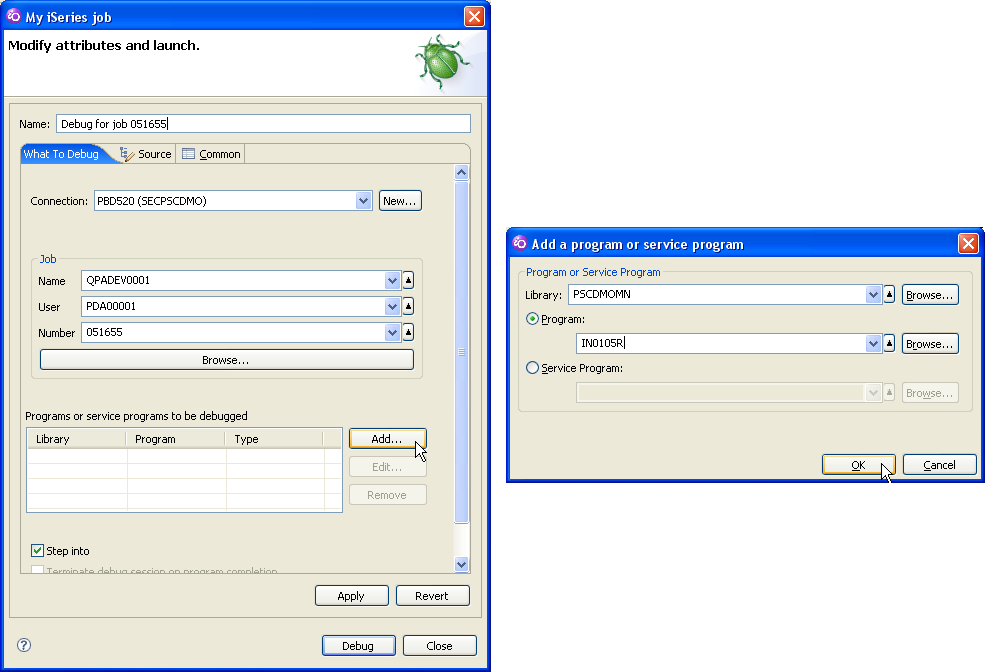
Figure 6: Click Add... to bring up the Add program dialog; enter the program and library, and press OK. Enter a descriptive name as well.
You should also enter a descriptive name in the Name field at the top of the dialog; otherwise, it will default to something generic like "my iSeries job," which is not terribly helpful when you have several of these set up. Hit the Debug button to actually debug the job.
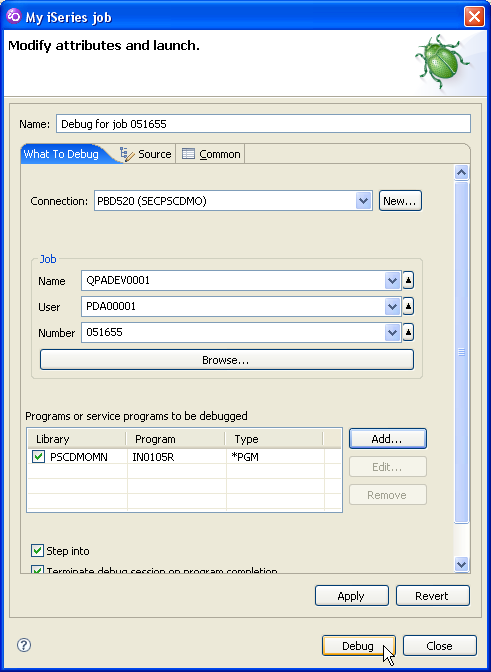
Figure 7: Click the Debug button to start the debug process.
At this point, the Debug view will come up. Here comes the confusing bit and the part that still doesn't always seem to work 100 percent correctly for me. The job will come up as shown in Figure 8, but at this point, the job is not really in debug mode. To relate it to the green-screen, it's as if the job has not yet been serviced, and you still have to actually invoke the STRSRVJOB command.
It seems that you need to execute one more step in order to truly attach the workbench to the running System i job. That step is to press the Resume button as shown in Figure 8. I know it's not terribly intuitive, but it seems to work.
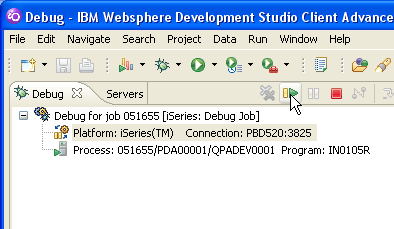
Figure 8: The Resume button actually attaches the WDSC workbench to the job.
Once you press the Resume button, you'll see a dialog like the one in Figure 9. Hit OK, and you should be able to start debugging the program. You can now set breakpoints and so on. For example, you can set a breakpoint right after the EXFMT statement in an RPG program; then, when the user hits Enter, the job should be suspended and control should be transferred to the WDSC workbench, very much like an SEP.
Figure 9: This dialog indicates that you are actually going into debug mode for the job.
I wish this I could say this technique was completely stable, but unfortunately, that has not been the case in my experience. This debugging approach seems particularly finicky if the program is already running; at times, I've had to get out of the program and exit back to a previous program or even a menu or command line before the breakpoint gets activated and the program actually stops. That somewhat defeats the purpose of debugging an active job; if you have to initiate the debug process before the user calls the program, an SEP is probably an easier solution.
However, I've gotten this technique to work a number of times and I haven't definitively answered the question of whether or not the program can be running, so I'm still hopeful. I'll keep working on it, and I'll keep you posted. And of course, if anybody wants to try it and post the results here in the forum, we'd all be grateful.
Thanks!
Joe Pluta is the founder and chief architect of Pluta Brothers Design, Inc. and has been extending the IBM midrange since the days of the IBM System/3. Joe uses WebSphere extensively, especially as the base for PSC/400, the only product that can move your legacy systems to the Web using simple green-screen commands. He has written several books, including E-Deployment: The Fastest Path to the Web, Eclipse: Step by Step, and WDSC: Step by Step. Joe performs onsite mentoring and speaks at user groups around the country. You can reach him at

Joe Pluta is the founder and chief architect of Pluta Brothers Design, Inc. He has been extending the IBM midrange since the days of the IBM System/3. Joe uses WebSphere extensively, especially as the base for PSC/400, the only product that can move your legacy systems to the Web using simple green-screen commands. He has written several books, including Developing Web 2.0 Applications with EGL for IBM i, E-Deployment: The Fastest Path to the Web, Eclipse: Step by Step, and WDSC: Step by Step. Joe performs onsite mentoring and speaks at user groups around the country. You can reach him at
MC Press books written by Joe Pluta available now on the MC Press Bookstore.
 |
Developing Web 2.0 Applications with EGL for IBM i Joe Pluta introduces you to EGL Rich UI and IBM’s Rational Developer for the IBM i platform. List Price $39.95 Now On Sale
|
|
 |
WDSC: Step by Step Discover incredibly powerful WDSC with this easy-to-understand yet thorough introduction. Now On Sale
|
|
 |
Eclipse: Step by Step Quickly get up to speed and productivity using Eclipse. Now On Sale
|


 More than ever, there is a demand for IT to deliver innovation. Your IBM i has been an essential part of your business operations for years. However, your organization may struggle to maintain the current system and implement new projects. The thousands of customers we've worked with and surveyed state that expectations regarding the digital footprint and vision of the company are not aligned with the current IT environment.
 TRY the one package that solves all your document design and printing challenges on all your platforms. Produce bar code labels, electronic forms, ad hoc reports, and RFID tags – without programming! MarkMagic is the only document design and print solution that combines report writing, WYSIWYG label and forms design, and conditional printing in one integrated product. Make sure your data survives when catastrophe hits. Request your trial now! Request Now.
 Forms of ransomware has been around for over 30 years, and with more and more organizations suffering attacks each year, it continues to endure. What has made ransomware such a durable threat and what is the best way to combat it? In order to prevent ransomware, organizations must first understand how it works.
 Disaster protection is vital to every business. Yet, it often consists of patched together procedures that are prone to error. From automatic backups to data encryption to media management, Robot automates the routine (yet often complex) tasks of iSeries backup and recovery, saving you time and money and making the process safer and more reliable. Automate your backups with the Robot Backup and Recovery Solution. Key features include:
 Business users want new applications now. Market and regulatory pressures require faster application updates and delivery into production. Your IBM i developers may be approaching retirement, and you see no sure way to fill their positions with experienced developers. In addition, you may be caught between maintaining your existing applications and the uncertainty of moving to something new.
 IT managers hoping to find new IBM i talent are discovering that the pool of experienced RPG programmers and operators or administrators with intimate knowledge of the operating system and the applications that run on it is small. This begs the question: How will you manage the platform that supports such a big part of your business? This guide offers strategies and software suggestions to help you plan IT staffing and resources and smooth the transition after your AS/400 talent retires. Read on to learn:
LATEST COMMENTS
MC Press Online