


"Nearly all men can stand adversity, but if you want to test a man's character, give him power."
--Abraham Lincoln
I thought it was time to be a little more highbrowed in my quotes. This is actually a wonderful one; Honest Abe really knew how to turn a phrase. But the direct relevance here is that, with the WebSphere Test Environment (WTE), you really do have a lot of power.
The Eclipse framework upon which WebSphere Development Studio client for iSeries (WDSci) is built really begins to live up to its promise when you start working with the debugger. Eclipse includes two primary visual concepts: views and perspectives. Views are panes within your workbench, such as an editor pane or a navigator pane. A perspective is a group of related panes, with the sizes and locations of the panes predefined. When you switch to a new perspective, the panes for that perspective are automatically opened.
When the debugger kicks in, it automatically switches to the Debug perspective. Your workbench changes quite a bit, but at the same time, the parts that you need to continue working (the editors) are still available. That's because the Debug perspective includes the editor view. The editors move a little bit so that you can have other things in your display, but they are still accessible and still act just the way they did when you were writing the application in the Java perspective. This consistency in the midst of change is a hallmark of Eclipse.
In today's column, I present the WTE's capabilities and give you a glimpse into how the WTE makes debugging applications so much easier.
Debugging Web Applications: Then and Now
What we get with the WTE is a completely new paradigm for testing. I hate the word "paradigm," because it's so overused, but it's entirely appropriate in this case. With WDSci, you look at developing Web applications in a completely new way.
Debugging Then
In the olden days, before WDSci, creating a Web application went something like this:
- Create a JavaServer Page (JSP). This usually involved using a text editor, because few HTML editors were JSP-aware. The best JSP editors were in fact text editors with JSP extensions. However, you had no idea what your JSP would look like when it ran in the Web server. In most cases, the best you could do was rename it to .html and look at it in a browser. Today, some editors are more JSP-aware, but very few can perform functions like syntax checking the Java code embedded in the JSP.
- Create Beans. These Beans would be used to send data to the JSP. You might use a text editor to edit the source and then run javac to compile the Bean. Either you would put a main() method in your Bean so you could test it from the command line, or you would write a separate program just to test the Beans. In the best case, you would have an IDE like VisualAge for Java (VAJ) that would at least allow you to test the Beans a little more easily.
- Test the JSP and the Bean together. In this case, you might create special initialization code in the Bean that would tell it to return dummy data if called directly from the JSP. Then, you would copy both the JSP and the Bean up into the appropriate directories on your Web application server and start to test.
- Identify JSP syntax errors. If you had one of these, you wouldn't see it until you tried to test the JSP. And depending on the severity of the syntax error and the logging characteristics of the server, it could take a little while to identify the actual error. Once you did find it, you could then fire up your JSP editor, make the changes you thought would fix the problem, and then upload the JSP back to your Web application server. (Mapped drives helped here, by the way.) Then, you returned to step three.
- Identify JSP logic errors. Here, you might be calling the wrong method of the Bean. This was harder to test, because it depended on how smart you made your Beans. Remember, the Bean is not being populated with real data; you're faking the data out in the initialization routine. So you usually just tried to get the basics working and move on to the servlet.
- Create a servlet. You had no way to test this by itself. You simply wrote the servlet and tried to keep as much logic in the Beans as possible. In fact, your best design included a servlet proxy that actually performed the work of the servlet, and the servlet itself simply handed off the POST and GET requests to the servlet proxy. This actually wasn't a bad design, but it certainly made testing a pain. But at least it was finally time to try the whole application.
- Test servlet, Bean, and JSP. Next, you'd compile the servlet, upload it to the Web application server, and then try to run it. At this point, the servlet, Bean, or JSP could crash. Any of them might have serious errors that cause exceptions, which you'd probably be able to diagnose only by poring through the error dump. Depending on the application server and its configuration, the errors might show up in the browser itself or in log files somewhere in the IFS (the locations being completely different for different application servers). But let's say you get past these errors.
- Identify logic problems. At this point, the only way to debug the servlet is to put in some sort of debugging code. In some cases, you could pass debug data to a Bean that is displayed in the JSP only when a certain switch is on. More than likely, however, you'd be reduced to using System.out.println() to dump information to the log. Remember the old DEBUG print statements in RPG programs? Well, System.out.println() is the same thing for servlets.
Then, when something went wrong, you'd need to correct it. If the problem was in a JSP, you went to your JSP editor. If the bug was in a Bean or a servlet, you'd probably go to your Java IDE (unless you were using a text editor for that, too!). With Java classes, you'd compile the class and export it. In either case, you'd then upload it back to the Web server. You'd refresh your page and try again. And after many repetitions of this, maybe you'd get a simple application to work. Or maybe you'd seriously consider changing professions altogether.
And I haven't even discussed all the other Web components--from Cascading Style Sheets (CSS) to JavaScript to images--that you might need for your Web application. Depending on the tools you were using, you might need completely different programs to edit each of these.
Debugging Now
Today, debugging is completely different thanks to WDSci and the WTE. With WDSci, you can edit all of your source code within a single, context-aware, syntax-checking environment, with color-coded editors for each source type. Once you've created the application, you can test it right on your desktop within the WTE, setting breakpoints right in your source just like any IDE you're used to (if you haven't used an IDE, think of it as a cross between SEU and STRISDB, but with colors and point-and-click capabilities).
First, let's take a quick look at editing. Figure 1 shows how the WDSci workbench can be configured to edit multiple members at the same time. The code shown is what I use when I am teaching introductory servlet programming: a simple servlet, Bean, and JSP.

Figure 1: The workbench can have multiple members open simultaneously.
The figure as shown doesn't do the workbench justice, because I reduced the size of the window to 800x600 in order to make it more readable for this column. Expanded to the normal 1280x1024, there is nearly three times as much space, which allows you to easily view all the pieces of the application.
This view is also where you set breakpoints. Not only in the servlet and Bean, as you might expect, but also in the JSP source! You can identify a place in the JSP where you expect certain results and then stop its execution right there.
Set a breakpoint by double-clicking in the column left of the for loop in the JSP. That will return a screen like that in Figure 2, with a breakpoint set on the selected line.
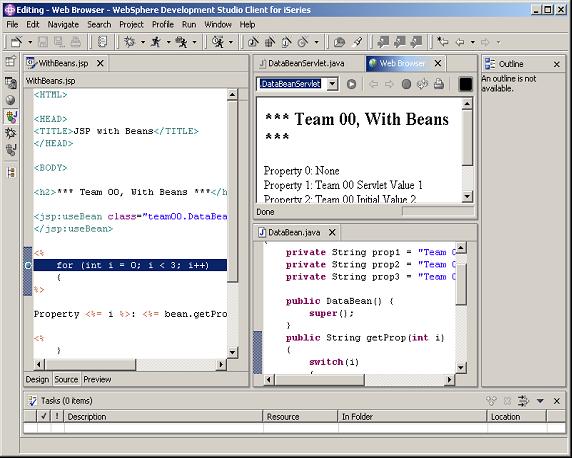
Figure 2: The breakpoint shows up as a small blue ball to the left of the source statement.
The next step is to run the application on a WTE server. To do that, just right-click on the servlet and select Debug on Server, as shown in Figure 3.
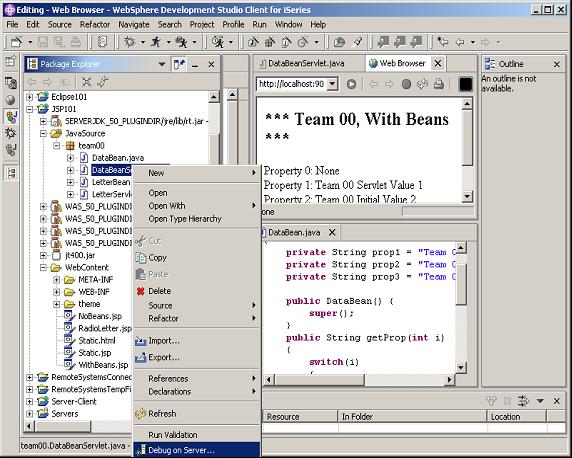
Figure 3: Right-clicking on the servlet gives you the option to Debug on Server.
You will then be prompted for the server to use. With WDSci, your choices are WebSphere Application Server (WAS) Version 4, WAS Version 5 (Express or Base), and various versions of Tomcat. You can run locally on your desktop or on a remote server, or you can attach to an already running server. For testing, I like to use a local Express environment. Express is the lowest common denominator among the WebSphere products, and it works for everything except EJBs, so it's perfect for testing. The prompt screen will look like that in Figure 4, and if you've already configured a test server, that server will probably be pre-selected.
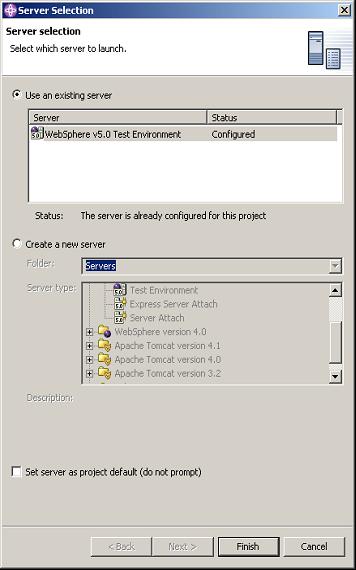
Figure 4: This prompt allows you to select the server under which your application will run.
If you're going to use Tomcat, you'll need to have a Tomcat server already set up either locally on your machine or somewhere on your network. The wizard will prompt you for the location of Tomcat and the location of your Java Virtual Machine (JVM).
If you're using a WebSphere server, once you press Finish, the workbench does all the work for you. It creates a test environment if you haven't already created one, publishes your current work to that test environment, starts the Web application server, and then invokes the selected servlet, all automatically. It takes a few moments, and it's impressive to watch as all the messages scroll by in the console window. A lot of work is being done under the covers!
Once the servlet is invoked, the debugger takes over. Among its features is the ability to step through your entire servlet. So the first thing you will normally see is the prompt that allows you to either single-step into the servlet or resume processing until the next breakpoint. This prompt is shown in Figure 5.
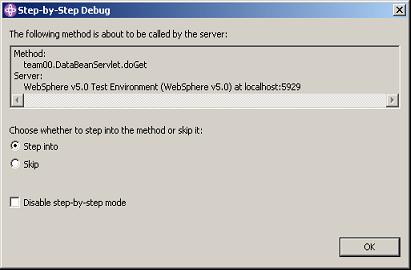
Figure 5: This prompt allows you to step into the servlet or continue to a breakpoint.
By selecting Skip and pressing the OK button, you'll continue on. You will get a similar prompt when the JSP is first invoked. If you skip through that prompt as well, the next thing you will see will be the breakpoint display. This is a different perspective, called the Debug perspective, as shown in Figure 6.
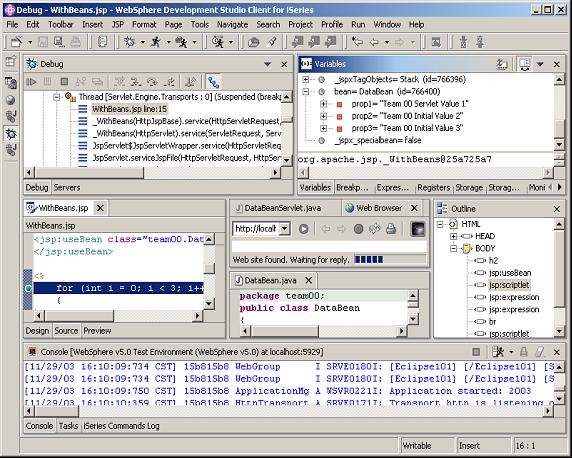
Figure 6: The Debug perspective includes editor views and the Variables view.
Again, I've reduced the workbench to 800x600 for this column, so the windows are a bit cramped. I recommend at least 1280x1024 for real development work. But even in this small space, you can see the many pieces of the perspective.
All of your editors are still available and are shown in the middle third of the screen. But several new views are also available. The bottom third of the screen is the console, which details the actions occurring in the Web application server. This is typically the output of println() statements, and you can use this as a diagnostic tool just like in the olden days. But the real debugging is done in the top third of the workbench. The left side shows the status of the application server. All the application threads are available for review there, and you can interrogate them as needed. The view in the upper right corner, though, is the most useful. It allows you to check the contents of variables.
In this case, since the breakpoint is in the JSP, all of the variables local to the JSP are available. This includes any Beans that you've instantiated using the jsp:useBean tag. Specifically, the Bean named "Bean" is available, and I have expanded it to show the instance variables in that Bean. At this point, you can even change the contents of variables to see how such changes affect your application.
A browser window will also be made available. It will overlay the active editor, and you can see the results of your Web application. In Figure 6, that pane is in the very center of the screen indicated by the Web Browser tab. It is quite small, and you can't really see much. By double-clicking on that tab, you can temporarily expand the browser view to fill the workbench, as shown in Figure 7.
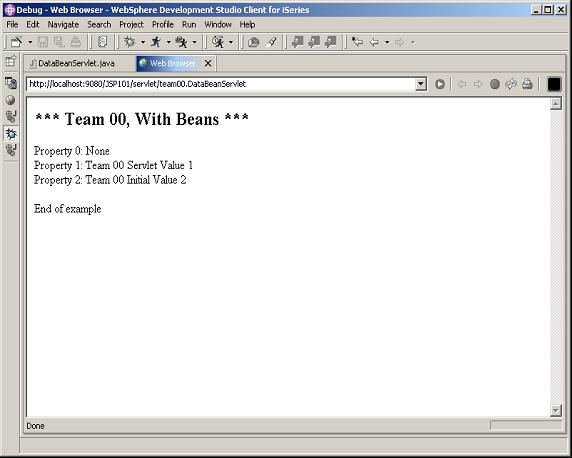
Figure 7: The Web Browser view (or any other view) can be expanded to fill the workbench.
Double-clicking on the tab again returns the workbench to its previous configuration. The workbench is entirely interactive. In the editor panes, you can change the source and save it, then refresh your browser view to see the changes. This sort of immediate change would require a little more work with a less integrated environment. At a minimum, to change the servlet, you'd have to switch to your editor, make the change, compile the code, and upload it to your Web application server, at which point you could then refresh your browser to see the changes. With the WTE, all of that is done without leaving the IDE.
The Joy of Working on the Desktop
The real beauty of this approach is that you can do all of this without ever leaving your desktop. You don't even have to be attached to the iSeries; you can do everything on a laptop or your home machine. Once you've gotten the application up and running, you can use the standard J2EE deployment mechanisms to deploy your application on the real server. And while you may hear me complain about J2EE deployment in a production environment, it's really very easy to use for initial deployment when coupled with a test environment like this. You can do all your testing on your workstation, and you only have to deploy the application once.
Not only that, but the WDSci team continues to work on the ability to hot-deploy changes to a running application server without having to go through all the hassles of the J2EE process. This will make it feasible to use WDSci to deploy the changes that are required in a real production environment, something the J2EE specifications do not handle well. If you're interested in hearing more about how to do this, please make a comment in the discussion area for this column, and I'll see if I can include more details in a subsequent article.
The Icing on the Cake
There is one little piece that doesn't pertain directly to the WTE, but it's really important in the iSeries world. We've recently run an article about the distributed debugger and how it can be used to debug native HLL (RPG and COBOL) applications on the iSeries from within the WDSci workbench. This capability is one more step toward a full, end-to-end debugging capability. I don't think you can yet set a breakpoint in an HLL program and have it stop when the servlet invokes that program, but you can at least run the program from the workbench in batch mode to test it. This means that you can develop and test not only all the Java-based pieces of your Web application, but also the HLL components that make the iSeries such a powerful business logic server, all without leaving the WDSci workbench. You can also edit the other Web components, such as XML files, Cascading Style Sheets (CSS), JavaScript files, and even images. The integration of all these capabilities is what makes WDSci the easiest Web application development environment I've ever used.
One more compliment for the WDSci team: I just updated my workbench from 5.1.0 to 5.1.1 (or maybe it's 5.1.0.1; I get the numbering confused). It was a simple two-step process: I went to the Update Manager and queried for updates, and then I applied them. This process was entirely automated and worked without a hitch. This makes keeping your tools up-to-date much easier.
Am I biased? You bet. But you'll remember that it wasn't so long ago that I was bemoaning the fact that Web applications were getting more and more chaotic and that IBM's direction on Web application development seemed unfocused. With WDSci and especially the WTE, it's clear that IBM is making a concerted effort to allow Web application developers to have all the components they need at their fingertips, in a coherent, integrated package. And the fact that iSeries developers get all this stuff for free, well, that's really the icing on the cake.
Joe Pluta is the founder and chief architect of Pluta Brothers Design, Inc. He has been working in the field since the late 1970s and has made a career of extending the IBM midrange, starting back in the days of the IBM System/3. Joe has used WebSphere extensively, especially as the base for PSC/400, the only product that can move your legacy systems to the Web using simple green-screen commands. Joe is also the author of E-Deployment: The Fastest Path to the Web and Eclipse: Step by Step. You can reach him at

Joe Pluta is the founder and chief architect of Pluta Brothers Design, Inc. He has been extending the IBM midrange since the days of the IBM System/3. Joe uses WebSphere extensively, especially as the base for PSC/400, the only product that can move your legacy systems to the Web using simple green-screen commands. He has written several books, including Developing Web 2.0 Applications with EGL for IBM i, E-Deployment: The Fastest Path to the Web, Eclipse: Step by Step, and WDSC: Step by Step. Joe performs onsite mentoring and speaks at user groups around the country. You can reach him at
MC Press books written by Joe Pluta available now on the MC Press Bookstore.
 |
Developing Web 2.0 Applications with EGL for IBM i Joe Pluta introduces you to EGL Rich UI and IBM’s Rational Developer for the IBM i platform. List Price $39.95 Now On Sale
|
|
 |
WDSC: Step by Step Discover incredibly powerful WDSC with this easy-to-understand yet thorough introduction. Now On Sale
|
|
 |
Eclipse: Step by Step Quickly get up to speed and productivity using Eclipse. Now On Sale
|


 More than ever, there is a demand for IT to deliver innovation. Your IBM i has been an essential part of your business operations for years. However, your organization may struggle to maintain the current system and implement new projects. The thousands of customers we've worked with and surveyed state that expectations regarding the digital footprint and vision of the company are not aligned with the current IT environment.
 TRY the one package that solves all your document design and printing challenges on all your platforms. Produce bar code labels, electronic forms, ad hoc reports, and RFID tags – without programming! MarkMagic is the only document design and print solution that combines report writing, WYSIWYG label and forms design, and conditional printing in one integrated product. Make sure your data survives when catastrophe hits. Request your trial now! Request Now.
 Forms of ransomware has been around for over 30 years, and with more and more organizations suffering attacks each year, it continues to endure. What has made ransomware such a durable threat and what is the best way to combat it? In order to prevent ransomware, organizations must first understand how it works.
 Disaster protection is vital to every business. Yet, it often consists of patched together procedures that are prone to error. From automatic backups to data encryption to media management, Robot automates the routine (yet often complex) tasks of iSeries backup and recovery, saving you time and money and making the process safer and more reliable. Automate your backups with the Robot Backup and Recovery Solution. Key features include:
 Business users want new applications now. Market and regulatory pressures require faster application updates and delivery into production. Your IBM i developers may be approaching retirement, and you see no sure way to fill their positions with experienced developers. In addition, you may be caught between maintaining your existing applications and the uncertainty of moving to something new.
 IT managers hoping to find new IBM i talent are discovering that the pool of experienced RPG programmers and operators or administrators with intimate knowledge of the operating system and the applications that run on it is small. This begs the question: How will you manage the platform that supports such a big part of your business? This guide offers strategies and software suggestions to help you plan IT staffing and resources and smooth the transition after your AS/400 talent retires. Read on to learn:
LATEST COMMENTS
MC Press Online