


This series started with the pie chart, a useful tool that graphically summarizes data. However, pie charts only provide a "snapshot" of a moment. This tip focuses on bar charts, which show the data's evolution.
In the previous TechTip, I provided an example of a pie chart similar to the one below, which shows, with a little humor, the most common uses of cell phones:
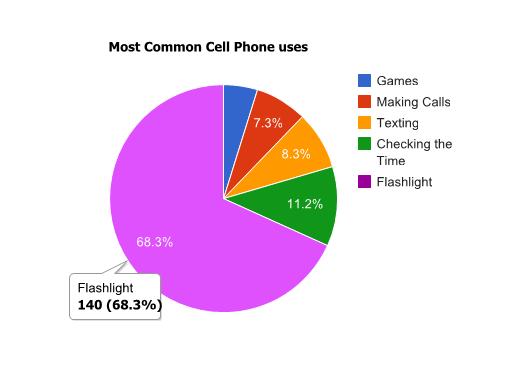
Figure 1: This pie chart shows how most people use their cell phones!
However, if I wanted to show how those uses evolved through time, it would be impossible to do so with only a pie chart. That's where the Bar Chart API comes in: it provides an easy way to graphically summarize period-related sets of values, as depicted in Figure 2:
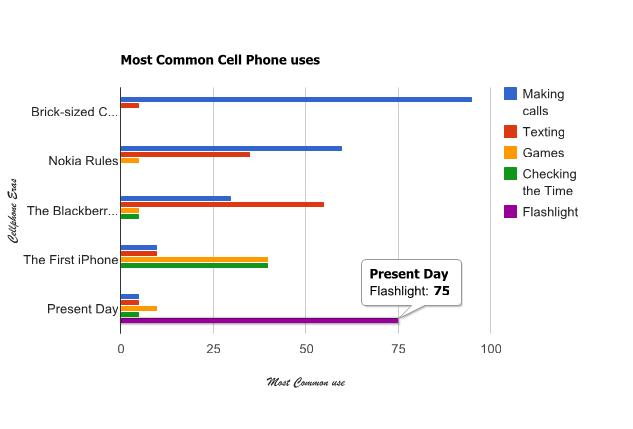
Figure 2: The uses for cell phones have evolved! (Click image to enlarge.)
The method used will remain the same throughout the series (read the previous tip before continuing, because I won't explain the methodology in this tip), so let's start by analyzing the template:
/$Header
<!DOCTYPE html PUBLIC "-//W3C//DTD XHTML 1.0 Strict//EN" "http://www.w3.org/TR/xhtml1/DTD/xhtml1-strict.dtd">
<html xmlns="http://www.w3.org/1999/xhtml">
<head>
<meta http-equiv="content-type" content="text/html; charset=utf-8"/>
<title>
/%PageTitle%/
</title>
<script src="https://www.google.com/jsapi"></script>
<script>
google.load("visualization", "1", {packages:["corechart"]});
google.setOnLoadCallback(drawChart);
function drawChart() {
var data = new google.visualization.DataTable();
data.addColumn('string', 'col1');
/$Column
data.addColumn('/%ColumnType%/', '/%ColumnTitle%/');
/$TotalRows
data.addRows(/%TotalRows%/);
/$FirstRow
data.setValue(/%RowNbr%/, 0, '/%RowTitle%/');
/$Row
data.setValue(/%RowNbr%/, /%ColNbr%/, /%CellValue%/);
/$Footer
var chart = new google.visualization.BarChart(document.getElementById('chart_div'));
chart.draw(data, {width: /%width%/,
height: /%height%/,
title: '/%ChartTitle%/',
vAxis: {title: '/%VAxisTitle%/'},
hAxis: {title: '/%HAxisTitle%/'}
});
}
</script>
</head>
<body>
<div></div>
</body>
</html>
The Header and Footer sections do basically the same as in the previous tip, but there are a few additional sections. These new sections are directly linked to the way the chart works; while the pie chart needed only two columns (one for the label and the other for the value), here the number of columns must be dynamic, as it depends on the number of different values within each set (the "cell phone uses" in Figure 2). However, the first column is still fixed; it's used to store the label of each value. This is why there are new sections named Column and Total Rows. Just like before, the number of rows is dynamic, but now there are two types of rows; for each set of data (the "cell phone eras" in Figure 2), there's a label (the section FirstRow, which provides the name of the "cell phone era" in Figure 2—Brick-Sized Cell Phones, for instance) and a dynamic number of values (the Row section, which corresponds to the percentages of each cell phone use throughout the "cell phone eras").
In order to accommodate these structural changes, the procedure GenBarChart (see QRPGLESRC/GENCHRT in the downloadable source code) also differs a bit from the GenPieChart: there are new entry parameters for the column titles and the vertical and horizontal axis titles. All the other parameters are the same as before, but I've changed some of the names in order to provide independence from the pie chart; check out P_BarRowDS, for instance. In terms of the code itself, the most notable change is related to the rows:
// FirstRow And Row Sections
For W_RowIdx = 1 to C_BarMaxRows;
If P_BarRowDS(W_RowIdx).RowTitle = *Blanks;
Leave;
EndIf;
// Update the Row variables
updHtmlVar('RowNbr' : %Char(W_RowIdx-1));
updHtmlVar('RowTitle' : %Trim(P_BarRowDS(W_RowIdx).RowTitle));
// Write the FirstRow section
WrtSection('FirstRow');
For W_ColIdx = 1 to C_BarMaxColumns;
If P_BarRowDS(W_RowIdx).Cell(W_ColIdx).CellValue= *Zeros;
Leave;
EndIf;
updHtmlVar('ColNbr' : %Char(W_ColIdx));
updHtmlVar('CellValue' : %Char(
P_BarRowDS(W_RowIdx).Cell(W_ColIdx).CellValue));
// Write the Row section
WrtSection('Row');
EndFor;
EndFor;
Since the P_BarRowDS parameter is now two-dimensional (picture this array as a spreadsheet), I need two cycles to extract all the values from the "cells". The outer cycle checks whether there is data on the row by looking for a title. If a title is found, the section FirstRow is written and the processing continues; otherwise, it leaves the outer cycle and continues to the Footer section. But the title by itself is not enough. I need values. The inner cycle starts by checking whether the "cell" contains a value and leaves the inner cycle if it doesn't, returning control to the outer cycle. If there's a value, then a Row section is written. The rest of the code is similar to the GenPieChart's, with the addition of the Axis Titles. I chose to include these as a reminder of the customization allowed by the Google API. Be sure to read the Configuration Options for more details and customization possibilities.
Finally, let's briefly review the TSTGENBAR1 sample program. It generates the bar chart depicted in Figure 2 by filling the P_BarColumnDS and P_BarRowDS parameters values one by one:
(…)
Clear P_BarColumnDS;
P_BarColumnDS(1).ColumnType = 'number';
P_BarColumnDS(1).ColumnTitle = 'Making calls';
(…)
Clear P_BarRowDS;
P_BarRowDS(1).RowTitle = 'Brick-sized Cellphones';
P_BarRowDS(1).Cell(1).CellValue = 95;
P_BarRowDS(1).Cell(2).CellValue = 5;
(…)
Note that both arrays are being cleared before usage. This is a good practice, because the GenBarChart procedure relies on null values (*Zeros or *Blanks) to determine if there's more data.
The next step is invoking the procedure:
If GenBarChart(P_PageTitle : P_ChartTitle :
P_BarColumnDS : P_BarRowDS :
P_Width : P_Height :
P_VAxisTitle : P_HAxisTitle :
P_FileName : P_ErrorDesc ) = *Off;
This is performed with an IF statement in order to produce the appropriate response: either a Web page with the chart or a message to the user with the description of the error.
Naturally, there's plenty of room for improvement, both in the GenBarChart procedure itself and in the sample programs. If you have any doubts or suggestions, feel free to email me!
As usual, the complete source code is provided. You can download it here.
I hope you enjoyed reading this tip as much as I enjoyed writing it! The next one will cover something completely different but (I hope) equally interesting: the Geo Map API.

Rafael Victória-Pereira has more than 20 years of IBM i experience as a programmer, analyst, and manager. Over that period, he has been an active voice in the IBM i community, encouraging and helping programmers transition to ILE and free-format RPG. Rafael has written more than 100 technical articles about topics ranging from interfaces (the topic for his first book, Flexible Input, Dazzling Output with IBM i) to modern RPG and SQL in his popular RPG Academy and SQL 101 series on mcpressonline.com and in his books Evolve Your RPG Coding and SQL for IBM i: A Database Modernization Guide. Rafael writes in an easy-to-read, practical style that is highly popular with his audience of IBM technology professionals.
Rafael is the Deputy IT Director - Infrastructures and Services at the Luis Simões Group in Portugal. His areas of expertise include programming in the IBM i native languages (RPG, CL, and DB2 SQL) and in "modern" programming languages, such as Java, C#, and Python, as well as project management and consultancy.
MC Press books written by Rafael Victória-Pereira available now on the MC Press Bookstore.
 |
Evolve Your RPG Coding: Move from OPM to ILE...and Beyond Transition to modern RPG programming with this step-by-step guide through ILE and free-format RPG, SQL, and modernization techniques. List Price $79.95 Now On Sale
|
|
 |
Flexible Input, Dazzling Output with IBM i Uncover easier, more flexible ways to get data into your system, plus some methods for exporting and presenting the vital business data it contains. Now On Sale
|
|
 |
SQL for IBM i: A Database Modernization Guide Learn how to use SQL’s capabilities to modernize and enhance your IBM i database. Now On Sale
|


 More than ever, there is a demand for IT to deliver innovation. Your IBM i has been an essential part of your business operations for years. However, your organization may struggle to maintain the current system and implement new projects. The thousands of customers we've worked with and surveyed state that expectations regarding the digital footprint and vision of the company are not aligned with the current IT environment.
 TRY the one package that solves all your document design and printing challenges on all your platforms. Produce bar code labels, electronic forms, ad hoc reports, and RFID tags – without programming! MarkMagic is the only document design and print solution that combines report writing, WYSIWYG label and forms design, and conditional printing in one integrated product. Make sure your data survives when catastrophe hits. Request your trial now! Request Now.
 Forms of ransomware has been around for over 30 years, and with more and more organizations suffering attacks each year, it continues to endure. What has made ransomware such a durable threat and what is the best way to combat it? In order to prevent ransomware, organizations must first understand how it works.
 Disaster protection is vital to every business. Yet, it often consists of patched together procedures that are prone to error. From automatic backups to data encryption to media management, Robot automates the routine (yet often complex) tasks of iSeries backup and recovery, saving you time and money and making the process safer and more reliable. Automate your backups with the Robot Backup and Recovery Solution. Key features include:
 Business users want new applications now. Market and regulatory pressures require faster application updates and delivery into production. Your IBM i developers may be approaching retirement, and you see no sure way to fill their positions with experienced developers. In addition, you may be caught between maintaining your existing applications and the uncertainty of moving to something new.
 IT managers hoping to find new IBM i talent are discovering that the pool of experienced RPG programmers and operators or administrators with intimate knowledge of the operating system and the applications that run on it is small. This begs the question: How will you manage the platform that supports such a big part of your business? This guide offers strategies and software suggestions to help you plan IT staffing and resources and smooth the transition after your AS/400 talent retires. Read on to learn:
LATEST COMMENTS
MC Press Online