


Calling a gauge (yes, like the gas meter on your car, for example) a "chart" is a bit farfetched, but that doesn't make it less useful. Use it to get the real-time system status of your System i!
This TechTip series started with rather "normal" charts, but then it jumped to the Geo Map Chart, which is a bit unusual. The Gauge Chart takes it to the next level of strangeness: it's not exactly a chart, like the pie or the bar charts, but this useful display enables you to immediately figure out if a given number is within the expected limits.
The downside is that if you have multiple values to represent, you'll get multiple gauges from the API. This is not really a bad thing, but it can be a constraint if the limits for the values you want to represent are not the same. This will become clearer on the second example I'll present later on. The mechanics of this procedure are the same as the previous ones, so be sure to read the other TechTips of the series, if you haven't already done so. I'll start by reviewing the template, because it will determine the way the code is written (you'll find this template in folder GCHARTS/Templates, under the name Gauge.tmpl):
/$Header
<!DOCTYPE html PUBLIC "-//W3C//DTD XHTML 1.0 Strict//EN" "http://www.w3.org/TR/xhtml1/DTD/xhtml1-strict.dtd">
<html xmlns="http://www.w3.org/1999/xhtml">
<head>
<meta http-equiv="content-type" content="text/html; charset=utf-8"/>
<title>
/%PageTitle%/
</title>
<script src="http://www.google.com/jsapi"></script>
<script>
google.load('visualization', '1', {packages: ['gauge']});
</script>
<script>
function drawVisualization() {
// Create and populate the data table.
var data = new google.visualization.DataTable();
data.addRows(/%TotalRows%/);
data.addColumn('string', 'Label');
data.addColumn('number', 'Value');
/$Row
data.setValue(/%RowNbr%/, 0, '/%RowTitle%/');
data.setValue(/%RowNbr%/, 1, /%RowValue%/);
/$OptionsBegin
var options = {
/$Option
'/%OptionTitle%/': /%OptionValue%/
/$OptionsEnd
};
/$Footer
// Create and draw the visualization.
new google.visualization.Gauge(document.getElementById('visualization')).
draw(data, options);
}
google.setOnLoadCallback(drawVisualization);
</script>
</head>
<body style="font-family: Arial;border: 0 none;">
<div></div>
</body>
</html>
This is probably the simplest template so far: all the sections are quite straightforward; if you've read the previous tips of this series, you'll be familiar with them, as they were used before. Note that this template doesn't have a "Column" section; that fact is directly linked to the data format expected by the Gauge API. Actually, I'd recommend reading all the API's documentation carefully before continuing, because I won't explain all the details.
The RPG code of the GenGaugeChart procedure, which you'll find in the QRPGLESRC/GENCHRT source member of the downloadable code, is also quite simple. The only bit that is slightly more complex is the handling of P_OptionDS. In the final HTML file, the contents of the Options variable have to be separated by commas. The difficult part here is making sure that the options contained in the P_OptionDS array are passed to that variable with the right number of commas; if you indicate only one option, then no comma is needed after that option, but if you fill two or more entries of P_OptionDS, then the program must add a comma at the end of each option, except the last. That's exactly what this piece of code extracted from GenGaugeChart does:
(…)
// Write each option on a separate line
For W_Idx = 1 to C_MaxOptions;
If P_OptionDS(W_Idx).OptionTitle = *Blanks;
Leave;
EndIf;
// Update the Option variables
updHtmlVar('OptionTitle' :
%Trim(P_OptionDS(W_Idx).OptionTitle));
// If this is not the last option of the array and the next
// option was filled in, add a comma after the value
If (((W_Idx + 1) < C_MaxOptions) And
(P_OptionDs(W_Idx + 1).OptionTitle <> *Blanks));
P_OptionDS(W_Idx).OptionValue =
%Trim(P_OptionDS(W_Idx).OptionValue) + ',';
EndIf;
updHtmlVar('OptionValue' :
%Trim(P_OptionDS(W_Idx).OptionValue));
// Write the Option section
WrtSection('Option');
EndFor;
The rest of the procedure's code is simple and similar to previously explained procedures.
Now, let's get to the fun part: the examples. The first one (QRPGLESRC/TSTGENGAU1) is very simple: it adds only one row of data (a label and a value), thus producing one gauge:
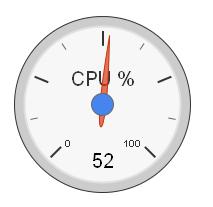
Figure 1: We've created a gauge chart!
Ok, that looks nice, but it's very basic! Let me take it a step further: what if the "CPU %" reading was the real CPU percentage of your system? Nice, right? Well, that's what TSTGENGAU2 does! It uses the Retrieve System Status (QWCRSSTS) API, which is the "program-friendly" version of the WRKSYSSTS command. You'll find its documentation here for V5R4M0 and here for V7R1M0. (Note: I always compile my code to V5R4M0, just in case your system hasn't been upgraded to the latest version yet, even though I use V7R1.)
Of the many pieces of information the QWCRSSTS API returns, I'm only going to use the ASP occupation percentage and the CPU used percentage. If you're curious to know how this was implemented, check out the MISC_PR copy member in QCPYLESRC. There you'll find the API declared as a procedure with the ExtPGM keyword and the SysStsDS data structure used to store the three bits of information I use in TSTGENGAU2.
This sample program is vaguely similar to the previous one, but it has some important differences: so far, I've been using a data area to store the system name (you'd have to change it to your system name in order to automatically launch the HTML files). I chose this way of getting the system name to keep things as simple as possible. Now, however, I'm using this API to retrieve the system name, along with the ASP and CPU percentages. These three values are then passed on to GenGaugeChart in order to produce two gauges (one for the ASP and another for the CPU) and a nice title for the page. Go ahead, run the TSTGENGAU2 program and see for yourself! You'll notice that the gauges now have a colored scale, ranging from green to red. This is achieved by setting the proper options, which determine not only where each colored section begins, but also which number values correspond to green, yellow, and red. I've used the HTML notation for the three colors, obtained from the site I mentioned in the previous tip. I've also set the minimum and maximum values for the gauge; since both ASP and CPU are represented as percentage, I used 0 and 100, but you can set any values you'd like.
As with the previous Google Chart APIs I've presented in this series, this chart offers a lot of customization possibilities, so be sure to read the configuration options section of the documentation and play with them in the Visualization Playground.
As usual, the complete source code is provided. You can download it here. That's it for now. In my next TechTip, I'll return to a more "normal" type of chart: the Column Chart!

Rafael Victória-Pereira has more than 20 years of IBM i experience as a programmer, analyst, and manager. Over that period, he has been an active voice in the IBM i community, encouraging and helping programmers transition to ILE and free-format RPG. Rafael has written more than 100 technical articles about topics ranging from interfaces (the topic for his first book, Flexible Input, Dazzling Output with IBM i) to modern RPG and SQL in his popular RPG Academy and SQL 101 series on mcpressonline.com and in his books Evolve Your RPG Coding and SQL for IBM i: A Database Modernization Guide. Rafael writes in an easy-to-read, practical style that is highly popular with his audience of IBM technology professionals.
Rafael is the Deputy IT Director - Infrastructures and Services at the Luis Simões Group in Portugal. His areas of expertise include programming in the IBM i native languages (RPG, CL, and DB2 SQL) and in "modern" programming languages, such as Java, C#, and Python, as well as project management and consultancy.
MC Press books written by Rafael Victória-Pereira available now on the MC Press Bookstore.
 |
Evolve Your RPG Coding: Move from OPM to ILE...and Beyond Transition to modern RPG programming with this step-by-step guide through ILE and free-format RPG, SQL, and modernization techniques. List Price $79.95 Now On Sale
|
|
 |
Flexible Input, Dazzling Output with IBM i Uncover easier, more flexible ways to get data into your system, plus some methods for exporting and presenting the vital business data it contains. Now On Sale
|
|
 |
SQL for IBM i: A Database Modernization Guide Learn how to use SQL’s capabilities to modernize and enhance your IBM i database. Now On Sale
|


 More than ever, there is a demand for IT to deliver innovation. Your IBM i has been an essential part of your business operations for years. However, your organization may struggle to maintain the current system and implement new projects. The thousands of customers we've worked with and surveyed state that expectations regarding the digital footprint and vision of the company are not aligned with the current IT environment.
 TRY the one package that solves all your document design and printing challenges on all your platforms. Produce bar code labels, electronic forms, ad hoc reports, and RFID tags – without programming! MarkMagic is the only document design and print solution that combines report writing, WYSIWYG label and forms design, and conditional printing in one integrated product. Make sure your data survives when catastrophe hits. Request your trial now! Request Now.
 Forms of ransomware has been around for over 30 years, and with more and more organizations suffering attacks each year, it continues to endure. What has made ransomware such a durable threat and what is the best way to combat it? In order to prevent ransomware, organizations must first understand how it works.
 Disaster protection is vital to every business. Yet, it often consists of patched together procedures that are prone to error. From automatic backups to data encryption to media management, Robot automates the routine (yet often complex) tasks of iSeries backup and recovery, saving you time and money and making the process safer and more reliable. Automate your backups with the Robot Backup and Recovery Solution. Key features include:
 Business users want new applications now. Market and regulatory pressures require faster application updates and delivery into production. Your IBM i developers may be approaching retirement, and you see no sure way to fill their positions with experienced developers. In addition, you may be caught between maintaining your existing applications and the uncertainty of moving to something new.
 IT managers hoping to find new IBM i talent are discovering that the pool of experienced RPG programmers and operators or administrators with intimate knowledge of the operating system and the applications that run on it is small. This begs the question: How will you manage the platform that supports such a big part of your business? This guide offers strategies and software suggestions to help you plan IT staffing and resources and smooth the transition after your AS/400 talent retires. Read on to learn:
LATEST COMMENTS
MC Press Online