


Some of the information stored in our ERPs can be geo-referenced. With the Geo Map chart, you can analyze this information like never before: in an actual customizable map. Keep reading to find out how!
This time, I'm not going to show you the classic business-type charts that even MS Excel can provide. The Geo Map API is a totally different chart type, engineered to allow you to display your data in ways the charts (the pie and bar) presented in the previous TechTips of this series could never achieve.
As usual, this API is quite simple, but be sure to read all the documentation before continuing, because I won't go over every detail or possible configuration. I'll just show a couple of examples, depicting the practical effect of different configuration options. Unlike the previous charts I've presented, the Geo Map has two distinct ways of working. You can provide a set of strings containing the location name, which can be an address, a country name, a region name, or a U.S. metropolitan area code (more details in the API's documentation). I'll call this one "Location Name Mode." Alternatively, you can provide a set of GPS coordinates that pinpoint your locations, which will be the "GPS Mode." Even though the latter way of working has some advantages—like accuracy, for instance—it also limits the options. I'll get back to the pros and cons of each way of working later on, when I explain the sample programs. Initially, I tried to bundle up these two approaches to the chart in a single procedure, but it lost much of the simplicity and clarity I like my code to have, so I created two separate procedures, GenMapChart and GenMapGPSChart. I'll focus on the "Location Name Mode" in this TechTip and explain the "GPS Mode" on the next.
So let's get started!
This chart requires only two columns—location name and value—but it allows the customization of the "tooltip text" (or "hover text," as Google calls it) by adding an additional column of data. As you probably guessed by now, the location names and respective values are going into the chart as rows. Here's the template I created for this mode (it's the GeoMap.Tmpl file of the GCHARTS/Templates folder):
/$Header
<!DOCTYPE html PUBLIC "-//W3C//DTD XHTML 1.0 Strict//EN" "http://www.w3.org/TR/xhtml1/DTD/xhtml1-strict.dtd">
<html xmlns="http://www.w3.org/1999/xhtml">
<head>
<meta http-equiv="content-type" content="text/html; charset=utf-8" />
<title>/%PageTitle%/</title>
<script src="http://www.google.com/jsapi"></script>
<script>
google.load('visualization', '1', {packages: ['geomap']});
function drawVisualization() {
var data = new google.visualization.DataTable();
data.addRows(/%TotalRows%/);
data.addColumn('string', 'Location');
data.addColumn('number', '/%ColumnTitle%/');
/$HoverColumn
data.addColumn('string', 'hovertext');
/$Row
data.setValue(/%RowNbr%/, 0, '/%RowTitle%/');
data.setValue(/%RowNbr%/, 1, /%RowValue%/);
/$HoverRow
data.setValue(/%RowNbr%/, 2, '/%RowHover%/');
/$OptionsBegin
var options = {
/$Option
'/%OptionTitle%/': /%OptionValue%/
/$OptionsEnd
};
/$Footer
var geomap = new google.visualization.GeoMap(
document.getElementById('visualization'));
geomap.draw(data, options);
}
google.setOnLoadCallback(drawVisualization);
</script>
</head>
<body style="font-family: Arial;border: 0 none;">
<div></div>
</body>
</html>
The Header, Row, and Footer sections are basically the same as usual. I had to add some new sections to handle the optional hover text functionality. They are HoverColumn and HoverRow. Finally, I'm introducing a new way of handling the chart options, implemented here in the OptionsBegin, Option, and OptionsEnd sections.
As for the procedure itself, check the QRPGLESRC/GENCHRT source member of the downloadable code for GenMapChart. The first thing you may notice is that the parameter list includes a new data structure: P_OptionDS. As the name implies, this is going to be used to pass the options to the chart. In the previous tips (in order to keep things simple), I was passing some options as individual parameters (width and height, for instance). Now, you can indicate any parameter you want, just by setting the values of the OptionTitle and OptionValue fields of the P_OptionDS data structure, which is also an array, in order to handle multiple options. The maximum number of options is currently set to 100, but you can change the C_MaxOptions constant in the QCPYLESRC/GENCHRT_PR source member to a number that better suits your needs. 100 represents many more options than any of the charts provide, so feel free to customize it.
The code of the procedure is again similar to the previous ones, but it includes a few additional lines to handle the optional hover text feature and the dynamic options. Instead of going over that code, I'm going to explain how to use it, by reviewing the QRPGLESRC/TSTGENMAP1 and QRPGLESRC/TSTGENMAP2 sample program. Because of space constraints, I won't reproduce the code here. Please review it yourself. You'll find it in the downloadable code zip file.
Now, back to TSTGENMAP1: In this program, I have set the column title and assigned some (totally fictitious) values to a few European countries. The outcome is depicted below:
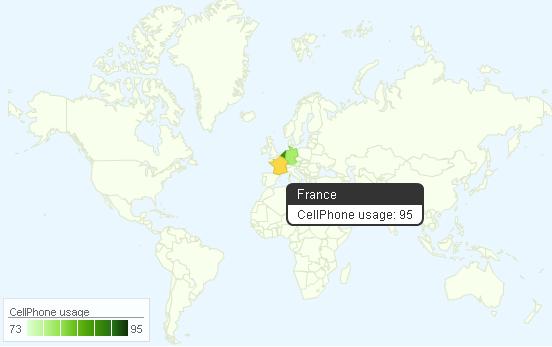
Figure 1: This result isn't particularly useful.
Well, it doesn't look great, does it? By default, the Geo Map chart presents a world map and a green gradient legend. While this might be OK for certain situations, it's clearly not ideal for this one. How can the chart be adapted to better match this situation? By using the configuration options of the API and the P_OptionDS array. The same data is used on QRPGLESRC/TSTGENMAP2, but the options used here make a huge difference. Here's the final result:
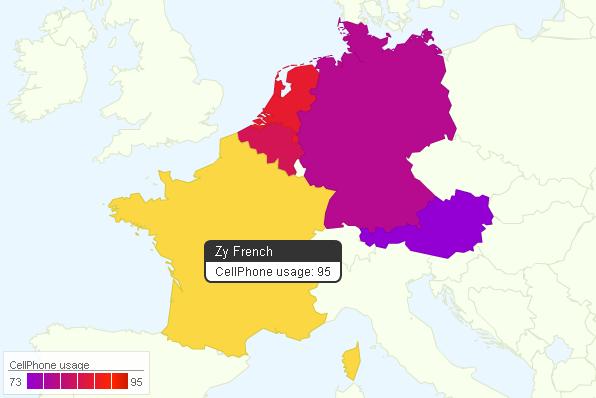
Figure 2: That's better!
Note that the map zooms in on the countries and the hover text now displays user-defined text instead of the country name. Also, I've used the "colors" option to customize the legend color scale. Depending of the data, you can tune the options to enhance the final chart, thus achieving a great result that most chart-generating tools can't provide!
The next TechTip will continue to analyze the Geo Map Chart, explaining the "GPS Mode" and sharing some insights on chart customization. As usual, I provide the complete source code and I'm available to answer any questions you may have.

Rafael Victória-Pereira has more than 20 years of IBM i experience as a programmer, analyst, and manager. Over that period, he has been an active voice in the IBM i community, encouraging and helping programmers transition to ILE and free-format RPG. Rafael has written more than 100 technical articles about topics ranging from interfaces (the topic for his first book, Flexible Input, Dazzling Output with IBM i) to modern RPG and SQL in his popular RPG Academy and SQL 101 series on mcpressonline.com and in his books Evolve Your RPG Coding and SQL for IBM i: A Database Modernization Guide. Rafael writes in an easy-to-read, practical style that is highly popular with his audience of IBM technology professionals.
Rafael is the Deputy IT Director - Infrastructures and Services at the Luis Simões Group in Portugal. His areas of expertise include programming in the IBM i native languages (RPG, CL, and DB2 SQL) and in "modern" programming languages, such as Java, C#, and Python, as well as project management and consultancy.
MC Press books written by Rafael Victória-Pereira available now on the MC Press Bookstore.
 |
Evolve Your RPG Coding: Move from OPM to ILE...and Beyond Transition to modern RPG programming with this step-by-step guide through ILE and free-format RPG, SQL, and modernization techniques. List Price $79.95 Now On Sale
|
|
 |
Flexible Input, Dazzling Output with IBM i Uncover easier, more flexible ways to get data into your system, plus some methods for exporting and presenting the vital business data it contains. Now On Sale
|
|
 |
SQL for IBM i: A Database Modernization Guide Learn how to use SQL’s capabilities to modernize and enhance your IBM i database. Now On Sale
|


 More than ever, there is a demand for IT to deliver innovation. Your IBM i has been an essential part of your business operations for years. However, your organization may struggle to maintain the current system and implement new projects. The thousands of customers we've worked with and surveyed state that expectations regarding the digital footprint and vision of the company are not aligned with the current IT environment.
 TRY the one package that solves all your document design and printing challenges on all your platforms. Produce bar code labels, electronic forms, ad hoc reports, and RFID tags – without programming! MarkMagic is the only document design and print solution that combines report writing, WYSIWYG label and forms design, and conditional printing in one integrated product. Make sure your data survives when catastrophe hits. Request your trial now! Request Now.
 Forms of ransomware has been around for over 30 years, and with more and more organizations suffering attacks each year, it continues to endure. What has made ransomware such a durable threat and what is the best way to combat it? In order to prevent ransomware, organizations must first understand how it works.
 Disaster protection is vital to every business. Yet, it often consists of patched together procedures that are prone to error. From automatic backups to data encryption to media management, Robot automates the routine (yet often complex) tasks of iSeries backup and recovery, saving you time and money and making the process safer and more reliable. Automate your backups with the Robot Backup and Recovery Solution. Key features include:
 Business users want new applications now. Market and regulatory pressures require faster application updates and delivery into production. Your IBM i developers may be approaching retirement, and you see no sure way to fill their positions with experienced developers. In addition, you may be caught between maintaining your existing applications and the uncertainty of moving to something new.
 IT managers hoping to find new IBM i talent are discovering that the pool of experienced RPG programmers and operators or administrators with intimate knowledge of the operating system and the applications that run on it is small. This begs the question: How will you manage the platform that supports such a big part of your business? This guide offers strategies and software suggestions to help you plan IT staffing and resources and smooth the transition after your AS/400 talent retires. Read on to learn:
LATEST COMMENTS
MC Press Online