


Did you know DB2 Web Query has output options to send your reports directly to Excel? Learn about some features that will help you easily and quickly build spreadsheets.
The Excel spreadsheet is an immensely popular tool for analyzing business data. It has a vast array of features and functions for manipulating and representing information in various ways to help you understand your business data and make more informed decisions going forward. Consequently,many users and analysts go to great lengths to extract data from their production database and copy it into Excel. If your business data happens to be stored in a DB2 for i database, there's simply no easier way to push this information down to Excel than by using IBM DB2 Web Query for i.
In this multi-part TechTip, you will learn about a number of DB2 Web Query features that you can use to make those Excel reports look exactly like you want them to—with the click of the Run button!
Various Excel Output Formats
First let's talk about the different options you have when it comes to generating Excel output. The report development tool for DB2 Web Query is a tool called InfoAssist. With InfoAssist, you can also create charts, dashboards, and compound documents, but this article will focus on generating reports that go to Excel output format.
The format tab of InfoAssist shows you the various output types. If you click on the down arrow in the Excel icon, you will see a list of Excel output format options you can choose from. See Figure 1.
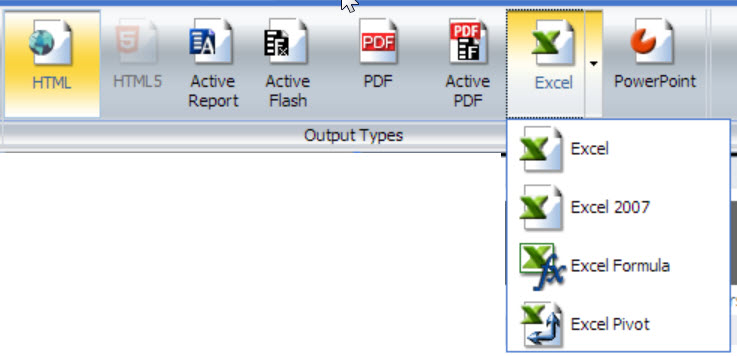
Figure 1: Choose your Excel output format.
An explanation of each output type is provided below:
- Excel—Generates a spreadsheet in the .XLS format
- Excel 2007—Generates a spreadsheet in the .XLSX format
- Excel Formula—Generates a spreadsheet in the .XLS format. Cells that contain values that were calculated during report execution time (those based on define fields, compute fields, subtotals, and totals) will have the appropriate Excel formula, not the value itself.
- Excel Pivot—Generates a spreadsheet in the .XLS format with pivot table processing
For our report, we want to generate Excel 2007 (XLSX) output, so that output type is selected. For the report layout, we would like to query the ORDERS table in our DB2 for i database and sort by the Product Type, Product Category, and Product Name columns. For the report measure, we would like to show the Quantity sold. From InfoAssist, our example report definition is shown in Figure 2.
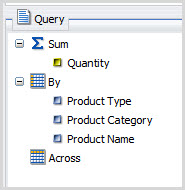
Figure 2: Your report definition is set.
Before saving the report, click the Run button to make sure it looks the way you want. The results are shown in Figure 3.
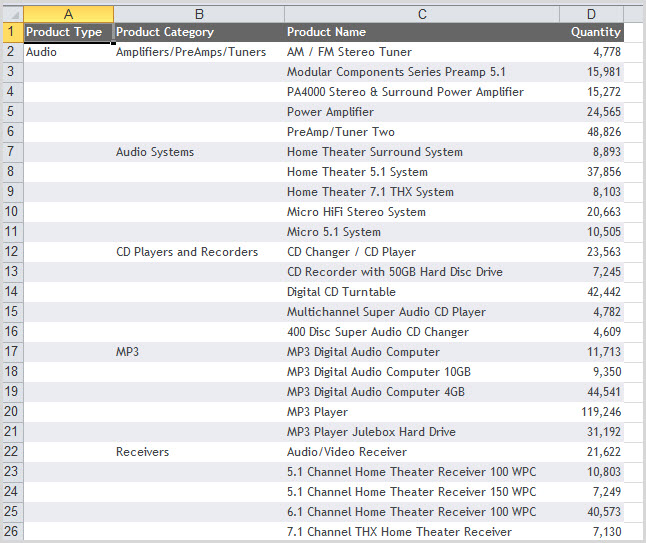
Figure 3: Are the report results what you want them to be?
Repeat Sort Values
By default, DB2 Web Query does not show repeating sort values in a Summary report. This is not always ideal for spreadsheet output. In many cases, spreadsheet users like to show every value in all rows and columns. This default behavior is easily remedied by a feature called (strangely enough) Repeat Sort Values. As shown in Figure 4, this feature is found by selecting the Format tab and expanding the Features group.

Figure 4: Select Format > Features to get Repeat Sort Values functionality.
As you can see in Figure 5, running the report reveals that all values for the Product Type, Product Category, and Product Name columns are shown in the spreadsheet.
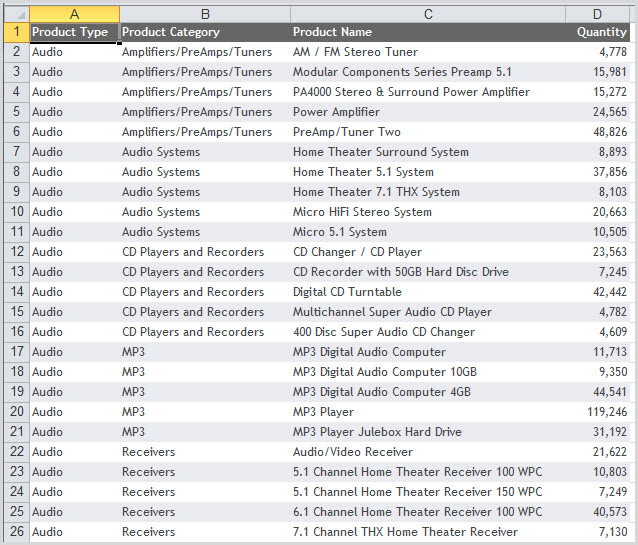
Figure 5: Repeated Sort Values shows values in all columns.
Sort Across
The report is looking good but is far from finished. We would also like a breakdown of the countries in which we sold our products. But rather than including the Country database field as a sort by (where the data for each unique country is shown as a row in the report), we would like to show the country data in report columns. This technique of pivoting the data means we can see the numbers for the various countries side by side. This is accomplished by selecting Country as an Across field in our report and is shown in Figure 6 and Figure 7.
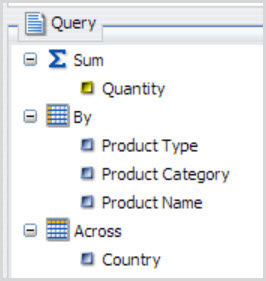
Figure 6: The report definition now includes Across.
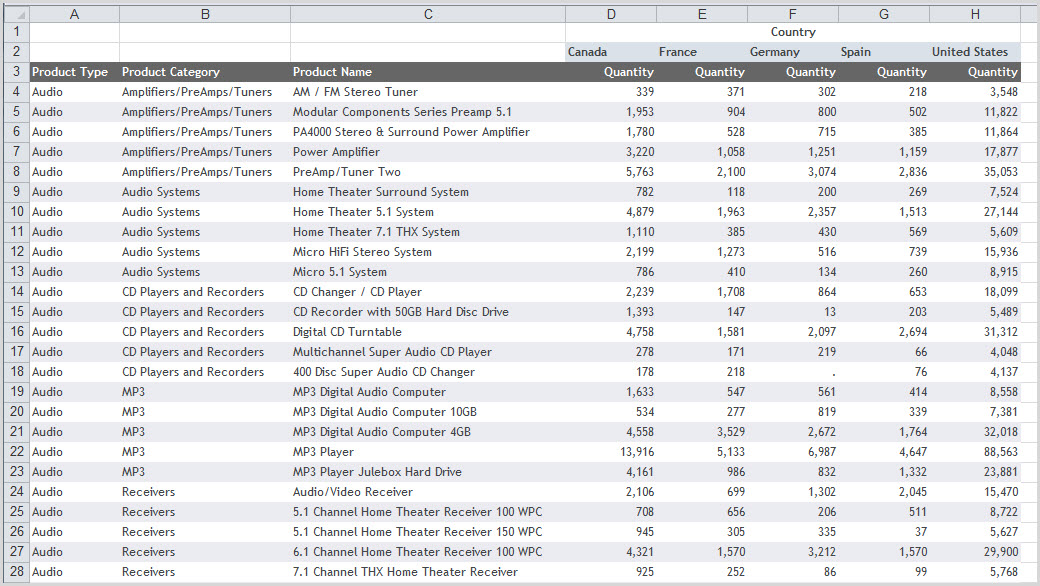
Figure 7: These are the report results with Across.
Stack Measures
As you can see, sort Across is a very useful feature because you can juxtapose the measure columns and do easier side-by-side comparisons of the numbers. However, it increases the number of measure columns in the report by a factor of the number of unique sort across values. Since there is only one measure column, this is not really an issue in the current version of our report. But consider what happens when you add four more measure columns to the report as shown in Figure 6.
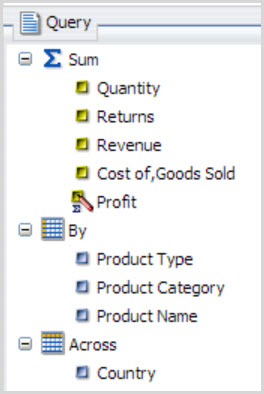
Figure 8: The report definition now includes more measure columns.
The report now has five measure columns. Because our Orders table has five unique values for Country, this means that the report will have 25 (5 x 5) measure columns! As you can see in Figure 9, when this report is run, the report is immensely wider and much more difficult to view and comprehend.
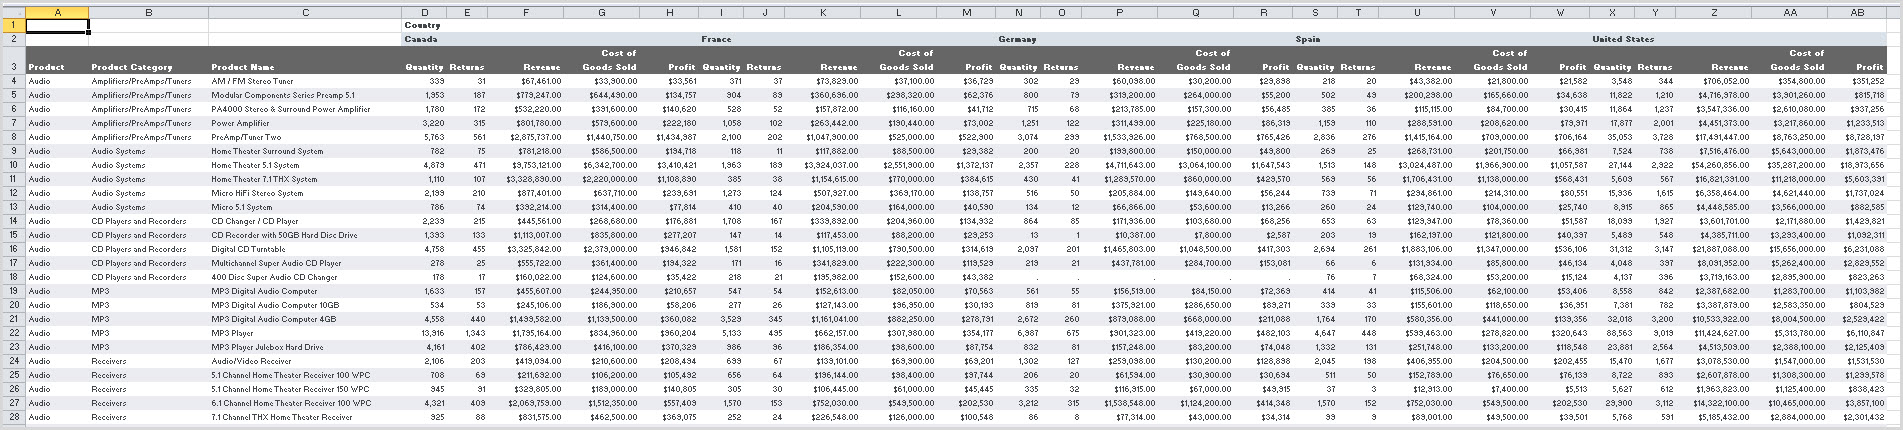
Figure 9: With this many columns, the report results are hard to read.
What to do, what to do? This report has the information that's needed; you really don't want to remove any of it, but it's quite overwhelming and hard to digest. Never fear! Reports that have multiple measures and Across fields are great candidates for an InfoAssist feature called Stack Measures. This option also performs a pivot of the data—only now the measures are stacked so that they're shown vertically. This can really tidy up these wide reports!
To stack the measures in the report, go to the Format tab, expand the Features group, and select the Stack Measure icon. Once the icon is illuminated, the feature is activated.
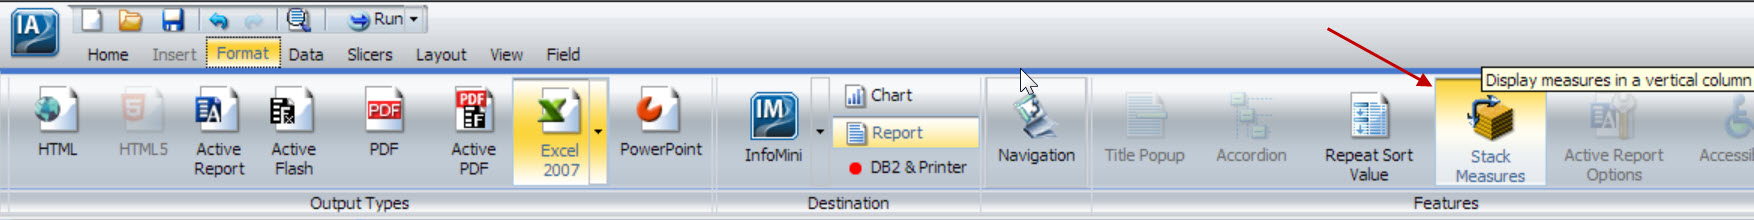
Figure 10: Turn on the Stack Measures feature.
Now that the measures are displayed in vertical columns, the report becomes longer (vertically), but it's much easier to read and comprehend.
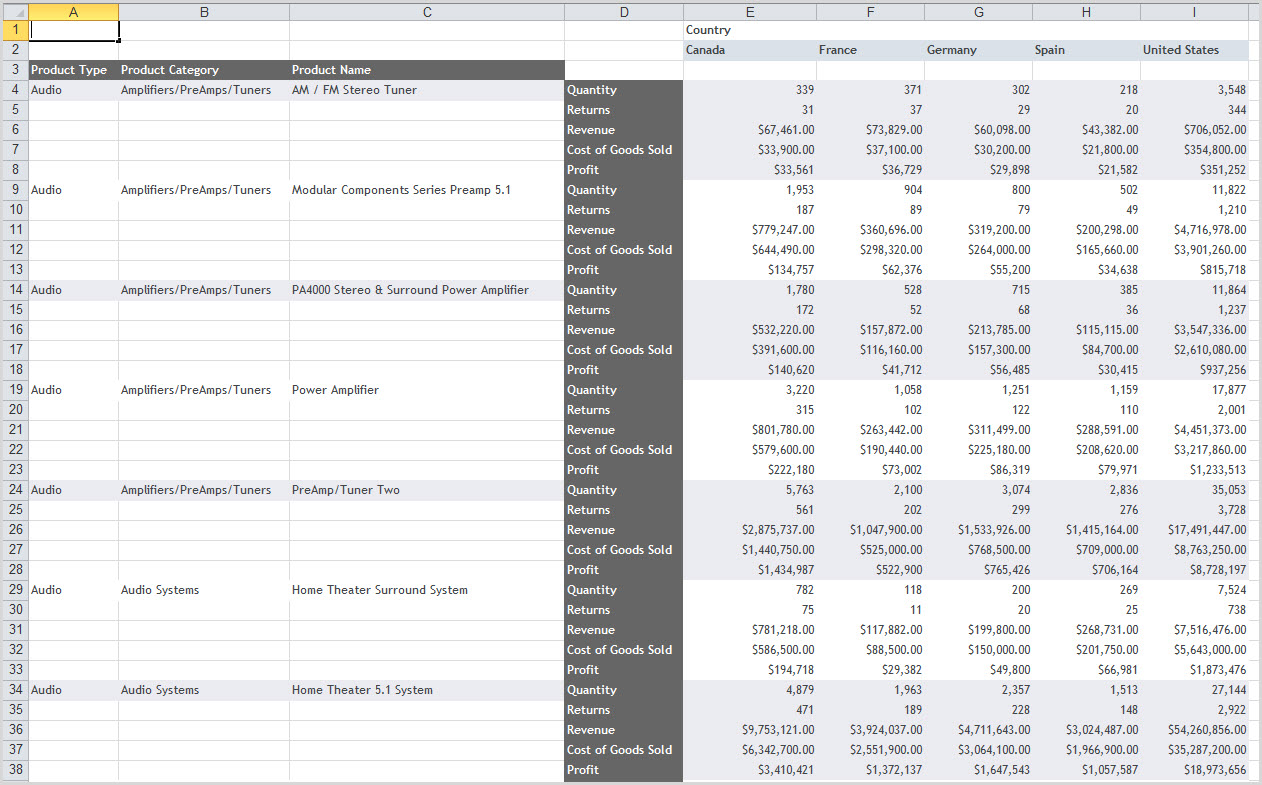
Figure 11: Report results with stacked measures are easier to read.
Change Theme
DB2 Web Query comes shipped with a large number of style sheets that can be used to customize the color, font, size, borders, background colors, and other attributes. You can select one of these style sheets by changing the theme of the report. The selected theme will be applied to the Excel spreadsheet. To change the theme, select the Home tab, expand the Reports group, and click the Theme icon as shown in Figure 12.
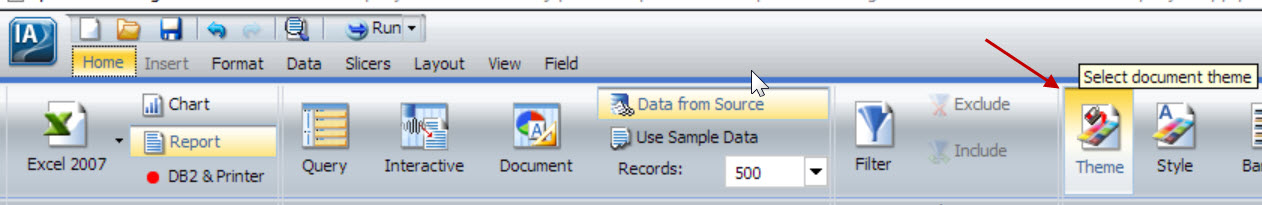
Figure 12: Change the report's theme.
A dialogue window with all of the provided DB2 Web Query themes is presented. Select a theme and click Open. As shown in Figure 11, for our example, we select the ENBlue_DarkComp.sty theme.
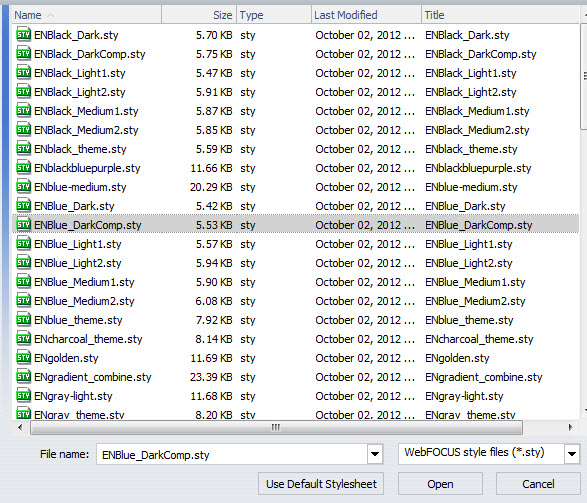
Figure 13: Select a theme.
As you can see in Figure 14, running the reports shows that the theme is applied to the generated spreadsheet.
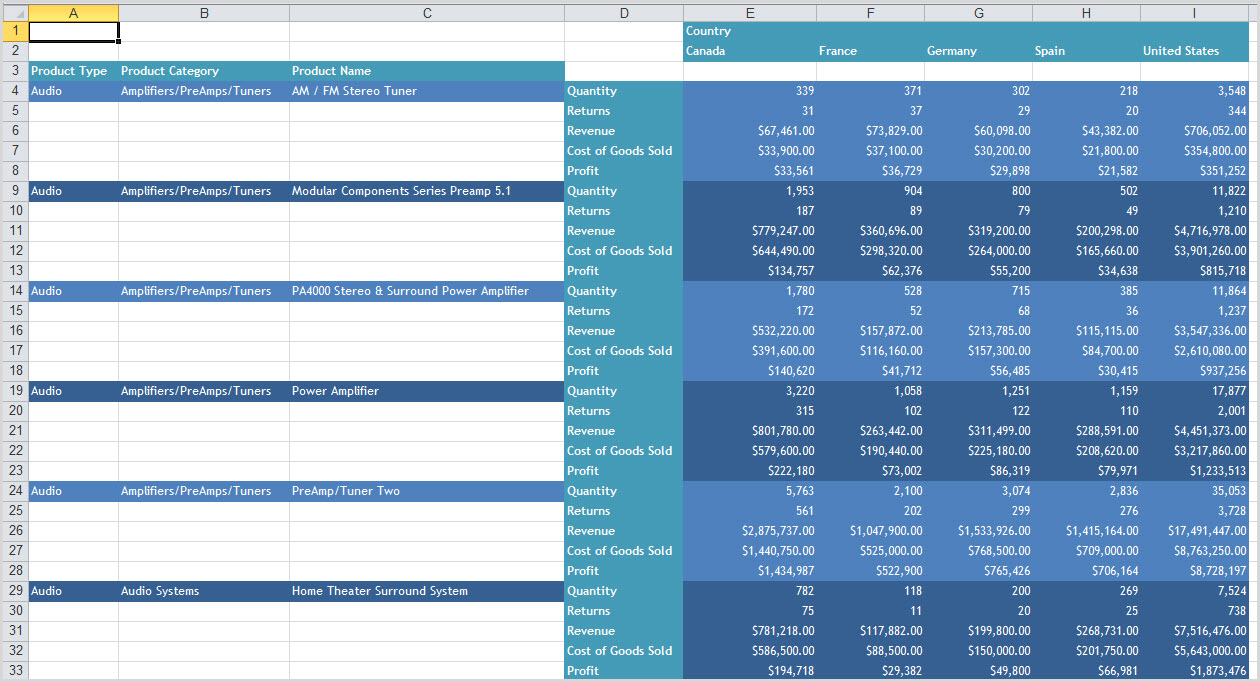
Figure 14: The report results show the new theme.
In fact, as a report developer, you can select a default theme for all report definitions that you create. This will eliminate the need to select your preferred theme for every report you create. To change the default theme, click on the IA icon at the top left of the tool bar and click the Options button. At the Options dialog window, click the Browse button next to Document Theme. This is demonstrated in Figure 15.
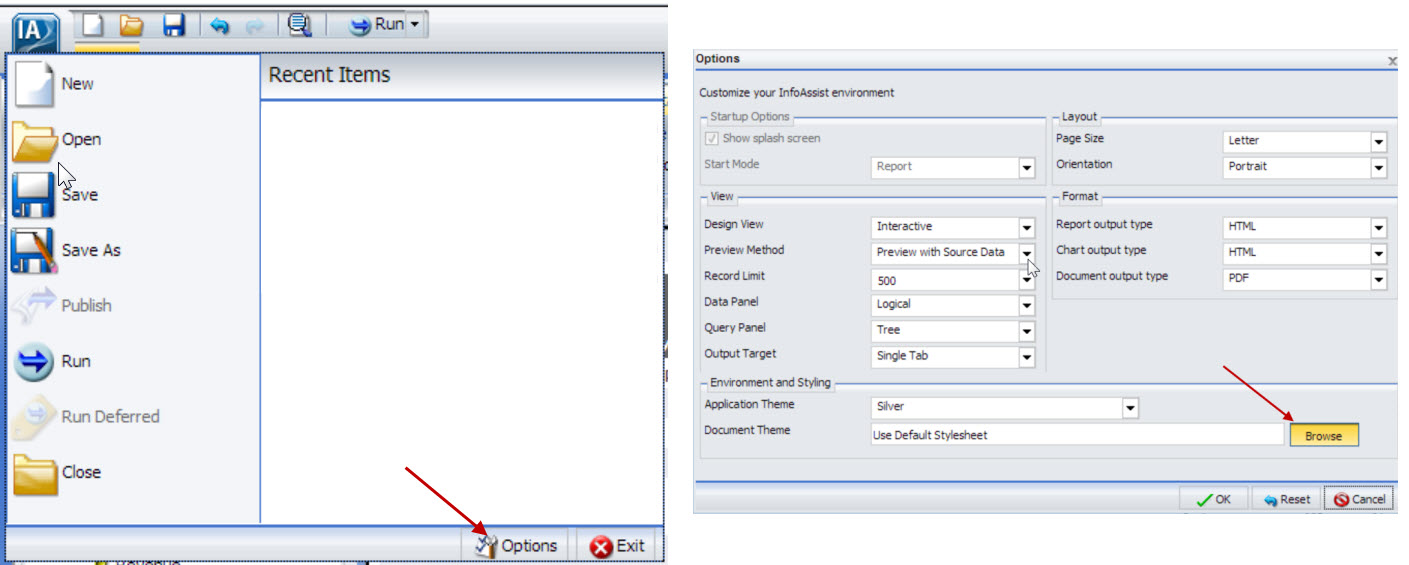
Figure 15: Change the default theme.
You can select your default theme from the same list of style sheets.
Got DB2 Web Query?
If you don't have DB2 Web Query and aren't sure how you can get it, work with your IBM representative or authorized Business Partner to obtain the software. If you own Query/400 but were never shipped the Version 1 DB2 Web Query product, and are at V6R1 or higher OS level, you can order the Express Edition of DB2 Web Query at no charge. This will give you the entry-level package (which includes InfoAssist and all the features covered in this article) as well as features such Active Reports, OLAP, and DB2 Web Query mobile support. You can also download a 70-day trial of Version 2 from the IBM ESS Web site. Refer to the FAQ document at www.ibm.com/systems/i/db2/webquery for details.
Summary
DB2 Web Query has many features and shortcuts that you can use to easily generate Excel spreadsheet the way you want them. In fact, this is only part one of a three-part article on DB2 Web Query tips for Excel. In my next TechTip, I'll show you how DB2 Web Query features like Table of Contents, Compound Documents, Excel with Formula, and Pivot Tables can be used to achieve your Excel reporting requirements.


 More than ever, there is a demand for IT to deliver innovation. Your IBM i has been an essential part of your business operations for years. However, your organization may struggle to maintain the current system and implement new projects. The thousands of customers we've worked with and surveyed state that expectations regarding the digital footprint and vision of the company are not aligned with the current IT environment.
 TRY the one package that solves all your document design and printing challenges on all your platforms. Produce bar code labels, electronic forms, ad hoc reports, and RFID tags – without programming! MarkMagic is the only document design and print solution that combines report writing, WYSIWYG label and forms design, and conditional printing in one integrated product. Make sure your data survives when catastrophe hits. Request your trial now! Request Now.
 Forms of ransomware has been around for over 30 years, and with more and more organizations suffering attacks each year, it continues to endure. What has made ransomware such a durable threat and what is the best way to combat it? In order to prevent ransomware, organizations must first understand how it works.
 Disaster protection is vital to every business. Yet, it often consists of patched together procedures that are prone to error. From automatic backups to data encryption to media management, Robot automates the routine (yet often complex) tasks of iSeries backup and recovery, saving you time and money and making the process safer and more reliable. Automate your backups with the Robot Backup and Recovery Solution. Key features include:
 Business users want new applications now. Market and regulatory pressures require faster application updates and delivery into production. Your IBM i developers may be approaching retirement, and you see no sure way to fill their positions with experienced developers. In addition, you may be caught between maintaining your existing applications and the uncertainty of moving to something new.
 IT managers hoping to find new IBM i talent are discovering that the pool of experienced RPG programmers and operators or administrators with intimate knowledge of the operating system and the applications that run on it is small. This begs the question: How will you manage the platform that supports such a big part of your business? This guide offers strategies and software suggestions to help you plan IT staffing and resources and smooth the transition after your AS/400 talent retires. Read on to learn:
LATEST COMMENTS
MC Press Online