


Show off with a gauge chart that's built using RPG.
Hopefully, you've by now read parts 1 and 2 of this series. In this last tip about Highcharts, I'll introduce you to gauge charts. Highcharts offers a range of various gauges that with a minimum of effort can be implemented and used in your daily work.
I'll use the one called "Solid gauge," and I'll combine it with an RPG-CGI program that will generate a simple XML output using the CEERAN0 API to generate a random number between 0 and 99.
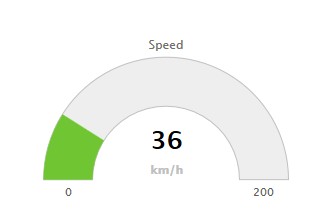
Figure 1: This solid gauge example is from highcharts.com.
The RPG program will be called using AJAX and jQuery and will then parse the XML and display it in the gauge.
I know this is a simple setup, but my task is to inspire you to replace the RPG program with something useful that will show real data in some other way that your users might be used to seeing.
The reason the files are named KPI is that we here in REEFT have made a project where we show selected Key Performance Indicator (KPI) figures in production plant using this method.
As I expect you to already be familiar with Highcharts, having read the previous to TechTips, I'll jump right into the code and explain what's going on. The code is split into two parts: the HTML/jQuery part and the RPG part. This is a lot of code. Instead of slicing it up in small pieces and explaining each piece, I think it will be better to show all the code in full length and comment in bold inside the code at the important places.
At the end of the tip, there's an install section that will explain how to implement the example.
Enough talk. Let's jump in and look at the HTML code.
<!--
//=========================================================
//
// Function: Show Gauge
//
//=========================================================
-->
<!DOCTYPE html>
<html>
<head>
<title>Show Gauge</title>
<meta name="Author" content="Jan Jorgensen, Reeft A/S" />
<meta http-equiv="content-type" content="text/html; charset=iso-8859-1" />
<meta name="viewport" content="width=device-width, initial-scale=1.0">
Define the various JavaScript includes to make it all happen; use CDNs to pick up the data.
<script src="https://ajax.googleapis.com/ajax/libs/jquery/1.11.3/jquery.min.js"></script>
<script type="text/javascript" language="javascript" src="http://code.highcharts.com/highcharts.js"></script>
<script type="text/javascript" language="javascript" src="http://code.highcharts.com/highcharts-more.js"></script>
<script type="text/javascript" language="javascript" src="http://code.highcharts.com/highcharts-3d.js"></script>
<script type="text/javascript" language="javascript" src="http://code.highcharts.com/modules/solid-gauge.js"></script>
<script type="text/javascript" language="javascript" src="http://code.highcharts.com/modules/exporting.js"></script>
Define some CSS inline in the code. Normally this will be placed outside the HTML file in an xxx.css file.
<style>
.hidden {
display: none;
}
.header_gauge_text {
font-size: 3.0vw;
}
.header_gauge {
font-size: 3.0vw;
}
.header_gauge_01 {
font-size: 2.0vw;
}
.gauge-layout {
width:540px;
height:250px;
margin:0 auto;
border: 0px solid red;
}
Note: The "bg-color-active" and the "bg-color-inactive" classes make a nice little circle in the right upper corner showing when the AJAX calls are being carried out.
.bg-color-active {
background: green none repeat scroll 0 0;
border-radius: 50%;
width: 20px;
height: 20px;
}
.bg-color-inactive {
background: #EBEBEB none repeat scroll 0 0;
border-radius: 50%;
width: 20px;
height: 20px;
}
</style>
<script type="text/javascript">
//===================================================================================================
// Set globals
//===================================================================================================
Set global variables used to control colors and the values where the colors will change within the gauge:
var firstLoad = false;
var stop00 = 0.0; // Red
var stop01 = 0.45; // Red
var stop02 = 0.4501; // Yellow
var stop02a = 0.90; // Yellow
var stop03 = 0.9001; // Green
var stop03a = 1.00; // Green
var animation_time = 1000;
var stop01_color = '#DF5353';
var stop02_color = '#FFFF2A';
var stop03_color = '#009900';
var stop01c = 45;
var stop02c = 90;
//=============================================================================
// jQuery init
//=============================================================================
$(document).ready(function() {
Calculate the size of the gauge, depending on the screen size and the "multFactor" variables. If you want to make the chart bigger according to the screen size, just increase the value of the multFactor variable.
// Calculate gauge size
var winH = $(window).height();
var winW = $(window).width();
winH = winH - 200;
winW = winW - 200;
multFactor = 0.60;
winH = parseInt(winH * multFactor);
winW = parseInt(winW * multFactor);
Write the calculated values to the hidden debug ID. This is a good way to check various values within your files. Just rename the "hidden" class to something else and press F5 to see the data.
$('#debug').text( winH + ' -- ' + winW );
$('#container-gauge').height( winH).width( winW );
Get data from the server using an AJAX call in the getServerData function. Then set an interval timer to repeat the call every 10 seconds.
getServerData();
setInterval(function () {
getServerData();
}, 10000);
});
//===================================================================================================
// Get server data
//===================================================================================================
function getServerData( ) {
Execute the AJAX call to the RPG-CGI program. Note that I have included a small static XML file called "kpi001-proxy-data.xml." So if you do not want to install the RPG program, just comment out the cgi-bin call, uncomment the kpi001-proxy… Statement, and load the HTML file; you will see the example work right away.
If you change the XML node "pct," you will see the gauge "come alive."
$.ajax({
type: "GET",
//url: "kpi001-proxy-data.xml",
url: "/cgi-bin/kpi001",
dataType: "xml",
cache: false,
beforeSend: function(xml){
Create "Something is happening" in the right upper corner.
$("#work-message").removeClass('bg-color-inactive');
$("#work-message").addClass('bg-color-active');
},
success: function( xml) {
$(xml).find('data').each(function() {
Parse the XML from the AJAX call. Here I use a static XML file or a call to an RPG program, but of course you could call a PHP program, Java, or something else. Just make sure the XML result looks the same.
var update_date = $(this).find('update_date').text();
var update_time = $(this).find('update_time').text();
var pct = $(this).find('pct').text();
$('#info-area').html( 'Date: ' + update_date );
$('#update-info').html( 'Last update: ' + update_time );
Note that instead of calling the setGaugeValue function, I store the percent from the XML in a hidden input field and then call set function when the AJAX call has completed. The reason is that I can then use this value to do something else if I want, and it is also very easy to debug the AJAX call (if not using Firebug) as I can just remove the hidden calls from the "container-gauge_val'" field.
// Update input field used by setGaugeValue
$('#container-gauge_val').val( pct ); });
},
complete:function ( xml ){
AJAX call done, if this is the first call, define the gauge; otherwise, set the new percent value without re-drawing the gauge.
if ( firstLoad === false ) {
createGauge();
firstLoad = true;
} else {
setGaugeValue();
}
$("#work-message").addClass('bg-color-inactive');
$("#work-message").removeClass('bg-color-active');
},
error:function (xhr, ajaxOptions, thrownError){
}
});
}
//=============================================================================
// Set gauge value
//=============================================================================
function setGaugeValue()
{
Update the gauge.
var chart = $('#container-gauge').highcharts(),
point,
newVal,
inc;
if (chart) {
point = chart.series[0].points[0];
var v1 = parseFloat( $('#container-gauge_val').val() );
point.update(v1);
}
}
//=============================================================================
// Create chart
//=============================================================================
function createGauge()
{
Create the gauge; this is "normal" stuff when creating a Highchart using various options found in the API documentation on the website.
The gauge below is taken from the example on the website and modified mainly in the "yAxis ->stops" and "dataLabels->format". Try changing the various elements, and look in the documentation to add/remove options to/from the gauge.
$(function () {
var gaugeOptions = {
chart: {
type: 'solidgauge'
},
title: null,
pane: {
center: ['50%', '85%'],
size: '140%',
startAngle: -90,
endAngle: 90,
background: {
backgroundColor: '#EEE',
innerRadius: '60%',
outerRadius: '100%',
shape: 'arc'
}
},
tooltip: {
enabled: false
},
navigation: {
enabled: false
},
exporting: {
enabled: false
},
// the value axis
yAxis: {
stops:
[
[stop00, stop01_color], // green
[stop01, stop01_color], // green
[stop02, stop02_color], // yellos
[stop02a, stop02_color], // yellos
[stop03, stop03_color], // red
[stop03a, stop03_color] // red
],
lineWidth: 0,
minorTickInterval: null,
tickPixelInterval: null,
tickWidth: 0,
title: {
y: -70
},
labels: {
y: 16
}
},
plotOptions: {
solidgauge: {
dataLabels: {
y: 5,
borderWidth: 0,
useHTML: true
},
animation: {
duration: animation_time
}
}
}
};
var v1 = parseFloat( $('#container-gauge_val').val() );
// Gauge
$('#container-gauge').highcharts(Highcharts.merge(gaugeOptions, {
yAxis: {
min: 0,
max: 100,
title: {
text: ''
}
},
credits: {
enabled: false
},
series: [{
name: '',
data: [v1],
dataLabels: {
format: '<div style="text-align:center"><span style="font-size:3.0vw;color:' +
((Highcharts.theme && Highcharts.theme.contrastTextColor) || 'black') + '">{y} </span></div>'
},
tooltip: {
valueSuffix: ''
}
}]
}));
});
}
// -->
</script>
</head>
<body>
Hidden fields are used for debug and percent storing.
<div class="hidden">
<span id="debug"></span>
<input id="container-gauge_val" value="0">
</div>
<table width="100%" border="0" cellpadding="0" cellspacing="0">
<tr>
<td width="250">
</td>
<td align="center">
<div class="header_gauge_text" style="text-align:center">Random number from RPG program</div>
<span style="position:absolute;float:right;top:12px;right:35px;font-size:12px" id="update-info"></span>
</td>
<td width="250" align="right" valign="bottom">
<div id="work-message" style="position:absolute;float:right;top:8px;right:5px"> </div>
</td>
</tr>
</table>
<hr>
This table holds the gauge:
<table border="1" bordercolor="#e8e8e8" cellpadding="10" cellspacing="0" width="100%">
<tr bgcolor="#e8e8e8">
<td>
<div class="header_gauge_01" id="info-area"></div>
</td>
<td align="center">
</td>
</tr>
<tr>
<td>
<span class="header_gauge">Our lucky number</span>
</td>
<td align="center">
<div id="container-gauge" class="gauge-layout"></div>
</td>
</tr>
</table>
</body>
</html>
Figure 2: This is the kpi001.htm source.
I really hope that the bold highlights above have made sense for you and that you can see the meaning of all the code. The best way to test is to download the example and just run it. Then try changing some of the options while reading the API documentation at the Highcharts website.
Let's Look at the RPG
Now with the HTML source in your backpack, let's have a look at something that might be a little more "common ground"— an RPG-CGI program.
This very simple program is meant only as a driver to produce some simple data. In a real-world situation, you will of course replace it with something more useful and change the XML output to reflect your needs.
Again, look through the code where I have added some comments in bold.
H CopyRight('Copyright Someone (c) - 2015')
H DatEdit(*YMD.)
H Option( *SrcStmt: *NoDebugIO)
H DECEDIT('0.')
H BndDir('QC2LE')
The binding dir just contains the QZHBCGI service program and allows me to compile with CRTBNDRPG. It's included within the save file in the install section.
/If Defined(*Crtbndrpg)
H BndDir( '*LIBL/CGIBNDDIR' )
H DftActGrp(*NO)
/Endif
//*=============================================================
//*
//* Function :‚Generate random number and pass back to browser
//*
//* ------------------------------------------------------------
//* Created:
//* Programmer:‚JJ
//* Date . . :‚2015-07-06
//*
//*=============================================================
//==============================================================
//‚ DECLARE WORK FIELDS, ARRAYS AND MORE
//==============================================================
Set variables used within the program.
// Contants
D XMLHeader c Const('Content-type: text/xml')
D NewLine c Const(X'15')
D WrkLine s 2000a varying
D Str s 2a
D min s 3u 0 Inz( x'F0' )
D max s 3u 0 Inz( x'F9' )
D idx s 5u 0
D seed s 10i 0
D random s 8f
D char Ds
D hex 3u 0
//----------------------------------------------------------------
// Prototypes
//----------------------------------------------------------------
D MakeXML pr
D StringIn 2000 value
d getrandom pr ExtProc( 'CEERAN0' )
d seed 10i 0
d rand 8f
D fc * Options( *Omit )
/free
//---------------------------------------------------------------
//‚Generate number
//---------------------------------------------------------------
For Idx = 1 to %Len( Str );
CallP getrandom( seed: random: *Omit );
Eval hex = ( random * ( max - min )) + min;
Eval %Subst( str: idx: 1 ) = char;
EndFor;
// Number found
Str = Str;
//---------------------------------------------------------------
// Tell browser XML is coming
//---------------------------------------------------------------
// Content-Type
MakeXML ( %trim(XMLHeader) + NewLine + NewLine );
//---------------------------------------------------------------
// Create output
//---------------------------------------------------------------
ExSr subrCreateReply;
//---------------------------------------------------------------
// Stop Program
//---------------------------------------------------------------
ExSr StopPgm;
//---------------------------------------------------------------
// Create XML reply
//---------------------------------------------------------------
BegSr subrCreateReply;
Create XML output and write it to the browser.
WrkLine = '<?xml version="1.0" encoding="UTF-8"?>'
+ '<data>'
;
MakeXML ( %trim(WrkLine) + NewLine );
WrkLine = '<update_date>'
+ %char( %date() )
+ '</update_date>'
+ '<update_time>'
+ %char( %time() )
+ '</update_time>'
+ '<pct>'
+ %trim( Str )
+ '</pct>'
;
// Write to browser
WrkLine = %trim( WrkLine );
MakeXML ( %trim(WrkLine) + NewLine );
// Write to browser
WrkLine = '</data>'
;
MakeXML ( %trim(WrkLine) + NewLine );
EndSr;
//---------------------------------------------------------------
// Stop Program
//---------------------------------------------------------------
BegSr StopPgm;
*inLR = *ON;
Return;
EndSr;
//---------------------------------------------------------------
// Global error catcher
//---------------------------------------------------------------
BegSr *PSSR;
EndSr;
/end-free
//================================================================
// Function MakeXML - Write string to StdOut
//================================================================
P MakeXML b
D MakeXML pi
D StringIn 2000 value
D Work s like(StringIn)
D StdOutLen s 9B 0
//----------------------------------------------------------------
// General API error routine
//----------------------------------------------------------------
DQUSEC DS
D qusbprv 1 4B 0 Inz( 16 ) Qus EC
D qusbavl 5 8B 0 Bytes Provided
D qusei 9 15 Bytes Available
D quserved 16 16 Exception Id
//----------------------------------------------------------------
// Calculate length of StdOut string
//----------------------------------------------------------------
/free
Work = %trim(StringIn);
Work = %trim(Work);
StdOutLen = %CheckR(' ':Work);
/end-free
//----------------------------------------------------------------
// Call QtmhWrStout API to write response HTML to StdOut
//----------------------------------------------------------------
C CallB(e) 'QtmhWrStout'
C Parm Work
C Parm StdOutLen
C Parm QUSEC
P MakeXML e
Figure 3: This RPG-CGI code generates data to the solid gauge.
Well, I didn't make many comments as I expect that you might have your own standard of writing RPG-CGI programs that might look different from mine or maybe you use things like CGIDEV2 or likewise. Nevertheless, the objective is to create some XML that looks like this:
<?xml version="1.0" encoding="UTF-8"?>
<data>
<update_date>2015-07-06</update_date>
<update_time>20.00.00</update_time>
<pct>12</pct>
</data>
Figure 4: Here's the XML output from the RPG-CGI program.
And that's it! If you're still with me after this long journey, here's how to install and run it on your IBM i.
Install the Lot
Download the savefile named highchart3.savf from here.
Log on to your IBM i and create savefile HIGHCHART3 in QGPL.
CRTSAVF FILE(QGPL/HIGHCHART3) TEXT('mcpressonine -> highcharts part_3')
FTP the savefile from your PC to the savefile in your IBM i (Google it if you don't know how).
Restore the contents of QGPL/HIGHCHART3 to the library from where you ran your CGI programs.
To test the program, open a browser and enter this URL:
http://your_server/cgi-bin/kpi001
You should then see a result like the one in Figure 5.
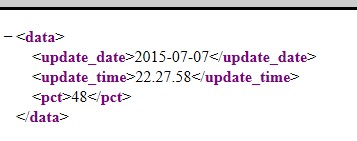
Figure 5: You should see XML output from RPG-CGI program KPI001.
Download the code.zip file from here.
Using your favorite FTP program, upload the kpi0001.htm to the doc dir of your webserver.
IMPORTANT: The HTML file must reside on the same server as the RPG-CGI program. Otherwise, the AJAX call will not succeed because you will have what is called "domain crossing." If you want to store it on separate servers, you have to create some kind of proxy solution and then call the RPG-CGI program from there (again, ask Google if this is the case).
You are now set and can start your first test by running the following URL:
Hopefully, you'll see in your browser a very, very nice solid gauge that will refresh every 10 seconds.
End of Part 3
Well, this became a very long tip, but most of it was raw code, and I really hope you followed this far.
This completes the Highcharts TechTips. I know that I've made only a few scratches on the surface, but I hope you see the potential that this tool has. And once again, I hope you can blow some new life into your IBM i data.
Till next time, have a nice summer and chart away all you can.


 More than ever, there is a demand for IT to deliver innovation. Your IBM i has been an essential part of your business operations for years. However, your organization may struggle to maintain the current system and implement new projects. The thousands of customers we've worked with and surveyed state that expectations regarding the digital footprint and vision of the company are not aligned with the current IT environment.
 TRY the one package that solves all your document design and printing challenges on all your platforms. Produce bar code labels, electronic forms, ad hoc reports, and RFID tags – without programming! MarkMagic is the only document design and print solution that combines report writing, WYSIWYG label and forms design, and conditional printing in one integrated product. Make sure your data survives when catastrophe hits. Request your trial now! Request Now.
 Forms of ransomware has been around for over 30 years, and with more and more organizations suffering attacks each year, it continues to endure. What has made ransomware such a durable threat and what is the best way to combat it? In order to prevent ransomware, organizations must first understand how it works.
 Disaster protection is vital to every business. Yet, it often consists of patched together procedures that are prone to error. From automatic backups to data encryption to media management, Robot automates the routine (yet often complex) tasks of iSeries backup and recovery, saving you time and money and making the process safer and more reliable. Automate your backups with the Robot Backup and Recovery Solution. Key features include:
 Business users want new applications now. Market and regulatory pressures require faster application updates and delivery into production. Your IBM i developers may be approaching retirement, and you see no sure way to fill their positions with experienced developers. In addition, you may be caught between maintaining your existing applications and the uncertainty of moving to something new.
 IT managers hoping to find new IBM i talent are discovering that the pool of experienced RPG programmers and operators or administrators with intimate knowledge of the operating system and the applications that run on it is small. This begs the question: How will you manage the platform that supports such a big part of your business? This guide offers strategies and software suggestions to help you plan IT staffing and resources and smooth the transition after your AS/400 talent retires. Read on to learn:
LATEST COMMENTS
MC Press Online