Tune SQL performance using the System i Navigator's GUI.
The graphical interface used to manage all aspects of System i operations has recently quite dramatically evolved. In addition to the traditional Windows client, you now have the ability to perform most of the tasks through a Web browser. Although System i Access for Web has quite impressive functionality, certain areas are still best served by the "traditional" Windows-based client. As of V6R1, professionals who are charged with DB2 administration will probably continue to rely on the rich functionality provided by the System i Navigator for Windows when it comes to DB2 management and performance tuning.
In fact, the V6R1 release of System i Navigator sports a long list of important enhancements. Please see the recent MC Press Online article written by Jim Flanagan for a comprehensive list of these improvements. In this article, I will showcase the most important new features by walking you through a practical example of how the System i Navigator can be used to tune SQL performance. I often use this simple methodology when working on SQL performance-related issues. Got your attention? Great!
The Challenge
A new business application has been deployed to aid the management of your company's decision-making process. The application implements a typical star schema data model, where the ORDERS table that contains the sales data is surrounded by a number of dimension tables such as CUSTOMERS, DATEINFO, ITEMS, and SUPPLIERS. Each dimension table has a primary key. The ORDERS table has four foreign keys that tie it to the dimensions. As a reminder, the key constraints are implemented on DB2 for i through indexes. In other words, a set of indexes can be used for join implementation.
Although on the surface the model seems to be all right, the pilot users complain about poor response times for a number of business-critical reports. By analyzing the application flow, you were able to identify the top 10 queries that need to be tuned. You built an SQL script that contains the queries. Now your task is to tune these queries so that the best possible performance can be achieved.
The Solution
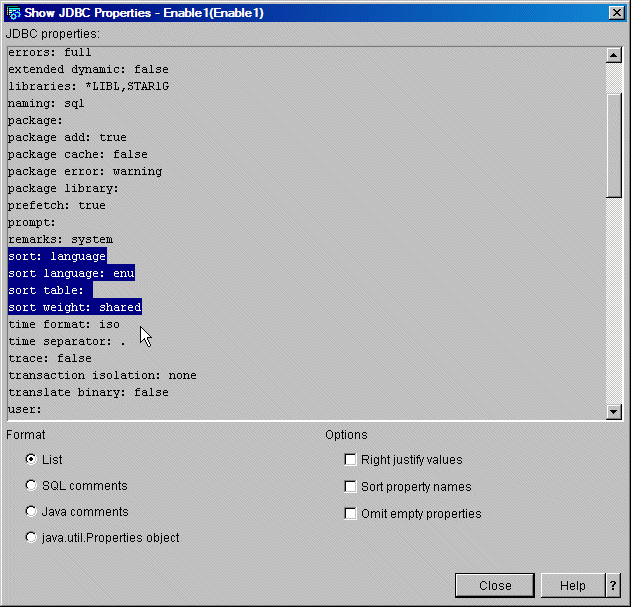
You could approach the task of SQL performance tuning in many ways. For example, you could collect system traces and write custom queries to analyze them. However, if you are like me, you prefer visual tooling so that you don't have to touch the green-screen anymore. The System i Navigator enters the stage. You are going to use the Run SQL Script utility to execute the script with the 10 queries to be tuned. First, you need to make sure that the utility's settings match those of your BI application. In V6R1, this task is really easy thanks to a new option that allows you to display current settings for the JDBC connection serving your session. From the Run SQL Scripts menu, select Connection > Show JDBC Properties. The dialog that appears lists all relevant settings, as shown in Figure 1.
Figure 1: The Show JDBC properties dialog allows you to display current settings for the JDBC connection serving your session. (Click images to enlarge.)
Note that you can display the properties in several formats, including Java properties object format, which can be directly cut and pasted into a Java source. In the case of our BI application, we need to verify that shared-weight sort sequence is in effect. This guarantees case-insensitive SQL searches, which is required by the application users. Luckily, in V6R1 the support for National Language Sort Sequence (NLSS) and sort sequences has been added to the SQL Query Engine (SQE) so that the queries can be optimized and run by this modern database engine. You can read more about SQE enhancements in my recently published article "V6R1 SQL Query Engine Delivers on Its Promise."
Once the connection properties are verified and adjusted, you can run the workload using the Run SQL Scripts utility. In addition to SQL statements, the utility allows you to submit CL commands. You use this feature to clear the memory pool in which the database server job serving your connection is running. The remote JDBC connections are served by QZDASOINIT jobs that typically run in the QUSRWRK subsystem. Clearing the memory pool ensures that the results of the test runs are comparable because, at beginning of each run, the SQL objects are not paged in. Here's the command to clear the pool that has been inserted as the first statement in the script:
cl:CLRPOOL POOL(*JOB);
I also recommend disabling the system performance adjustment for the duration of the tuning project by setting the system value QPRFADJ to 0. This will ensure that the system will not change memory pool sizes and max activity levels, which could result in access plans being invalidated. The last thing we want during performance tuning is unpredictable changes in the system configuration.
The plan is to capture the database monitor traces for each batch of runs and then analyze them using the GUI tooling available in System i Navigator. The following steps outline the proposed methodology:
Steps 1-3: Run SQL Script
1. You can invoke the database monitor directly from Run SQL Scripts by selecting Monitor > Start SQL Performance Monitor from the main menu. The SQL Performance Monitor wizard appears. The only two values you need to provide are the monitor name (e.g., BI Workload Run 1a) and the schema name (library) where the system is to store the traces. The wizard automatically scopes the monitor instance to the specific QZDASOINIT job, which serves your current connection. Generally, the wizard allows very detailed filtering, including minimum estimated query runtime, minimum estimated temporary storage, job name, and so on. Two additional filtering options were added in V6R1: local ports and Query Governor limits. Note that not all filtering options are available when the monitor is started from the Run SQL Script utility. As stated, the wizard is aware of the context in which it is invoked and automatically sets a number of filter options.
2. With the database monitor enabled, run the SQL script three times. End the database monitor by selecting Monitor > End BI Workload Run 1a.
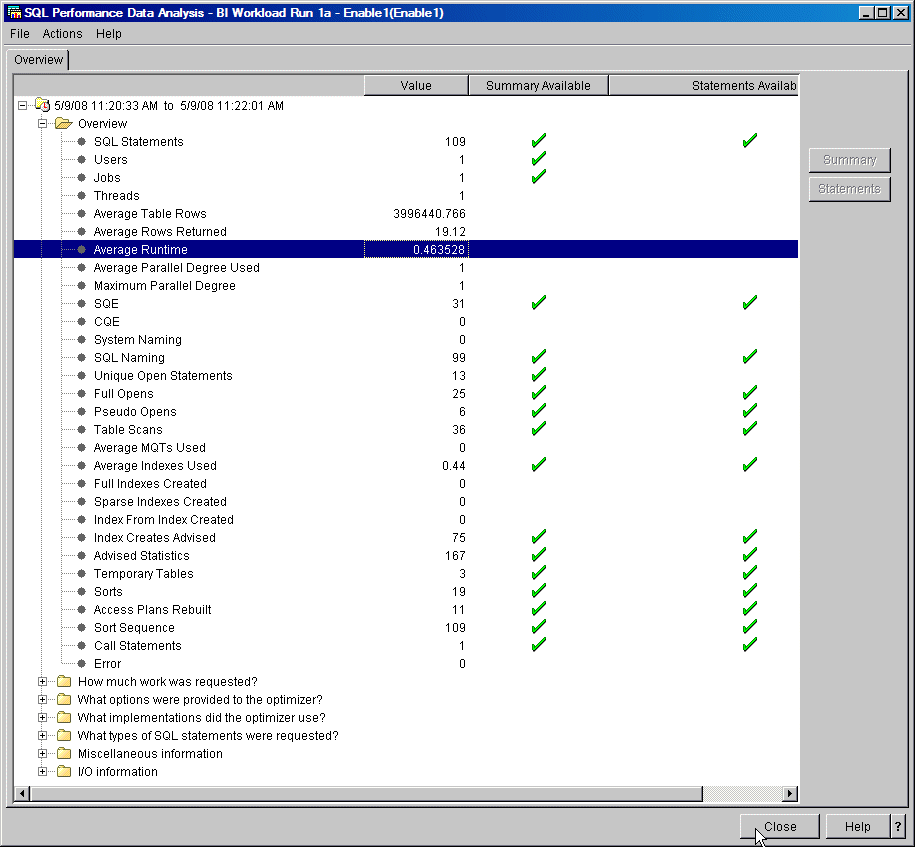
3. Start the performance tuning by invoking the SQL Performance Data Analysis dialog. To do so, select Monitor > Analyze from Run SQL Script. The dialog provides an overview of the SQL workload collected in the database monitor. This is illustrated in Figure 2.
Figure 2: The SQL Performance Data Analysis dialog provides an overview of the SQL workload collected in the database monitor.
Because you ran the script three times, the dialog in Figure 3 reports the execution of 31 statements. As expected, the statements were run by the SQE. First, we want to focus on the most expensive statements. Note that the average runtime was 0.46 second. We'll use this value to gauge the tuning progress.
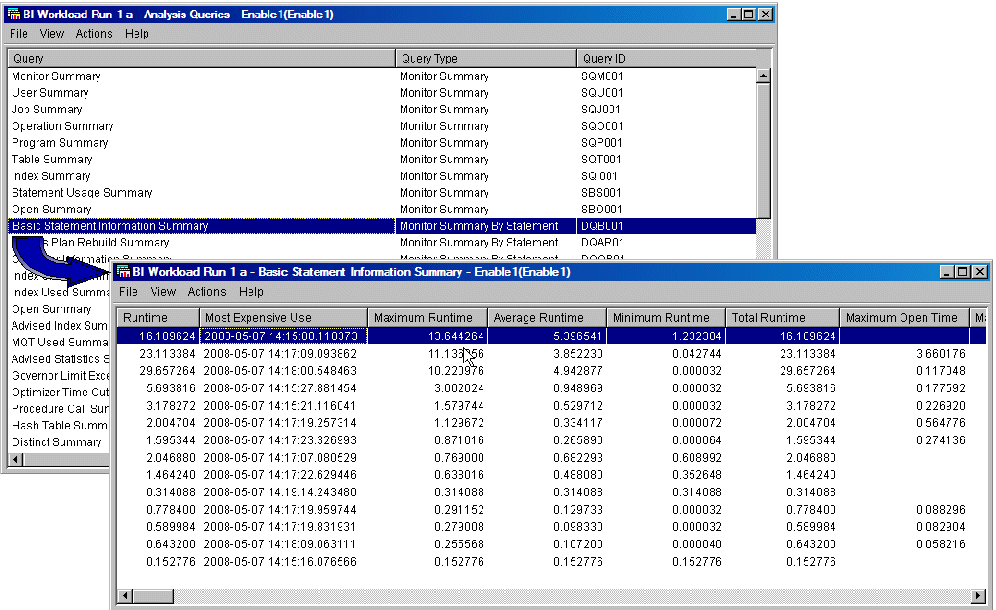
To have the list of statements sorted by the maximum execution time in the Analysis dialog (Figure 2), select Actions > Analysis Queries. A list of available pre-canned reports is presented. Double-click on Basic Statement Information Summary. The dialog that appears contains the list of all the SQL statements collected in a given database monitor sorted by the maximum execution time. This is shown is Figure 3.
Figure 3: Statement Information is sorted by maximum runtime.
In V6R1, the functionality of the reports such as the one shown in Figure 3 has been dramatically enhanced. Specifically, you can now save a report in one of the many supported formats. For example, in the summary report, select File > Save Results. The dialog that appears allows you to specify the location where to save the report and its format. You can choose to save it as a text, XML, Lotus 1-2-3, or Excel file. See Figure 4 for details.
Figure 4: Save a report as an Excel worksheet.
Once saved, the report can be used to monitor performance trends, produce boardroom quality graphs and charts, or, if needed, communicate issues with IBM service.
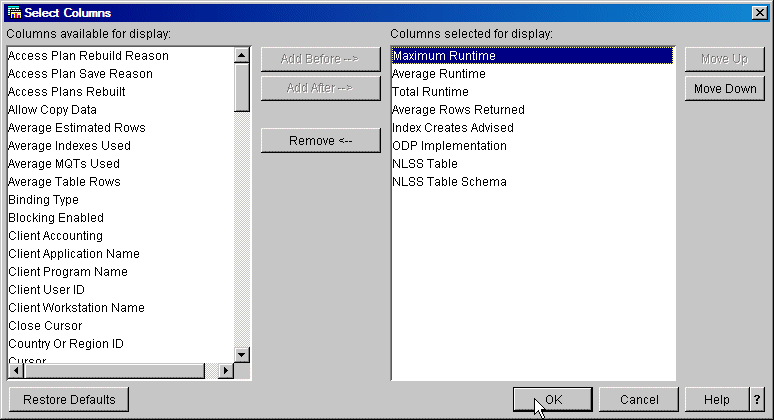
Another--and probably even more important--enhancement is the ability to specify the columns and their order in the reports. In the past, an analyst had to scroll left and right to find pieces of information that were of interest in a particular situation. In V6R1, you can select View > Columns from a report's main menu and identify the columns you want to see using the Select Columns dialog. This is illustrated in Figure 5.
Figure 5: Customize reports.
The customized report layout is saved on your workstation and will be used for all reports of a given type. Use the Restore Defaults button to reset the layout to its original format.
Step 4: The Basic Statement Information Summary Report
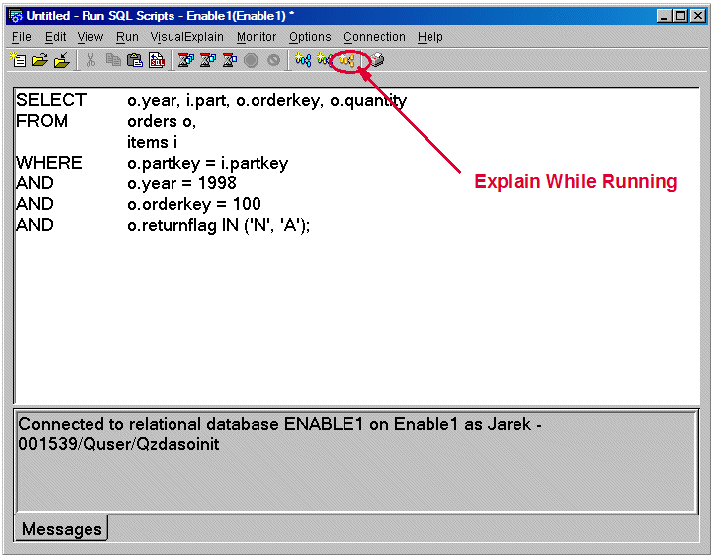
In the previous step, we identified the most expensive statement. Let's use the newly introduced Explain While Running option to render the access plan for that statement. In the Basic Statement Information Summary report (Figure 3), right-click the most expensive statement and select Work with SQL Statement and Variables. This new V6R1 option opens a Run SQL Script window with the statement text, including the values for variables and literals. I believe that this new functionality will quickly become one of your favorites. Note that in the Toolbar there is a new button to activate the Explain While Running functionality (Figure 6).
Figure 6: The toolbar now includes an icon for Explain While Running.
Click on the icon shown in Figure 6 to render the access plan graph. A Visual Explain window appears. In the Toolbar, find the icon shown in Figure 7 (Refresh While Running) and click it while the statement is running. The runtime attributes shown in the right panel are refreshed with the values collected so far. I believe this feature will be very useful when analyzing and tuning longer-running queries.
Figure 7: Explain While Running refreshes the values.
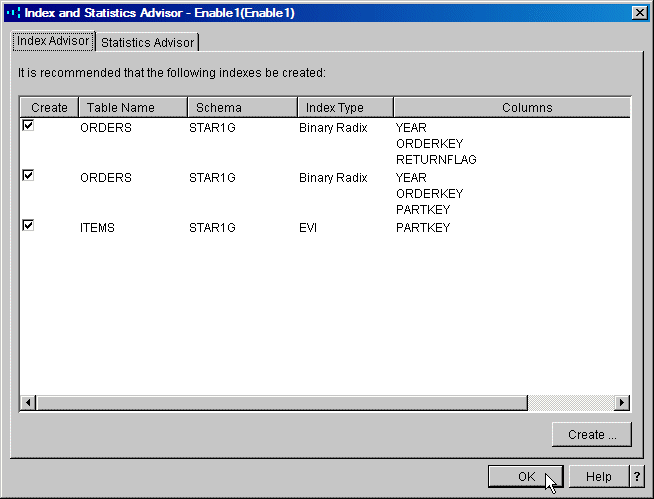
The access plan graph in the left panel shows that the SQE optimizer decided to create a temporary index to implement the local selection on the primary join dial. This temporary index is maintained and can be used to implement other statements in the same job as well as statements running in other jobs. This is a good example of SQE self-tuning capabilities. The temporary indexes have, however, one disadvantage: They are purged at the system IPL. So, let's see if the optimizer advises any permanent indexes. Still in Visual Explain, select Actions > Advisor. In this case, the optimizer advises three permanent indexes, as shown in Figure 8.
Figure 8: The Index and Statistics Advisor can recommend permanent indexes.
You could create the indexes directly from this dialog by clicking the Create button. You'd create the indexes one by one by providing the index name and potentially other basic info. There is, however, an alternate method that is quicker and can create indexes for all queries that need to be tuned: Condense Advised Indexes.
Step 5: Condense Advised Indexes
The condense feature has been recently added to simplify the analysis of index advice from the query optimizer. Often, the index advisor will advise several different indexes for the same table. With the condense feature, you can condense these advised indexes into the best matches for your SQL workload. The Index Advisor can be scoped to the entire database, one schema (library), or a particular object. We will use it for the schema containing the data for our BI application.
In the main System i Navigator dialog, navigate the tree under the database icon to arrive at the STAR1G schema. Right-click the icon representing the STAR1G schema, and select Index Advisor > Condense Advised Indexes. The Condense Advised Indexes dialog appears. It lists all the indexes that were advised by the optimizer for the BI workload. I assume that there were no other applications running against the STAR1G data. If there had been other statements executed against STAR1G, I'd have used the Clear All Advised Indexes option for that schema before running the BI workload.
Select all the indexes advised and right-click the selection. The context menu that appears has just one option: Show SQL. This is a new functionality in V6R1. The index names are generated for you based on the table name. This is shown in Figure 9.
Figure 9: Show SQL for Condensed Advised Indexes generates index names for you based on the table name.
Select the Show SQL option. This opens a new Run SQL Scripts window that contains the CREATE INDEX statements for all indexes in the list. Save the script for documentation purposes. All you need to do now is run the script. Click the Run All icon in the toolbar. Make sure the script completes with no errors.
The Proof
Finally, we should verify that the indexes we created in the previous step truly help improve the performance. Let's rerun the workload, collecting the database monitor traces again. The following steps will guide you through the process:
1. Open a Run SQL Script window and load the BI workload script. Invoke the database monitor directly from Run SQL Scripts by selecting Monitor > Start SQL Performance Monitor from the main menu. Call the monitor "BI Workload Run 2a."
2. With database monitor enabled, run the SQL script three times. End the database monitor by selecting Monitor > End BI Workload Run 2a.
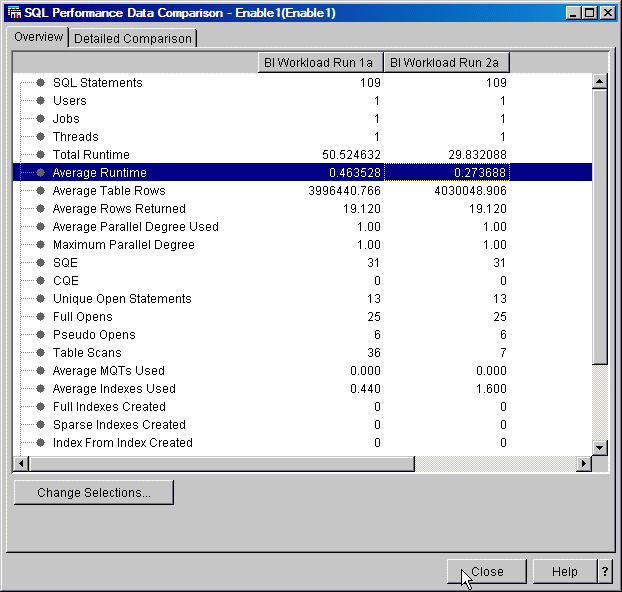
3. To compare both runs, use the new V6R1 function Compare SQL Performance Data. Specifically, the Overview tab displays a high-level comparison of the monitors. In the main System i Navigator window, click the SQL Performance Monitors icon under the database icon. The right panel refreshes to show all database monitors collected on a given system. Select the monitors for the two runs: BI Workload Run 1a and BI Workload Run 2a. Right-click the selection. From the context menu that appears, select Compare. The results are shown in Figure 10.
Figure 10: Compare SQL performance.
The comparison proves that the indexes improved the performance quite a bit. The average response time was reduced from 0.46 to 0.27 seconds (43%).
The last task is to verify that all of the indexes that were created are in fact useful. The indexes are critical for well-performing SQL workloads because the optimizer can use them for both implementation methods as well as the most accurate source of statistics. You can read more about the indexing and statistics strategies in Mike Cain's white paper "Indexing and statistics strategies for DB2 for i5/OS."
4. To validate the usefulness of the indexes, in the main System i Navigator window, click the Tables icon under STAR1G. The list of tables is shown. Right-click ORDERS and select Show Indexes. The indexes for STAR1G.ORDERS dialog appear. You can use View > Customize This View > Columns to rearrange the data shown in the dialog. An example of such a customized view is illustrated in Figure 11.
Figure 11: The Index Evaluator validates the usefulness of the indexes.
I recommend that you use this function on a regular basis to see if there are indexes that can be removed from the system. If an index is not used either for implementation (Query Use Count = 0) or statistics (Query Statistics Use Count = 0), then it is a candidate for purging. If your data is shared with native applications (for instance, RPG), then you'd need to check the last-used date. For a native application reading directly from a table, the SQL counts won't be incremented (Count = 0). Nevertheless, these indexes are not candidates to delete. V6R1 adds one more handy function that aids in index evaluation: Reset Usage Counts. For example, you could reset usage counts for all indexes for a given table, run the current workload, and see which indexes could be eliminated. To reset the counts for all indexes listed in Figure 11, select all entries, right-click the selection, and choose Reset Usage Counts from the context menu.
Taking Advantage of V6R1 System i Navigator Enhancements
As mentioned, V6R1 System i Navigator delivers a number of important enhancements that streamline the DB2 management and performance tuning process. As in the past, the current release supports servers running "n - 2" releases of i5/OS, which means you can use V6R1 System i Navigator running against V6R1, V5R4, and V5R3 servers. Just keep in mind that some functionality may not be available on the older releases. I encourage you to contact your IBM representative to obtain the V6R1 System i Access image to install it on your workstation. Happy navigating!







 More than ever, there is a demand for IT to deliver innovation. Your IBM i has been an essential part of your business operations for years. However, your organization may struggle to maintain the current system and implement new projects. The thousands of customers we've worked with and surveyed state that expectations regarding the digital footprint and vision of the company are not aligned with the current IT environment.
 TRY the one package that solves all your document design and printing challenges on all your platforms. Produce bar code labels, electronic forms, ad hoc reports, and RFID tags – without programming! MarkMagic is the only document design and print solution that combines report writing, WYSIWYG label and forms design, and conditional printing in one integrated product. Make sure your data survives when catastrophe hits. Request your trial now! Request Now.
 Forms of ransomware has been around for over 30 years, and with more and more organizations suffering attacks each year, it continues to endure. What has made ransomware such a durable threat and what is the best way to combat it? In order to prevent ransomware, organizations must first understand how it works.
 Disaster protection is vital to every business. Yet, it often consists of patched together procedures that are prone to error. From automatic backups to data encryption to media management, Robot automates the routine (yet often complex) tasks of iSeries backup and recovery, saving you time and money and making the process safer and more reliable. Automate your backups with the Robot Backup and Recovery Solution. Key features include:
 Business users want new applications now. Market and regulatory pressures require faster application updates and delivery into production. Your IBM i developers may be approaching retirement, and you see no sure way to fill their positions with experienced developers. In addition, you may be caught between maintaining your existing applications and the uncertainty of moving to something new.
 IT managers hoping to find new IBM i talent are discovering that the pool of experienced RPG programmers and operators or administrators with intimate knowledge of the operating system and the applications that run on it is small. This begs the question: How will you manage the platform that supports such a big part of your business? This guide offers strategies and software suggestions to help you plan IT staffing and resources and smooth the transition after your AS/400 talent retires. Read on to learn:
LATEST COMMENTS
MC Press Online