


Create your first charts using the best chart tool ever!
During the last few months, I have been working on a project to present web-based reports as charts. When we started the project, no chart tool was selected and we had a few rules that had to be taken into account:
- The data that should be presented could over time come from various sources (IBM i, MySQL and MsSQL, FTPed text files).
- It should be possible to export the charts in various formats, most often PDF and some kind of JPG or PNG image.
- The data should also be made available as CSV data so it could be brought over to Excel.
- The charts should look a very specific way, because management had some "old" charts made in Excel (!) and they wanted the new ones to look the same.
So that was pretty much the field we had to play upon.
On the technical side, we knew the charts should be built in PHP. On the IBM i side, we would use RPG CGI programs to create the data that should be used in the charts. As we are also keen users of jQuery, something that was built on top of that sure would be a big advantage.
So we started looking to see what was available out there on the big Internet. We found lots of interesting stuff—open source, Flash, PHP—but somehow they all seemed to miss one part here and one part there. So doing a search on Google with just the words "jquery charts," we found the www.highcharts.com website and we knew we had come to the right place.
Before I start lauding the tool, let me make absolutely clear that I have no personal interest in promoting the tool. The reasons I like it so much are as follows:
- You build on top of jQuery, so no new syntax had to be learned.
- It has all the features you will ever dream of and a few more.
- It provides great documentation with very good live examples that can be run in JSFiddle, which makes it possible to test and change in a very easy way.
- There are great examples also linked to JSFiddle.
- It's not free. I am very much into open source, but once in awhile you have to admit that quality costs. This gives you access to support and such.
So now you know what you are about to experience. In this first TechTip, I will take you on a little road trip into Highcharts land and show you what can be done with this great tool.
Setting Up the Data
As we might get the data from various sources, we had to find an easy way to "store" the data before loading it into the Highcharts tool. We wanted to load the charts using an AJAX call to either a PHP or an RPG program, and we wanted to use the same JavaScript function to display the data.
In this TechTip, I will show you how to make the AJAX call to a predefined HTML page that will then present the data in a line chart. In a later tip, we will load the data from an RPG CGI program and use that as the source input to the chart.
We wanted to create a chart data interface that was easy to understand, easy to debug, and easy to change. We ended up putting the data into hidden input fields and reading it from there.
If we had been facing a pure PHP solution, we would have used JSON, and even though you can create JSON in RPG, we decided that we were satisfied with just using Highcharts. I know it's pretty primitive, but it's easy to understand and very easy to create examples with.
Creating the First Chart
The first example I've made to get us started is a simple, basic chart. The file is called ex1.htm. It loads some data from the HTML file called getdata.htm using an AJAX call. Inside the getdata.htm file are five <input> fields with data. The data is stored in comma-separated strings as you can see in the code below.
<input id="header_text" type="text" value="Production per month for top 3 product numbers" size="110"><br>
<input id="xAxisData" type="text" value='"Jan","Feb","Mar","Apr","May","June","July","Aug","Sep","Oct","Nov","Dec"' size="110"><br>
<input id="chartLine1" type="text" value="18,12,22,14,14,8,8,23,28,11,31,20" size="110"><br>
<input id="chartLine2" type="text" value="28,22,32,54,24,28,38,33,38,31,41,50" size="110"><br>
<input id="chartLine3" type="text" value="38,30,45,20,22,21,26,24,37,33,51,57" size="110"><br>
Try changing the data for chartLine1/2/3, save, and hit F5 or click the Refresh link.
The ex1.htm is pretty simple too. The code looks like this:
<!DOCTYPE html>
<html>
<head>
<title>HighCharts – Part 1 - Example 1</title>
<meta http-equiv="Content-Type" content="text/html; charset=ISO-8859-1">
(A)
<!-- Get the jQuery library -->
<script src="http://ajax.googleapis.com/ajax/libs/jquery/1.11.2/jquery.min.js"></script>
<!-- Get the hightchart library -->
<script src="http://code.highcharts.com/highcharts.js"></script>
<script src="http://code.highcharts.com/modules/exporting.js"></script>
<style>
.hidden {
display: none;
}
</style>
<script language="JavaScript">
<!--
(B)
//=====================================================================================
// Get data
//=====================================================================================
function getData() {
parmData = ''
;
$.ajax({
type: "GET",
url: "getdata.htm",
data: parmData,
dataType: "html",
cache: false,
success: function( htmlData ) {
$("#data_area").html( htmlData );
},
complete: function( htmlData ) {
(C)
showChart();
},
error:function (xhr, ajaxOptions, thrownError){
}
});
}
//=====================================================================================
// Show chart
//=====================================================================================
function showChart() {
// Get header text
var headerText = $('#header_text' ).val();
$('#doc_header' ).html( $('#header_text' ).val() );
(D)
var dateString = $.parseJSON('[' + $('#xAxisData' ).val() + ']');
var line1 = $.parseJSON('[' + $('#chartLine1' ).val() + ']');
var line2 = $.parseJSON('[' + $('#chartLine2' ).val() + ']');
var line3 = $.parseJSON('[' + $('#chartLine3' ).val() + ']');
// remove comment to see the jSon string in the console log if using Firebug
//console.log( dateString );
(E)
$('#chart_area').highcharts({
chart: {
type: 'line',
},
credits: {
enabled: false
},
title: {
text: headerText
},
subtitle: {
text: ''
},
xAxis: {
categories: dateString,
},
yAxis: {
title: {
text: 'Qty'
},
},
plotOptions: {
},
navigation: {
buttonOptions: {
enabled: false
}
},
series: [
{
name: 'Prod 1',
data: line1,
},
{
name: 'Prod 2',
data: line2,
},
{
name: 'Prod 3',
data: line3,
}
]
}, function (chart) { // on complete
}
);
}
(F)
//=====================================================================================
// jQuery loaded
//=====================================================================================
$(document).ready(function() {
// Set chart size according to window
w = $(window).width();
h = $(window).height();
$("#chart_area").height(h-100);
$("#chart_area").width(w-200);
// Get some data
getData();
});
// -->
</script>
</head>
(G)
<body>
<h3><span id="doc_header">...</span></h3>
<hr>
<a href="javascript:void(0)" onclick="getData()">Refresh</a>
<hr>
<div class="hidden">
<div id="data_area"></div>
<hr>
</div>
<center>
<div id="chart_area"></div>
</center>
</body>
</html>
Here are some highlights that I feel are especially interesting:
(A)
Here the jQuery and Highcharts JavaScript files are loaded. Note that I am using a Content delivery network (CDN) to retrieve the source files.
(B)
The getData function is where the AJAX called is executed. The input data is saved in the hidden div tag named "data_area," so if you want to see the data from the AJAX call, just rename the "hidden" class to, for example, "hiddenx" and press F5 to reload the page.
(C)
When the AJAX call is complete, call the showChart() function to show the data.
(D)
Convert the data to a well-formed JSON object using the $.parseJSON function.
(E)
This is the most simple way to define a chart that will look like the one shown below.
(F)
Init the page, calculate size of chart, start the data collecting.
(G)
This HTML holds the data and the chart, the header, and a little styling.
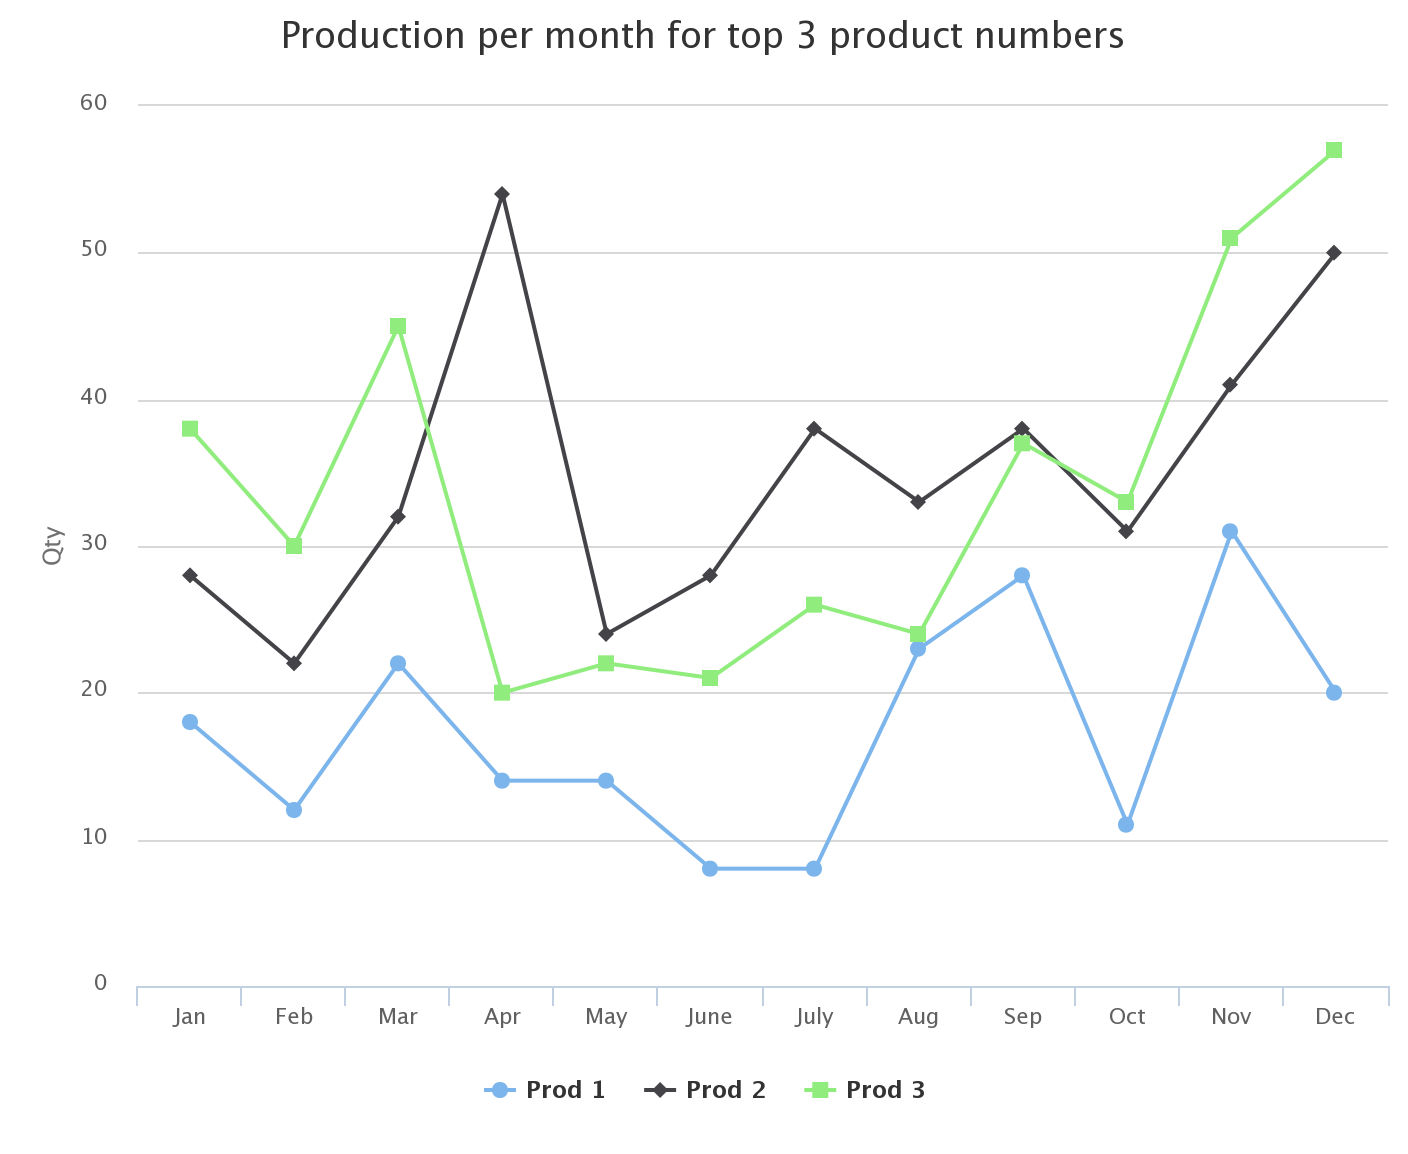
Figure 1: This is how the chart looks in its most simple form.
In this example, I have disabled the export function and almost everything else.
In the next TechTip, there will be less text and much more code when we add more options and show you how to change the look of the chart.
If you cannot wait, just dive into the Highcharts website and look at the examples and documentation. You will soon be the king of charts! If you can wait, stay tuned till next time, and until then, keep charting away.
Download the example code here.
See the example in real life here.


 More than ever, there is a demand for IT to deliver innovation. Your IBM i has been an essential part of your business operations for years. However, your organization may struggle to maintain the current system and implement new projects. The thousands of customers we've worked with and surveyed state that expectations regarding the digital footprint and vision of the company are not aligned with the current IT environment.
 TRY the one package that solves all your document design and printing challenges on all your platforms. Produce bar code labels, electronic forms, ad hoc reports, and RFID tags – without programming! MarkMagic is the only document design and print solution that combines report writing, WYSIWYG label and forms design, and conditional printing in one integrated product. Make sure your data survives when catastrophe hits. Request your trial now! Request Now.
 Forms of ransomware has been around for over 30 years, and with more and more organizations suffering attacks each year, it continues to endure. What has made ransomware such a durable threat and what is the best way to combat it? In order to prevent ransomware, organizations must first understand how it works.
 Disaster protection is vital to every business. Yet, it often consists of patched together procedures that are prone to error. From automatic backups to data encryption to media management, Robot automates the routine (yet often complex) tasks of iSeries backup and recovery, saving you time and money and making the process safer and more reliable. Automate your backups with the Robot Backup and Recovery Solution. Key features include:
 Business users want new applications now. Market and regulatory pressures require faster application updates and delivery into production. Your IBM i developers may be approaching retirement, and you see no sure way to fill their positions with experienced developers. In addition, you may be caught between maintaining your existing applications and the uncertainty of moving to something new.
 IT managers hoping to find new IBM i talent are discovering that the pool of experienced RPG programmers and operators or administrators with intimate knowledge of the operating system and the applications that run on it is small. This begs the question: How will you manage the platform that supports such a big part of your business? This guide offers strategies and software suggestions to help you plan IT staffing and resources and smooth the transition after your AS/400 talent retires. Read on to learn:
LATEST COMMENTS
MC Press Online