


System performance information has always baffled us. In general, we’ve always been visual people, especially when it came time to look at performance information. Even though we both majored in math, all those numbers just didn’t add up. There was just so much information that we couldn’t get our heads around it all. What we wouldn’t have given for a chart depicting the most important information!
Sound familiar? Wondering how to get your AS/400 to give you some pictures of what’s going on? Well, now you can. The Management Central function of Operations Navigator provides this graphical representation of system performance data via monitors. And it doesn’t take a performance expert to set them up.
The Basics of Management Central of Operations Navigator
While many of the functions of Operations Navigator (OpsNav) are for all users, the Management Central function is primarily for system administrators or operators. Therefore, it is an optionally installable part of OpsNav. In fact, the default is not to install this function, so the first thing you’ll need to do is perform a selective installation of Client Access Express and request the installation of the Management Central component.
The next thing you need to know about is the organization of Management Central or what we like to call the basic concepts. As Figure 1 shows, the basic concepts are as follows:
• Endpoint systems—These are AS/400 systems on which you want to perform a Management Central function, such as monitoring. These endpoint systems must use TCP/IP for connectivity to other AS/400s and PCs. You can group them together so they appear like a logical group of systems. These grouped endpoint systems are called system groups.
• Central system—This is a special endpoint system where the Management Central applications are defined and controlled. The central system must have connectivity to a graphical client. To control the application, the central system must also have connectivity to the other endpoint systems.
Think of it as Management Central creating a control application on the central system that ensures all requested endpoint systems start the defined application, such as performance monitoring, and then reports back the requested information.
• Graphical client—This is your PC. It acts as an interface that enables setting up, starting, and viewing Management Central applications. It connects directly to the central system to communicate with the control applications managing your network of endpoint systems.
• Monitor—This is an “application” that requests performance information and optionally checks for specific conditions known as thresholds. The monitor application will run and store the performance information on the endpoint systems selected. The thresholds, when encountered, will be reported as events back to the central system. The central system will store this event information until no longer needed (i.e., until you delete it).
OK. Now that we’ve figured out how to get this function “installed” and understand the basic concepts of Management Central, it’s time to look at how to set up monitors and get them to work for you.
Setting Up (Defining) a Monitor
To set up a monitor, you need to be on your graphical client (i.e., PC) and have an idea of what information you want to see or specific condition you need to detect. For our example, we want to create a monitor that will tell us when the responses our interactive users are getting from their session goes beyond 5 seconds.
To get started, click on the Operations Navigator icon on your desktop. If you installed the Management Central component, you should see the words Management Central on the top of the left-hand panel of the Operations Navigator window. Figure 2 shows this window. Click on the plus sign (+) beside Management Central to expand the tree that will start the Management Central server. Another way to start Management Central is from within Operations Navigator by clicking on Network, then click on Servers, and, finally, right-click on Management Central in the right-hand pane of the OpsNav GUI and select Start. This should start the Management Central Server for you. If you right-click on Monitor, a pop-up menu will appear from which you should select New Monitor. You will see the default properties of your new monitor. Under the General tab of the monitor property page, you will need to give your monitor a name. You will also need to select the performance information to be collected; this information is called a metric. For this example, we will use the name Unhappy Interactive Users and select Interactive Response Time (Average). You might want to select a couple additional metrics, such as CPU Utilization (Average) and Interactive Response Time (Maximum), to determine whether your problem is just an interactive response time problem or there is a more general system performance problem.
Defining Thresholds
We mentioned that 5 seconds was our maximum tolerance value. We can tell the monitor to notify us when we get at or above our 5 second value by defining a threshold. To do this, click on the Metrics tab. Choose the metric, in this case Interactive Response Time (Average), from the list. Then click on the Edit Thresholds button to get the threshold window to appear. Figure 3 (page 102) shows this window. Under the Threshold 1 tab, set the threshold value to greater than or equal to (>=) 5. You may also want the monitor to take some “action,” such as send you a message or call a program that holds a particular job queue by using a host command value. In our example, we chose to send a message to the system operator.
Each metric allows you to define up to two thresholds. You can use this in multiple ways. For example, instead of finding out after the response time has reached the
unacceptable level of 5 seconds and the phone rings with the CEO wanting to know why the system is so slow, you could define a second threshold of at or above 4 seconds as an early warning message. This second threshold could give you the heads-up you need to avoid hitting the maximum threshold that would result in that dreaded discussion with your users—or worse, the CEO. To define the second threshold, select the Threshold 2 tab and set the threshold value to greater than or equal to (>=) 4 and, using the Host Command prompt, specify an action, such as a send a break message to your operator to locate and fix the problem.
Did you notice on the threshold screen there was a reset option? Once a threshold is reached, it is said to have triggered. Triggering a threshold can log an event that you can view at a later time using the Event log. Should the metrics return to normal (e.g., the response time improves to 2 seconds), you may no longer be concerned about response time. So, by specifying a reset value of less than 2, you will have a way to indicate the troublesome condition is no longer occurring. The reset value, like the trigger value, gives you the option to take actions using a host command, in our example another message to the system operator.
We are now ready to finish defining the monitor with its thresholds. Click on OK. Your new monitor will appear in the monitor list on the right side of the Operations Navigator Explorer window.
Starting a Monitor
We’ve defined the monitor. However, we need to associate systems with the monitor and start the monitoring application. To do this, right-click on the monitor and select Start. A dialog will appear for you to select where you want the monitor application to start. Just select the appropriate endpoint systems and/or system groups, and then click on Add. Your selections will be displayed in the list of selected systems and groups.
When you have selected all the systems and groups to be monitored, click OK. The central system will instruct the endpoint systems and/or system groups to start the monitoring application. At this point, the graphical client will only be used to make changes to the definition of the monitor, view any of the performance information in real time, and list the events (triggers and resets) that may have occurred. The central system is now in control of the monitor application and will continue to receive information from each endpoint system’s monitoring application as long as its TCP/IP connection is maintained. If the TCP/IP connection between the central system and the endpoint system drops, the monitor will be stopped. It is not necessary to have your PC connected to the central system for the monitoring applications to run.
Viewing and Changing the Monitor
Now that we have started monitoring our endpoint systems, what can we do? Initially, you may want to see the information being monitored. To do this, double-click on the monitor. As Figure 4 shows, a graphical representation of the performance data will appear. You will see the data for each performance metric plotted on a separate graph. Each system being monitored will be represented by a separate line on the graphs. Should a threshold be triggered, as in our example, the title bar of the graph will appear in red, and the status of the monitor will be triggered. The color and status will remain that way until you reset the threshold.
If you would like to investigate the problem further, position your cursor over the point that caused the trigger in the graph. When you select the graph point, the performance information used to calculate the point will appear in the upper-right pane of the window. With some metrics, you can even select these details to obtain an even lower level of granularity. For our example, you would select the point for Interactive Response Time (Average), which is first-level detail. Once you select the point, the second-level detail, or list of jobs, would appear. By selecting a specific job (e.g., the one using the most CPUs),
you could find out that user Joe is the one signed on doing something that is impacting the performance. This allows you to have a discussion with Joe before the CEO has a discussion with you!
Using the graph view to show the metric for which we have defined thresholds, you may have noticed the red bars next to the values on the y-axis of the graph. Each bar represents one of the thresholds defined in your monitor. You can change the defined thresholds by left-clicking on the associated bar. Clicking on the top or bottom allows you to change the variance between the trigger and reset values. You can change other attributes of the monitor—such as the metrics, systems, and thresholds—while the monitor is running. The changes will be reflected on the graphical client, communicated to the central system, and then finally sent to the monitor application running on the endpoint systems. All this happens, dynamically, with just a couple clicks.
Reviewing the Event Logs
So, let’s say you’ve gone out for lunch. When you return, people tell you the response time was poor while you were gone. However, the monitor looks OK. What do you do? Well, you could scroll through the graph looking for the data that indicates a trigger occurred. Another option would be to simply select the File menu and click on Event log. The trigger and reset events are sent from the monitor application on the endpoint systems to the central system. Once on the central system, the events are stored until they are no longer needed by the person who started the monitor.
The Event log, which handles both triggered and reset events, allows the user to view the list of events logged, access individual event properties, and delete events when they are no longer needed. The events shown as a circle with an X are triggered thresholds. If the circle contains a check mark, it is a reset threshold. The yellow circles indicate that the threshold host command, such as the send system operator a break message, was executed, while the red circles indicate that no host command was executed. You can view additional information about the event—such as the value that caused the trigger or when the trigger occurred—by accessing the event properties.
We’ve Only Just Begun...
We have shown you ways to get performance information using monitors with an example of how to use them to your advantage. We are not performance experts, but these tools help us keep control of our systems and find problems before our users do. With a bit of creativity and hands-on experience with Management Central monitors, you will be able to do even more. Hopefully, you’ll never have to become a performance expert, but you now have more tools to make your system extremely efficient. Stay tuned for more things cooking in the IBM development labs to help make managing your AS/400 systems easier.
REFERENCES AND RELATED MATERIALS
• General Management Central information: www.ibm.com/eserver/iseries/sftsol/MgmtCentral.htm
• Wireless access to Management Central monitors (new V4R5): www.iseries.ibm.com/sftsol/pervasive.htm
Figure 1: Get started by learning the basic concepts of Management Central.
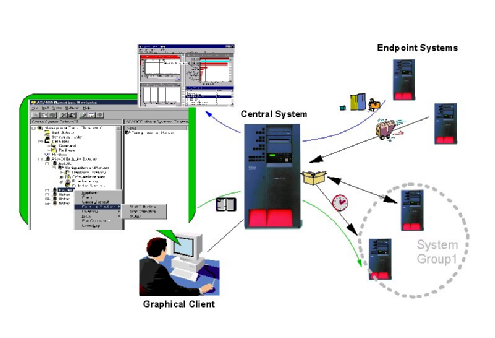
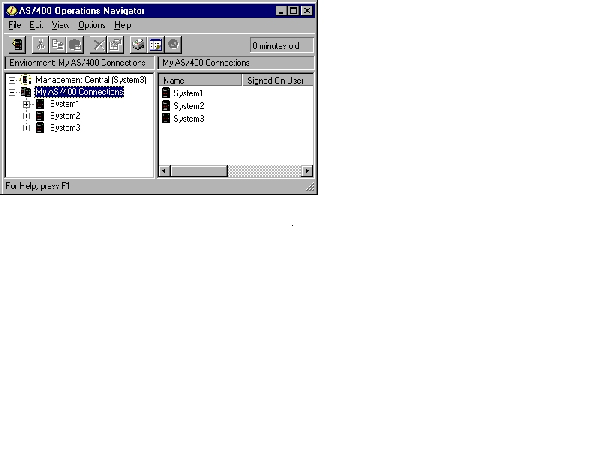
Figure 2: The metrics are the first items you’ll select to create your new monitor.
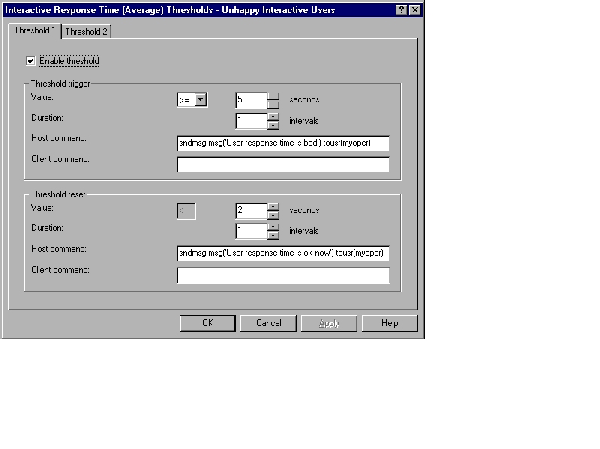
Figure 3: Thresholds can be set up to send you a message.
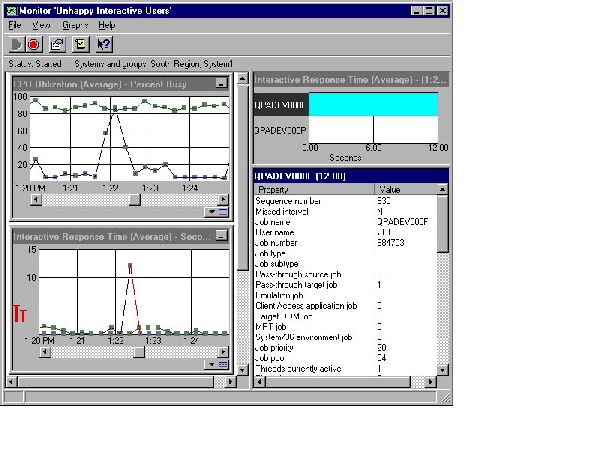
Figure 4: The graph will show you the performance data in real time.


 More than ever, there is a demand for IT to deliver innovation. Your IBM i has been an essential part of your business operations for years. However, your organization may struggle to maintain the current system and implement new projects. The thousands of customers we've worked with and surveyed state that expectations regarding the digital footprint and vision of the company are not aligned with the current IT environment.
 TRY the one package that solves all your document design and printing challenges on all your platforms. Produce bar code labels, electronic forms, ad hoc reports, and RFID tags – without programming! MarkMagic is the only document design and print solution that combines report writing, WYSIWYG label and forms design, and conditional printing in one integrated product. Make sure your data survives when catastrophe hits. Request your trial now! Request Now.
 Forms of ransomware has been around for over 30 years, and with more and more organizations suffering attacks each year, it continues to endure. What has made ransomware such a durable threat and what is the best way to combat it? In order to prevent ransomware, organizations must first understand how it works.
 Disaster protection is vital to every business. Yet, it often consists of patched together procedures that are prone to error. From automatic backups to data encryption to media management, Robot automates the routine (yet often complex) tasks of iSeries backup and recovery, saving you time and money and making the process safer and more reliable. Automate your backups with the Robot Backup and Recovery Solution. Key features include:
 Business users want new applications now. Market and regulatory pressures require faster application updates and delivery into production. Your IBM i developers may be approaching retirement, and you see no sure way to fill their positions with experienced developers. In addition, you may be caught between maintaining your existing applications and the uncertainty of moving to something new.
 IT managers hoping to find new IBM i talent are discovering that the pool of experienced RPG programmers and operators or administrators with intimate knowledge of the operating system and the applications that run on it is small. This begs the question: How will you manage the platform that supports such a big part of your business? This guide offers strategies and software suggestions to help you plan IT staffing and resources and smooth the transition after your AS/400 talent retires. Read on to learn:
LATEST COMMENTS
MC Press Online