


- Remote System Explorer (RSE), which gives you access to all your iSeries objects
- iSeries Projects to keep your work organized
- The Remote Systems LPEX editor
- Verify and compile interfaces
- The Integrated iSeries Debugger
Solid, easy-to-use debugging
tools are an integral part of any modern development environment. Because
Development Studio Client 5.0 gives you the ability to develop native iSeries
applications as well as Web and Java applications that may or may not run on the
iSeries, it also provides debugging facilities for various runtime
models.
Those of you who trust the modern programming tools to help find
bugs will find the new Integrated iSeries Debugger quite convenient for your
daily RPG, COBOL, CL, Java, C, and C++ debugging needs. You can set breakpoints
while you work with the source of your program in the iSeries editor. When you
start the debugger, those breakpoints will be in effect. Step through your code,
monitor variables and storage, display source for various entries on the call
stack, get easy access to debugging Toolbox program and service program calls,
debug client/server applications, and much more, using a single debug
perspective!
Development Studio Client 4.0 did not have an Integrated
iSeries Debugger. Instead, users had to launch the well-known IBM Distributed
Debugger, which ran as a separate process and did not look anything like an
Eclipse component. Development Studio Client 5.0 users still can access the
Distributed Debugger, but it is included in the product mainly to support older
releases of WebSphere Application Server on the iSeries and VisualAge for RPG.
Debug Perspective
You will find that all debuggers share the same debug
"perspective"--a collection of various resizable views within the same window.
This way, you can leverage your development skills from one runtime model to
another. Figure 1 shows a typical layout of the debug perspective. The "Debug"
view in the top left corner presents all of the debug-specific actions--step,
run, suspend, etc. At the same time, all the jobs/processes under debug and
their respective threads and call stacks are listed within this same view. Your
source code is shown in the source editor/browser view, which typically takes up
most of the real estate of the debug perspective. While Java source will have an
associated outline view of your class, Development Studio Client 5.0 provides
this feature in the RSE perspective for languages like RPG and COBOL.
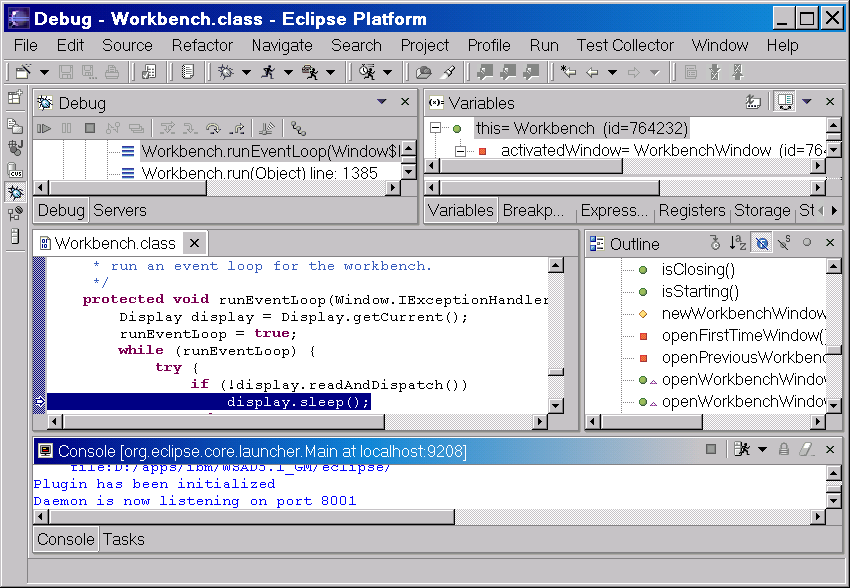
Figure 1: A typical debug perspective layout shows actions, jobs, code,
and more. (Click images to enlarge.)
The top right corner of the debug perspective contains a
number of views that overlay each other. Switching between different tabs will
give you a way to look at the breakpoints, variables, and storage and will list
programs that are currently under debugger control. Different features are
available for different languages and host platforms. We will give more details
on this when we discuss iSeries-specific features.
Since Development
Studio Client 5.0 is built on top of Eclipse technology, views can be easily
added, removed, or rearranged within the Debug or any other perspective. For
example, we recommend that iSeries users remove Registers and Expressions views,
since these don't apply to iSeries. Likewise, it may be useful to add a
Properties view that gives detailed descriptions of various debug elements, like
breakpoints or call stack frames. To remove a view, just press the x in
its top right corner. To add the Properties view, select Window -> Show View
and select Properties if it is listed or Other -> Basic and then Properties.
To restore the original Debug perspective, select Window -> Reset
Perspective.
Typically, the Debug perspective comes up every time you
invoke a debugger. However, you can also bring up the Debug perspective manually
using Window -> Open Perspective.
If the Debug perspective has
already been opened before, yet you are currently working in some other
perspective (for example J2EE, RSE, or iSeries Projects), you can switch back by
simply selecting the little bug icon in the left margin of the workbench
window.
Setting Up the Environment
Before you can debug your application or access any
object on the iSeries using Development Studio Client 5.0, you need a
connection to your iSeries system. Start the workbench by selecting Start ->
Programs -> IBM WebSphere Studio -> Development Studio Client for iSeries.
This will display a dialog asking you for the directory for the workspace, where
everything you are working on locally is stored. Once you specify the directory
and click OK, the Development Studio Client workbench comes up.
To access
your iSeries objects, you want to be in the RSE perspective, which allows you to
invoke the actions for your host development. To open any perspective, select
Open Perspective from the Window menu and select the desired perspective. If it
is not listed, click on Other... to get a list of all available perspectives and
select it from there. See Figure 2.
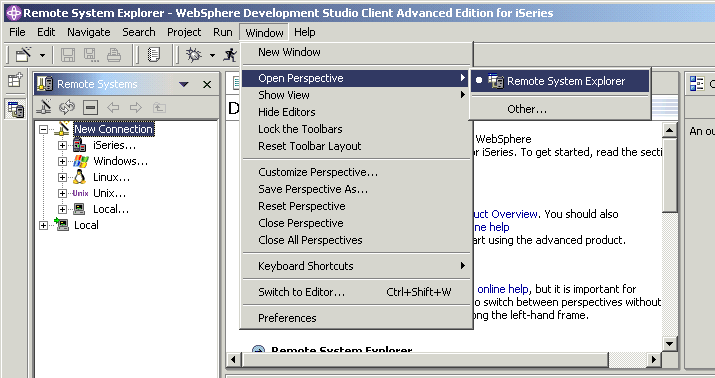
Figure 2: Use the drop-down menu lists to open different
perspectives.
The RSE, like any other perspective, consists of a
combination of views: the Remote Systems view on the left, which lists all
iSeries systems that the workbench knows about; the Edit view in the middle,
where you work with your source; the Outline view for easy navigation of the
source; a Properties sheet; and a tabbed notebook for host-specific
information.
To define a connection between a workstation and the
iSeries, simply expand the New Connection node in the Remote Systems view and
select iSeries by double-clicking it or clicking on the plus sign (+) in front
of it. This displays the New iSeries System Connection wizard (Figure 3). The
profile name defaults to the workstation name, so you can just press Next. The
communication between the workstation and the iSeries uses TCP/IP. You only have
to specify the host name of your iSeries. The default connection name will match
the host name. Notice that this is the name that will be listed in the Remote
Systems view.
Press Finish to create your new connection.
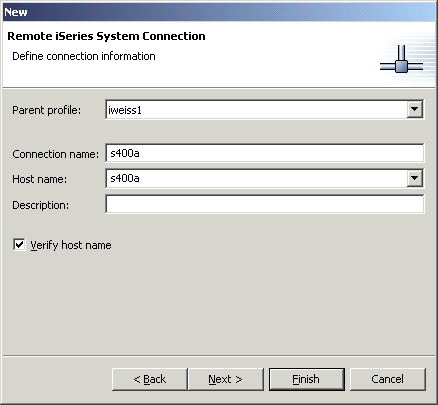
Figure 3: Use the New iSeries System Connection wizard to establish your
connection between the workstation and the iSeries.
To access iSeries
objects, expand the connection. This will list four iSeries subsystems: iSeries
Objects, iSeries Commands, iSeries Jobs, and IFS Files, each with its own set of
predefined filters to which you can add your own. Expanding iSeries Objects
lists a number of filters, including the library list as it is initially set by
your user profile. The popup menu of the objects (right-click the object) lists
all default actions that are available for the selected type of
object.
Before you can run or debug your application, you have to set
your library list. You can do that by dynamically changing your library list
from the popup menu, but a better and persistent way to do this is by adding the
required libraries to the Properties of the iSeries Objects. Select Properties
from the popup menu of the iSeries Objects, select Initial Library List in the
properties tree (see Figure 4), and enter the library names either to the top or
bottom of your library list. Here, you can also set a current library. Don't
forget to press the Add button. In this window, you can also reorder the entries
you made already. Every time you start this connection, the libraries will be
added to the libraries from your user profile.
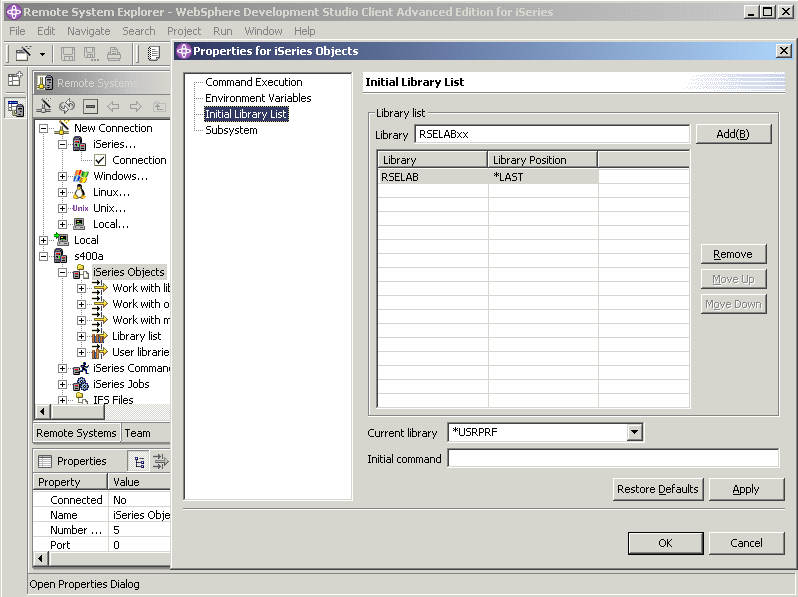
Figure 4: Set your library list by adding the required
libraries to the Properties of the iSeries Objects.
Note: The
properties are set when you log on to the connection. Changes to the properties
that are added afterward will come into effect when you disconnect and then
reconnect. Use the popup menu of the connection or iSeries Objects to
disconnect.
Tip: You can create multiple connections to the same
iSeries host and specify a different library list for each one.
Now,
everything is set up so that you can work with your iSeries objects. Expand the
Library List in the iSeries Objects subsystem. The first time you do this, you
are prompted to log on. You can choose to save the user ID and password
information to avoid being prompted again, even after rebooting your
workstation.
Preparing Your Program for Debugging
Editing
To open a source member in
the LPEX editor, expand the source file and double-click on the member you want
to edit. The source is displayed, and a tab at the top of the source view allows
you to switch easily between different sources that you want to work with at the
same time. These could be different modules of the same program or a calling and
called program, for example. See Figure 5.
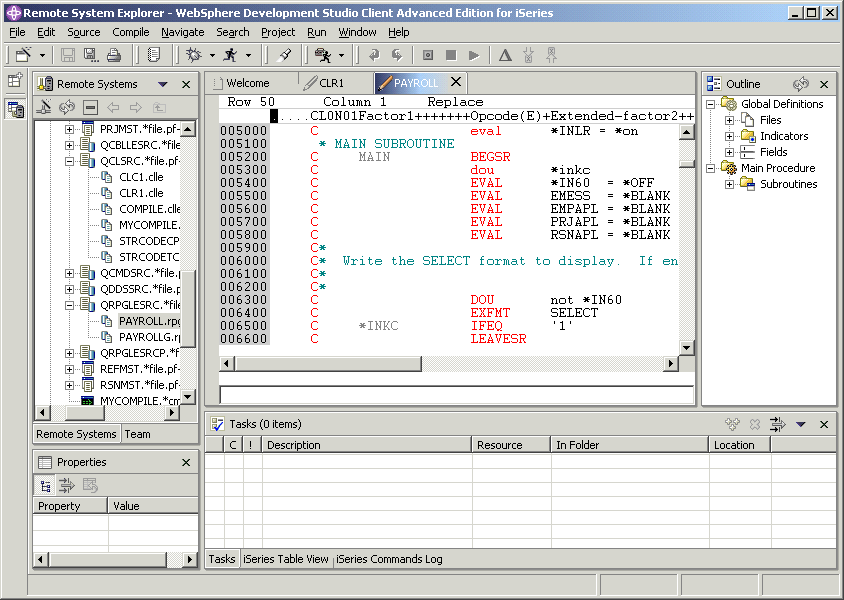
Figure 5: The RSE editor allows you to work on more than one source member
at a time.
If you are a CODE user, you will find the editor's user
interface and functionality familiar. Notice that the source in the editor gets
tokenized the same way as in the CODE editor, which means that the different
language elements get displayed in different colors to enhance readability. This
helps you find errors in your source faster. If you, for example, accidentally
marked a line as a comment, it will be displayed in just one color, and you will
notice your error right away.
For those of you who are just starting to
work with a workstation editor, it may be easier to start with functions that
are the same as in SEU. You can use most of the SEU line commands--such as I, D,
M, and MM--in the sequence number column. As you would expect, pressing F4 will
prompt you for the selected command, and pressing F1 will display the command
description from the online Language Reference.
A significant portion of
working with an editor involves finding a specific place in the source. What you
want to avoid, especially in large programs, is scrolling until you find the
line you are looking for. There are, of course, the different Find options
available from the Edit menu. Like in CODE editor, there is also the option to
filter source. You can filter by date, comments, SQL statements, or other
categories, depending on the programming language. Filtering by comments will
give you a view of all the comments in your source, suppressing all other lines.
This allows you to read through the text much faster. A plus sign (+) in front
of the number column indicates wherever source lines are not currently shown.
Clicking on the plus sign will show all lines up to the next comment.
To
get all of the source to display again, select Show All from the Edit menu or
the popup menu in the source view.
The Outline view gives you an overview
of the structure of your program. For RPG, it lists global definitions like the
files used in the program, indicators and fields, and subroutines and procedures
and their parameters and local definitions. Double-clicking on any entry in the
Outline view takes you directly into the source at the position of the first
occurrence of the selected entry.
By default, every line of code you
enter or change is syntax checked as soon as you move the cursor off that
line.
Make all your changes and save the source either locally or back to
the iSeries.
Verify your source locally to ensure a clean compile on the
iSeries. The Verify action is available from the popup menu of the source member
in the RSE.
Compiling
Once you have verified your source, you use a compile
command in the RSE. Select your source and pick the appropriate compile command
from the popup menu. The default debug option for compile from the workstation
is different from the compile commands on the host. For ILE, Debugging Views is
set to *SOURCE; for non-ILE, *SRCDBG is the default. Click the Advanced button
to get all the options for the compile command listed in the dialog. See Figure
6.
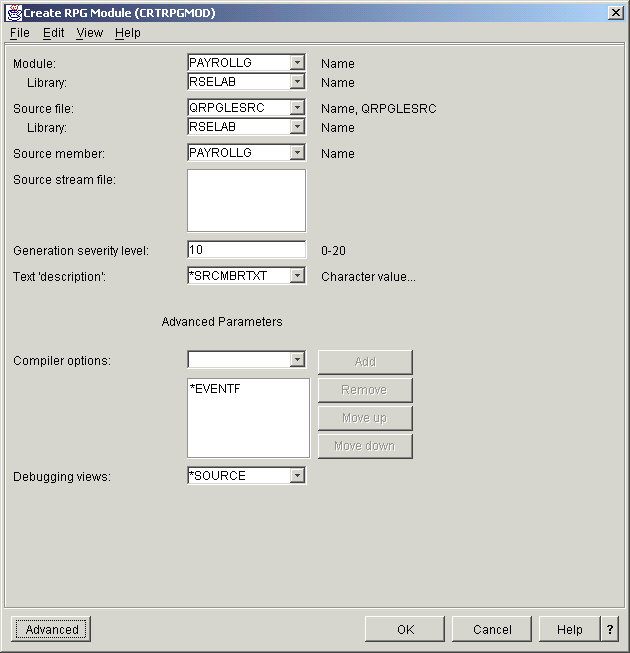
Figure 6: The CRTRPGMOD screen provides your RPG compile
options.
Once you've created the module, scroll up to it in the RSE
view. Then, from the module's popup menu, select CRTPGM or CRTSRVPGM. See Figure
7.
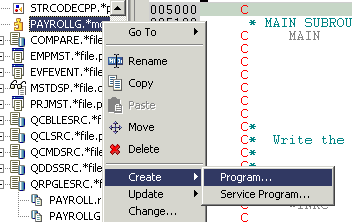
Figure 7: Now, it's time to create your program.
You may have to
press the Refresh button ![]() in the Remote Systems toolbar to see a newly created object.
in the Remote Systems toolbar to see a newly created object.
Debugging iSeries Programs
Starting the Integrated iSeries Debugger
The RSE perspective is where
you typically initiate your development actions. You just made changes to your
code using Remote Systems LPEX Editor, and you verified and compiled your
source, but your application is not behaving as intended. If you have a good
idea as to which program or service program is at fault, just select it in the
RSE, right-click, and pick one of the actions from the Debug As menu. For
example, if your application does not have any screen I/O, you can select Debug
As -> Batch (see Figure 8). Be sure that your library list for the RSE
connection you are using is set up correctly, as described earlier.
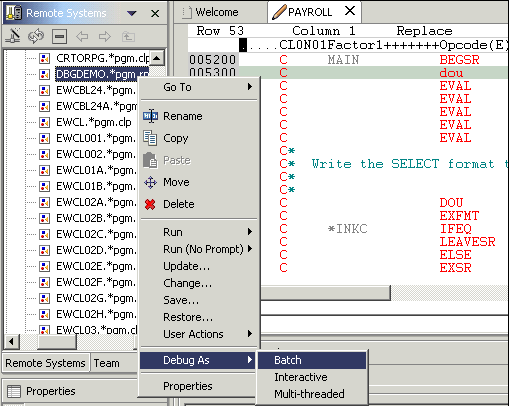
Figure 8: Select the program that's not behaving properly and then use the
debug options offered in the Debug As menu.
The Debug perspective
will come up, and the iSeries debug session will start (see Figure 9). Your
program source will be displayed in the debugger source browser in the middle of
the perspective. The current line of execution is highlighted in the view and
marked with an arrow in the prefix area (the left margin in the source browser).
For visual convenience, all executable lines are in blue, while comments and
other non-executable statements are in dark cyan (these colors are not
customizable).
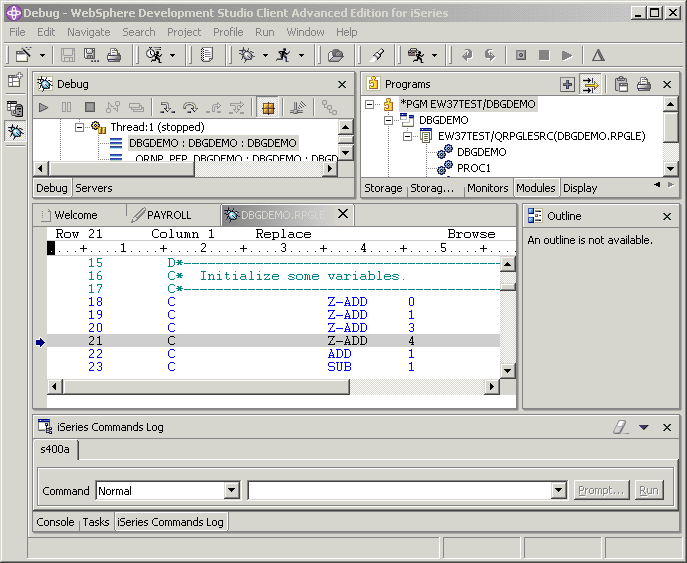
Figure 9: The iSeries debug session highlights each line of code as you
work on it.
Most languages support *SOURCE, *LISTING, and *STATEMENT
debug views if the program or module was compiled with one of these debug
options. Right-click anywhere in the source browser, and use the Switch View
menu option to switch between available views (see Figure 10). The majority of
debug actions can be performed from the source browser (e.g., stepping, running
to a specific line, setting various kinds of breakpoints, displaying variables
and storage). There is usually a very intuitive (point-and-click) way of
performing these operations.
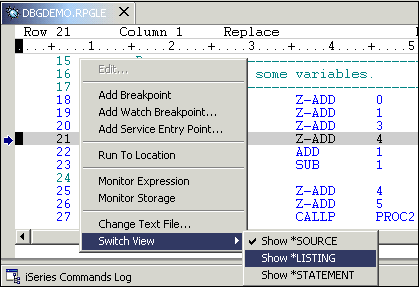
Figure 10: The Switch View menu option allows you to switch between
available debug views, such as *SOURCE, *LISTING, and
*STATEMENT.
Tip: If you would like to get an editable version
of your source while in the Debug perspective, select Edit... from the popup
menu in your source browser. The source will open in the iSeries editor.
Specifying Debug Session Preferences
If you would like to debug an application that
accesses production libraries on your iSeries, you must specify the Update
Production Files setting. If you use one of the prompt options to start up the
Integrated iSeries Debugger, you can specify this value in the dialog box.
However, if you invoke the debugger via a popup menu from the RSE, you will need
to use the Preferences dialog to set the value. The Windows->Preferences menu
will bring up the dialog. Select Debug->iSeries Debug to display the required
page.
Integrated iSeries Debugger needs to know the IP address of your
workstation. Typically, that setting can be figured out programmatically.
However, IBM has discovered that, in certain network configurations, the IP
address returned by the socket APIs does not yield the actual IP address that
your workstation is known as. IBM plans to fix this bug in the next release, but
meanwhile, you can manually specify the IP address of your workstation via the
Integrated iSeries Debugger preference page under the Workstation Host Name
Address control.
Controlling Program Execution Flow
Integrated iSeries Debugger, just like a
green-screen debugger, supports two stepping modes: step over and step into.
Both actions are available from the toolbar and popup menu of the Debug view
(top left corner of the debug perspective) as well as from the Run menu of the
main window. The step into action should be used when execution is stopped at
the call to some routine that you would like to debug. In any other situation,
step over and step into both go to the next statement. The corresponding
shortcut keys are F5 for step into and F6 for step over.
Note: If
the routine you are about to call and any routines that it calls are compiled
without debug data, the step into action has the same effect as step over.
The Resume (or Run) action is also available from the toolbar and popup
menu of the Debug view and from the Run menu. F8 is the corresponding shortcut
key. The Run To Location command (available via the popup menu in the source
browser and the prefix area) is very useful when you want to stop at a specific
location but do not feel like setting a line breakpoint for future use. Run To
Location is context (line)-sensitive and hence has neither toolbar button nor
shortcut key.
Line breakpoints can be set by double-clicking in the
prefix area of any executable line or by using the popup menu in the source
browser and the prefix area. Alternatively, you can use the Add Line Breakpoint
wizard, which is invoked from the popup menu in the Breakpoints view (see Figure
11).
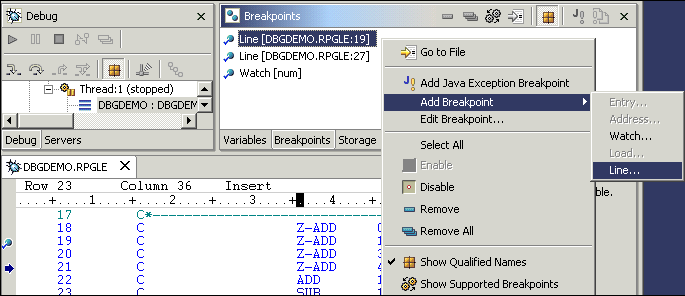
Figure 11: Bring up the Add Line Breakpoint wizard.
In
particular, to set a conditional breakpoint, you will need to enter a valid
Boolean expression in the Expression field on the second page of the wizard (see
Figure 12). Once a line breakpoint has been set, it will show up as a blue dot
with a checkmark in the prefix area of the corresponding line.
Tip: If you are setting a line breakpoint inside a loop but would
like your program to stop, for example, only every third time through the loop
execution, enter 3 in the Every field within the Frequency group on the second
page of the Add Line Breakpoint wizard (Figure 12). Similarly, you can use From
and To fields to control how often your program will stop.
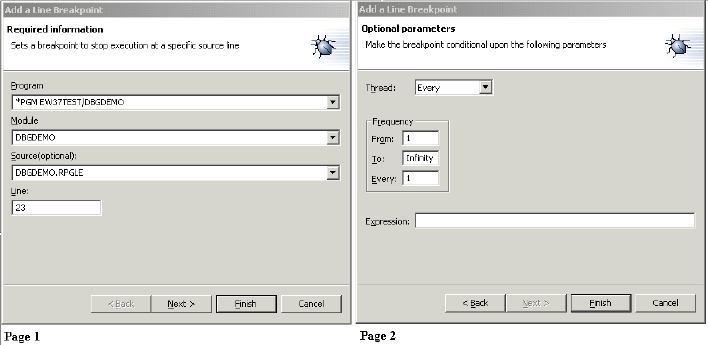
Figure 12: These screens in the Add Line Breakpoint
wizard walk you through the steps.
Similarly, watches are set through
the Add Watch Breakpoint wizard. In the source browser, double-click on a
variable that you would like to set a watch on, and it will get selected. Bring
up the popup menu (using a right-click), which will contain an Add Watch
Breakpoint option (see Figure 10). In this case, the Address Or Expression entry
field will already be populated with the selected variable. Alternatively, you
can use a popup menu in the Breakpoints view (see Figure 11) to bring up the
same wizard. Leave the Number Of Bytes To Watch set to zero if you want to watch
a variable in its defined length.
Using watches can be handy when you
want to monitor changes of a variable or variables as you run or step through
the code. Watches can be set for any valid variable. If the content of a watched
variable changes during the execution of your program, execution stops, and the
user is notified about the variable being changed and given control. The program
execution stops at the next statement after the one that caused the
change.
Note: If the variable gets changed in a non-debuggable
module, the watch notification message will also be displayed. The program
execution will then stop at the next debuggable statement after the call.
All line breakpoints and watches that are set successfully are listed in
the Breakpoints view (see Figure 11). From that view, you can modify breakpoint
properties and enablement. Currently, the Integrated iSeries Debugger supports
line breakpoints and watches. However, IBM plans to add advanced breakpoint
features.
Displaying Variables
One of the major advantages of the Integrated
iSeries Debugger is its capability to display many program variables at the same
time in one monitor view. If you want to quickly examine a variable, simply
position the cursor over that variable in the source browser, and a little popup
window will show its value. This works well for scalars, but complicated
structures and arrays require more-structured viewing space.
For
languages like C, C++, and Java, you can take advantage of the Variables view
that displays the list of all local variables in scope. Unfortunately, the
current version of the Integrated iSeries Debugger does not support the
Variables view for languages like RPG, COBOL, and CL. But not to worry; you can
add your variables to the more permanent Monitors view.
Double-clicking
on a variable in the source browser will select that variable. A right-click
will bring up a popup menu from which you can select the Monitor Expression
option (see Figure 13). The top right part of the workbench window will switch
focus to the Monitors view (if it's not already in focus), and your variable
will show up in that view along with other variables that you may have added
thus far.
Alternatively, you can use the Monitor Expression dialog that
is accessible via the plus sign-like toolbar button in the Monitors view (see
Figure 13).
As you step through your program, variables in the Monitors
view get updated to reflect their up-to-date values. Variables that have changed
their value as a result of the last step or run are colored in red. Therefore,
if you end up with a large number of variables in that view--say over 50--you
might notice that debugger performance degrades slightly. At this point,
consider removing some of the variables from the Monitors view.
Tip:
If you select a variable in the Monitors view and then select another one
while holding the Shift key, all variables between those two will get selected.
You can remove them all in one shot either by using the toolbar button that
looks like a minus sign (-) or by simply pressing the Delete key.
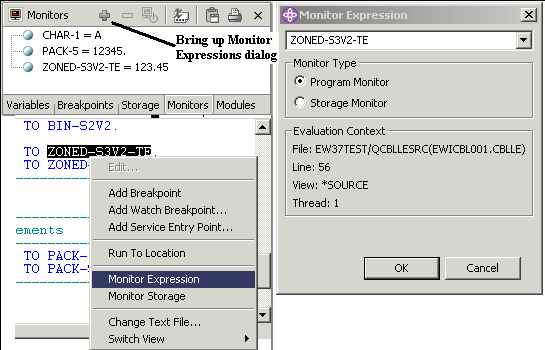
Figure 13: Use the Monitor Expressions windows to view your
variables.
Data structures and arrays are displayed in the tree
format. You can expand the entire tree to see all the fields or array elements.
The Debugger also gives you the ability to expand only parts of the data
structure or to see only part of the array. This is handy if you would like to
see multiple variables at the same time.
Double-clicking on a variable
in the Monitors view makes its value editable. At this point, you can type in
any valid value and press Enter. The value of the variable will be changed.
Alternatively, you can use the Monitor Expression dialog to enter a new value.
Anything that is valid on the EVAL command will work here as well, but no need
to type EVAL! Right-clicking on a variable in the Monitors view brings up a
popup menu that includes an option to change the variable's
representation.
Documentation for the Integrated iSeries Debugger is
always at your fingertips. Just press F1. To get more help, simply follow the
corresponding iSeries links. Keep in mind that the same debug perspective is
used for Java debugging as well, so some of the information will not apply to
RPG, COBOL, or CL.
Debugging Interactive Applications
Thus far, we have covered all the major features of
the Integrated iSeries Debugger and its tight integration with the RSE. Let's
look at a more-sophisticated iSeries application, which consists of a program
(PGM_A) that calls a service program (SRVPGM_B). Suppose PGM_A puts up a 5250
screen and, depending on user input, calls either procedure PROC1 or PROC2 in
SRVPGM_B. In addition, you suspect that a problem you are chasing occurs inside
PROC1; therefore, you are interested in debugging only that procedure.
In
this scenario, simply select SRVPGM_B in the RSE and use the Debug As ->
Interactive option from the popup menu. A Debug Launch Configuration dialog will
come up. The What To Debug page (where you indicate the name of the program or
service program you wish to debug) will be pre-filled with the name of the
service program you selected in RSE. At the same time, the How To Start page
(where you specify how your application should be invoked) in that same dialog
will initially show a little error icon. You need to switch to that page and
fill in the program name (and parameters, if any) for the CALL command (see
Figure 14). If you use a command to start your application, you need to enter
your command name in the Command To Start Application area. Optionally, you can
use the Prompt... button to fill in all required parameters.
Note:
The Command Prompt dialog is currently implemented using Swing Java
components and therefore is not modal to the workbench. This sometimes causes
confusion, as the dialog can be easily hidden behind the workbench and other
windows on your desktop.
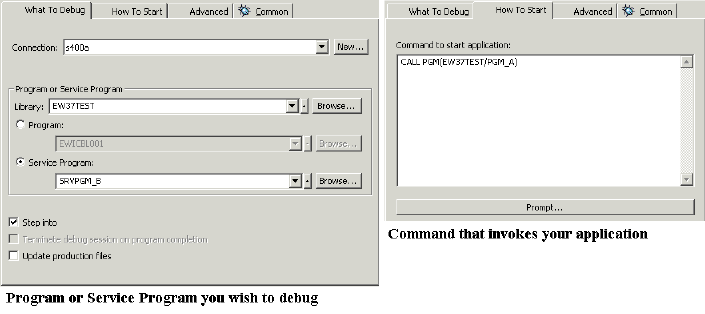
Figure 14: Some fields in What To Debug are automatically filled in.
Others must be filled in manually.
In addition, it's a good idea to
name this launch configuration so that in the future it can be identified and
invoked from the history of all debug launches. Specify any unique name (for
example, SRVPGM_B) in the Name field at the top of the dialog. Once all required
fields are filled in, the Debug button at the bottom of the Launch Configuration
dialog will become enabled and you can fire up your debug session.
One
scenario in which Development Studio Client requires a 5250 emulation session is
when you run or debug an interactive application. If you don't have an active
RSE emulation session already, you will be prompted to start a 5250 session and
to run the STRRSESVR command, which will associate that emulator session with
the Development Studio Client communications job (see Figure 15).
Tip:
You can simply cut and paste the complete STRRSESVR command from the prompt
window. See item 3 in Figure 15.
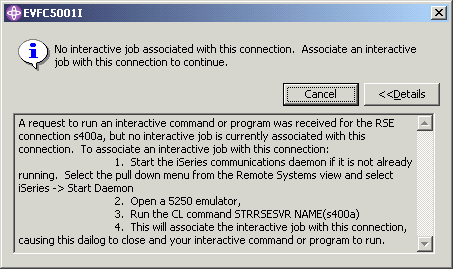
Figure 15: For some debug operations, you'll need a 5250 emulation
session.
Once the RSE server is invoked in the 5250 session, the
prompt dialog will dissapear and the debug session will start. Your application
will be executing in that 5250 emulator window, and that's where all your
screens will be displayed.
Debugging an iSeries Job
If setting up your application's environment is
laborious or you would like to start debugging an application while it is
already running, the debugger allows you to specify the name of the job of
interest. In such scenarios, you might want to set your breakpoints before even
starting the debugger. If you are aware of the problem areas in your program and
you have the source code handy, you can set line breakpoints before starting a
debug session. Depending on your development model, you may either use the RSE
to open your source or create a local copy in an iSeries project.
To set
a line breakpoint, simply double-click in the prefix area of your source. A
Breakpoint dialog will come up asking you to specify the Library,
Program/Service Program, and Module name that the source file corresponds to.
Since the debugger is not started yet, you must provide this information for the
first line breakpoint you are setting in the source. You will not be prompted
for subsequent breakpoints.
Tip: By default, Program/Service
Program and Module names are filled in with the name of the source in the
editor. Make sure you change these values if this assumption is incorrect. If
incorrect information is specified, the breakpoint will not be honored during
the debug session.
Once you fill out all entry fields and press OK, the
breakpoint will show up in the prefix area of your source as a blue dot. At this
point, it is not active because there is no debug session around. The
next debug session that you start will activate all source file breakpoints, and
they will show up as blue dots with the checkmark to the left in the prefix area
as well as in Breakpoints view.
To start the debugger, you need to bring
up a Launch Configurations dialog and create an iSeries: Debug Job launch
configuration. Select the down arrow to the right of the bug icon on the toolbar
and pick the Debug... menu option (see Figure 16) to bring up the Launch
Configurations dialog. Then, select iSeries: Debug Job from the list of
configurations on the left. From the popup menu (right-click) select New
(alternatively, you can use the New button at the bottom of the configurations
list). You will need to supply the name of your connection, the iSeries job and,
optionally, the Program/Service Program name to debug. Finally, press the Debug
button to start the debug session.
Tip: If you use the Browse
button to get a list of jobs, you can use wild card characters to provide job
name filters. Only jobs that match that filter will be displayed. If your
iSeries has a large number of jobs, such a technique can save you time.
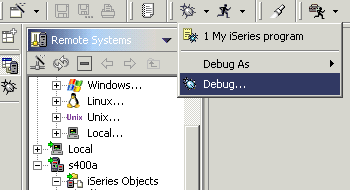
Figure 16: To start the debugger, you need to bring up the Launch
Configurations dialog.
Once the debugger is ready, you will be
prompted to resume or invoke your application on the iSeries host. Make sure
that your application is executing in the iSeries job that you specified in the
Launch Configurations dialog, and then press the OK button on the message. At
this point, your program source will display and you will have control of your
debug session.
Tip: If you specify the name of the program to
debug, Terminate Debug Session On Program Completion will be selected by
default. In this case, your debug session will complete once the program
completes. Note that this option is not available for service programs.
Tip: If you specify the name of the program/service program to
debug and leave the Step Into checkbox selected, program execution will stop at
the first debuggable line in that program/service program. If the
program/service program name is omitted, program execution will stop at the next
debuggable line in your application. If you would like to run till the next
breakpoint is hit, simply deselect the Step Into checkbox.
Give It a Try!
Development Studio Client 5.0 offers a rich
development environment not only for Java programmers, but also for RPG and
COBOL programmers. All tasks--from editing to debugging--are integrated into the
same work environment, thus shortening the learning curve for the new tools.
So go ahead. Give Development Studio Client and Integrated iSeries
Debugger a try, and nobody will know that those bugs ever existed in your
code!
Inge Weiss is a software engineer in the
iSeries Application Development Tools Center at the IBM Canada Toronto
Laboratory. She has a degree in Computer Science from the University in Hamburg,
Germany. Inge worked as a systems engineer for midrange systems at IBM Germany
and joined the IBM Canada Toronto Laboratory in 1985. She has worked on
different projects but spent most of the time in the iSeries tools area.
Currently, she is a member of the iSeries Debugger development team. Inge is a
frequent speaker at COMMON
conferences.
Vadim Berestetsky is a
software engineer at the IBM Canada Toronto Laboratory. He has a Computer
Science degree from the University of Toronto and is currently finishing up his
Master’s thesis. Vadim joined the IBM Canada Toronto Laboratory in 1993
and has worked on various projects within the iSeries tools area. Currently, he
is a technical team lead of the iSeries Debugger development team. Vadim has
previously published technical articles, and he has been a speaker at COMMON and
ITSO conferences.


 More than ever, there is a demand for IT to deliver innovation. Your IBM i has been an essential part of your business operations for years. However, your organization may struggle to maintain the current system and implement new projects. The thousands of customers we've worked with and surveyed state that expectations regarding the digital footprint and vision of the company are not aligned with the current IT environment.
 TRY the one package that solves all your document design and printing challenges on all your platforms. Produce bar code labels, electronic forms, ad hoc reports, and RFID tags – without programming! MarkMagic is the only document design and print solution that combines report writing, WYSIWYG label and forms design, and conditional printing in one integrated product. Make sure your data survives when catastrophe hits. Request your trial now! Request Now.
 Forms of ransomware has been around for over 30 years, and with more and more organizations suffering attacks each year, it continues to endure. What has made ransomware such a durable threat and what is the best way to combat it? In order to prevent ransomware, organizations must first understand how it works.
 Disaster protection is vital to every business. Yet, it often consists of patched together procedures that are prone to error. From automatic backups to data encryption to media management, Robot automates the routine (yet often complex) tasks of iSeries backup and recovery, saving you time and money and making the process safer and more reliable. Automate your backups with the Robot Backup and Recovery Solution. Key features include:
 Business users want new applications now. Market and regulatory pressures require faster application updates and delivery into production. Your IBM i developers may be approaching retirement, and you see no sure way to fill their positions with experienced developers. In addition, you may be caught between maintaining your existing applications and the uncertainty of moving to something new.
 IT managers hoping to find new IBM i talent are discovering that the pool of experienced RPG programmers and operators or administrators with intimate knowledge of the operating system and the applications that run on it is small. This begs the question: How will you manage the platform that supports such a big part of your business? This guide offers strategies and software suggestions to help you plan IT staffing and resources and smooth the transition after your AS/400 talent retires. Read on to learn:
LATEST COMMENTS
MC Press Online