Learn how to view and modify field values and set breakpoints in the Integrated i5/OS Debugger.
Editor's Note: This article is an excerpt from the new MC Press book The Remote System Explorer: Modern Developer Tools for the System i.
Viewing and Modifying Field Values
One of the most important features of any debugger is the ability to examine the values of fields in the running program. The Integrated i5/OS Debugger provides three specialized views for this purpose: Variables, Monitors, and Memory.
Tip: Hovering the mouse over a field in the editor, while debugging, causes a window to pop-up and display the current value of the field. Moving the mouse causes the window to disappear again.
The displayed value for fields in any of the three views is updated automatically as you step through your program. The field name is highlighted in red and decorated with a blue triangle when the value of a field changes:
All three views allow you to change the value of a field. In the Variables and Monitors views, you can change the value of a field by right-clicking the field and selecting Change Value from the pop-up menu. In the Variables view, you can also edit the value of a field directly in the table.
Data structures and arrays show up in the Variables and Monitors views as expandable entries. Initially, only the name of the data structure or array appears, with a plus sign (+) next to it. Clicking the plus sign expands the entry to show the subfields or array elements.
The Variables View
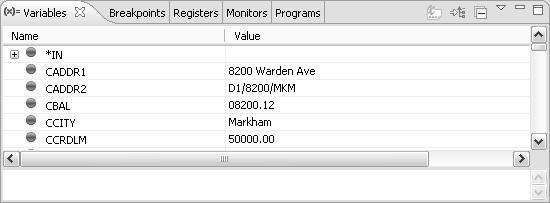
The Variables view displays all variables (fields) defined in the currently selected call stack frame, as shown in Figure 1. If the mainline code of an RPG IV program is selected, this view shows all global fields defined for the program. If an RPG subprocedure is selected, the view shows the fields defined inside of the subprocedure.
Figure 1: The Variables View
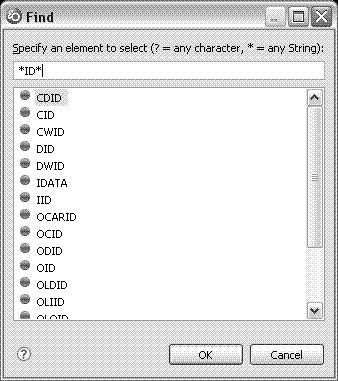
It is common for an RPG program to contain many global fields. The Variables view has a handy "find" function for quickly finding and positioning to the field you are interested in. Within the view, press Ctrl+F, and a Find dialog appears, as shown in Figure 2. As you enter the name of the field in the dialog, the list of fields is filtered based on what you have typed. Once the field you are interested in is selected, click OK (or press Enter), and the Variables view is positioned to that field. The Find dialog supports generic search strings. For example, enter *ID* to see all fields that contain the string ID.
Figure 2: Searching the Variables View
Like many Workbench views, you can apply a filter to the Variables view to show only a subset of the information. The Variables view provides the ability to show only user-defined variables or predefined variables (such as the indicators) using the Filter Locals action, available on the pop-up menu within the Variables view.
The Variables view has two restrictions. First, it only works when debugging i5/OS V5R3 or later and is only populated for ILE RPG and ILE COBOL source. Second, it does not support RPG's *INZSR, or mainline, subroutines. It does support the mainline code, subprocedures, and subroutines defined within a subprocedure.
The Monitors View
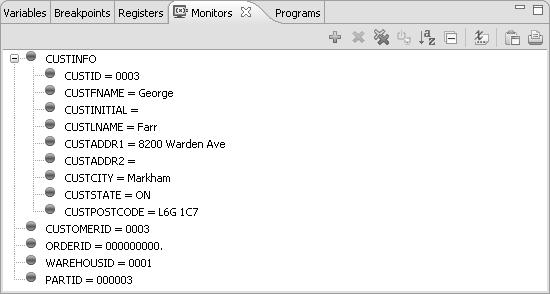
The Monitors view allows you to view and change the values of specific fields you are interested in by explicitly adding them to the view, as shown in Figure 3.
Figure 3: The Monitors View
To add a field to the Monitors view, select it in the debug editor, right-click, and select Monitor Expression from the pop-up menu.
Alternatively, the Monitors view provides an "add" action in the toolbar that allows you to type in the name of the field you wish to monitor:
Most of the other icons in the Monitors view's toolbar are common Workbench actions, such as "remove selected" and "remove all." The following actions are specific to the Monitors view:
• Disable/Enable Monitored Expression (): Use this action to temporarily disable the automatic updating of a field's value in the view. If you have a lot of fields added to the Monitors view and are noticing a delay while stepping through your program, you might want to disable or remove the fields that are not of interest.
• Show Type Names (): This action is not applicable to debugging native i5/OS applications.
You can also right-click a field in the Monitors view to access additional actions, such as changing the value of the field (Change Value) or changing how the value is displayed (Change Representation). Using the Change Representation action, you can toggle between showing the value as hexadecimal and showing the system default for the field's data type.
Tip: One advantage of using the "add" action from the Monitor view is you can enter an array name with an array index. Suppose you are interested only in monitoring the tenth element of the orders array. You could enter ORDERS[10] as the expression instead of adding the entire array.
The Memory View
The Variables and Monitors views both show fields along with a visual representation of their contents. The Memory view allows you to dig deeper and look at the actual layout of a field in memory, as shown in Figure 4. The left side of the Memory view holds a list of the fields added to the view. The right side shows the memory contents for the selected field.
Figure 4: The Memory View
To add a field to the Memory view, right-click it in the editor and select Monitor Memory from the pop-up menu. This action cascades into a list of options for how the contents of each memory location should be displayed. Select the correct option based on the field's data type, or select HEX to see the raw data in memory.
Once a field has been added to the Memory view, you can add and remove additional renderings using the view's toolbar actions. Additional rendering shows up as tabs on the right side of the view.
Setting Breakpoints
Most people think of a breakpoint as being set on a specific line of code in the debugger so that the debugger stops just before the line is executed. We refer to this as a line breakpoint. The debugger also allows breakpoints to be set in the Remote Systems LPEX Editor before the debugger is even started. We refer to these as source breakpoints, since they are set in the source editor. There are also watch breakpoints that can be set on a field to cause the debugger to suspend the program if the value of that field changes.
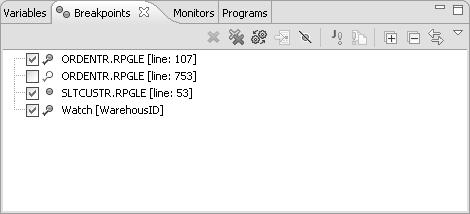
All breakpoints show up in the debugger's Breakpoints view, which provides a central place to work with them. A blue dot is the Workbench's universal symbol for a breakpoint. In Figure 5, some of the breakpoints have a checkmark over the blue dot. Those breakpoints are active in the current debug session.
Figure 5: The Breakpoints View
From the Breakpoints view, you can do the following:
•· Enable and disable breakpoints by toggling the checkbox beside the breakpoint.
•· Remove breakpoints using the "remove selected" and "remove all" icons in the view's toolbar.
•· Add breakpoints by right-clicking in the view and selecting Add Breakpoint > Line... or Watch... from the pop-up menu.
•· Edit breakpoints to make them conditional. (Conditional breakpoints are discussed in more detail later in this chapter.)
•· Use the pull-down menu to change how breakpoints are grouped. For example, to have all breakpoints grouped by their corresponding file (member), select Group By > Files.
Line Breakpoints
A line breakpoint can be set in the editor after the debugger is running. The most common way to set a line breakpoint is to double-click in the vertical ruler on the left side of the editor (to the left of the sequence numbers). Alternatively, right-click any executable line and select Add Breakpoint from the pop-up menu. Both actions set a line breakpoint on the selected line and add a blue breakpoint dot to the margin of the editor.
Double-clicking the blue dot removes the breakpoint. If you attempt to set a breakpoint on a non-executable line, the breakpoint will be set on the first executable line after the selected line.
Tip: To have the debugger run to a particular line and stop, right-click the line in the editor and select Run To Location instead of setting a breakpoint on the line, clicking "resume," and then removing the breakpoint once it's hit.
Source Breakpoints
A source breakpoint is the same as a line breakpoint, except that it is set in the Remote Systems LPEX Editor before the debugger is started. This is useful if you know you want to step through an exceptionally tricky section of code. This is a great example of integration within the Workbench. You can seamlessly flow back and forth between editing and debugging by setting breakpoints in the editor before debugging and then continuing to use the same editor while stepping through the code.
To set a source breakpoint, double-click in the vertical ruler of the editor. Alternatively, right-click any executable line and select Add Breakpoint from the pop-up menu. In either case, a blue dot should appear in the left margin, indicating the source breakpoint has been set. Unless you are already debugging, the blue dot will probably not have a checkmark on it. This means the breakpoint has not been added to a debug session yet.
Source entry points set in called programs and bound service programs need to have the called program or bound service program added to debug. Once the debugger is attached to the i5/OS job, you can add a program or service program to debug using the following steps:
1. Make sure the job is suspended, either at a breakpoint or by selecting the job and clicking the Suspend button.
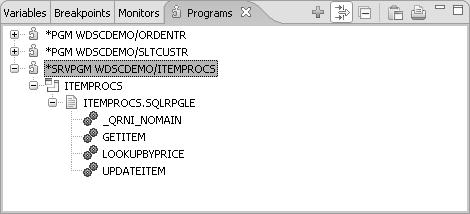
2. Switch to the Programs view. By default, this appears in the tabbed notebook in the top right corner of the Debug perspective, as shown in Figure 6.
3. Click the "add" icon in the view's toolbar.
4. Enter the program name when prompted.
The program is now added to debug, and all source breakpoints related to the program should be activated.
Adding a program to the Programs view is comparable to using the system debugger's Add Program (ADDPGM) and Display Module Source (DSPMODSRC) commands.
Figure 6: The Programs View
Tip: The Programs view is actually called the Modules view. The name of the view is automatically changed when you are using the Integrated i5/OS Debugger. If you are looking for this view in the Show View menu, you will need to look for the Modules view.
Watch Breakpoints
We often come across situations where the value of a field is being unexpectedly modified, and we want to track down when in the program execution this occurs. This can be done using a watch breakpoint. Watch breakpoints are set on a field instead of a line of code. When the value of the field changes, the debugger displays a message box stating that the field has changed and suspends program execution. The current line in the debug editor will be the first executable line immediately following the line that caused the field to change.
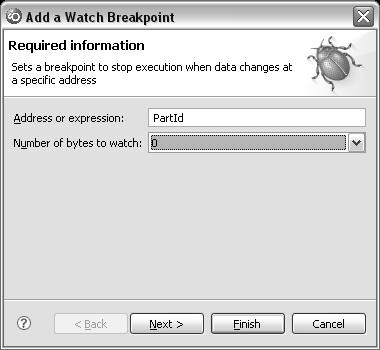
To set a watch breakpoint, select the field in the debug editor, right-click, and select Watch... from the pop-up menu. Alternatively, right-click in the Breakpoints view and select Add Breakpoint > Watch.... This opens the Add a Watch Breakpoint dialog, shown in Figure 7. Enter the field name and number of bytes to watch, and click Finish. A value of zero for the number of bytes to watch means all bytes in the field are monitored for changes. A value of one or higher means that only that number of bytes of the field are monitored for changes.
Figure 7: Adding a Watch Breakpoint
Tip: You can enter an expression in the Add Watch Breakpoint dialog instead of a field name. For example, if you are only interested in knowing when location 89 of the PARTS array is modified, enter PARTS(89) for the expression.
Conditional Breakpoints
Bugs have a nasty way of waiting until the last iteration of a loop until they appear. If you're like us, you repeatedly press F6 as fast as possible to keep stepping through until that last iteration, only to accidentally press it a few too many times and miss the bug completely. (It's amazing that our F6 keys still work!)
Conditional breakpoints to the rescue! After a line or source breakpoint has been set, you can edit the breakpoint to make it conditional. To change how often (the frequency) a line breakpoint suspends the debugger, follow these steps:
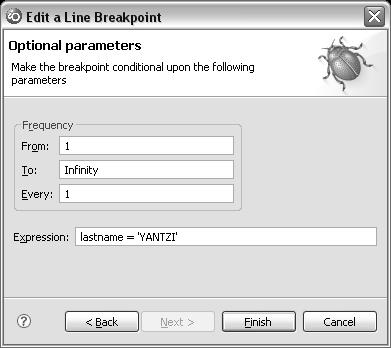
1. Right-click the line breakpoint in the Breakpoints view and select Edit Breakpoint.... This opens the Edit a Line Breakpoint dialog, shown in Figure 8.
2. Click Next to proceed to the Optional parameters page.
3. Change the frequency fields to adjust how often the breakpoint causes the debugger to suspend the job.
Figure 8: Editing a Line Breakpoint
In addition to the frequency, you can enter a Boolean expression using fields from your program. When the breakpoint is hit, the debugger evaluates the expression to determine if the job should continue or suspend. If the expression evaluates to true, the debugger suspends the job; otherwise, the job continues. For RPG, this can only be a simple Boolean expression, not a compound expression.
Conditions on watch breakpoints have to be set when the breakpoint is added; they cannot be modified afterward. When setting the watch breakpoint, click Next on the first page to proceed to the Optional parameters page. Watch breakpoints allow the frequency to be set but do not support expressions.





 More than ever, there is a demand for IT to deliver innovation. Your IBM i has been an essential part of your business operations for years. However, your organization may struggle to maintain the current system and implement new projects. The thousands of customers we've worked with and surveyed state that expectations regarding the digital footprint and vision of the company are not aligned with the current IT environment.
 TRY the one package that solves all your document design and printing challenges on all your platforms. Produce bar code labels, electronic forms, ad hoc reports, and RFID tags – without programming! MarkMagic is the only document design and print solution that combines report writing, WYSIWYG label and forms design, and conditional printing in one integrated product. Make sure your data survives when catastrophe hits. Request your trial now! Request Now.
 Forms of ransomware has been around for over 30 years, and with more and more organizations suffering attacks each year, it continues to endure. What has made ransomware such a durable threat and what is the best way to combat it? In order to prevent ransomware, organizations must first understand how it works.
 Disaster protection is vital to every business. Yet, it often consists of patched together procedures that are prone to error. From automatic backups to data encryption to media management, Robot automates the routine (yet often complex) tasks of iSeries backup and recovery, saving you time and money and making the process safer and more reliable. Automate your backups with the Robot Backup and Recovery Solution. Key features include:
 Business users want new applications now. Market and regulatory pressures require faster application updates and delivery into production. Your IBM i developers may be approaching retirement, and you see no sure way to fill their positions with experienced developers. In addition, you may be caught between maintaining your existing applications and the uncertainty of moving to something new.
 IT managers hoping to find new IBM i talent are discovering that the pool of experienced RPG programmers and operators or administrators with intimate knowledge of the operating system and the applications that run on it is small. This begs the question: How will you manage the platform that supports such a big part of your business? This guide offers strategies and software suggestions to help you plan IT staffing and resources and smooth the transition after your AS/400 talent retires. Read on to learn:
LATEST COMMENTS
MC Press Online