


A picture is worth 1,000 words. In business, a chart is worth 1,000 rows of data. Learn to create charts in real time, just by pressing a function key. I'll explain how.
It's common sense that a well-prepared chart can make a difference when you're trying to prove that the numbers are on your side. From the simplest of charts to the most complex, they all try to provide clarity to the (vast) amounts of data behind them. There are numerous business tools (MS Excel and SAP's Business Object, among others) that are able to generate charts on demand. However, you need to set up a connection or extract the data first. Wouldn't it be nice to see the data on your program's screen and then, just by pressing a key, have it displayed as a chart?
What I mean is going from what's shown in Figure 1…
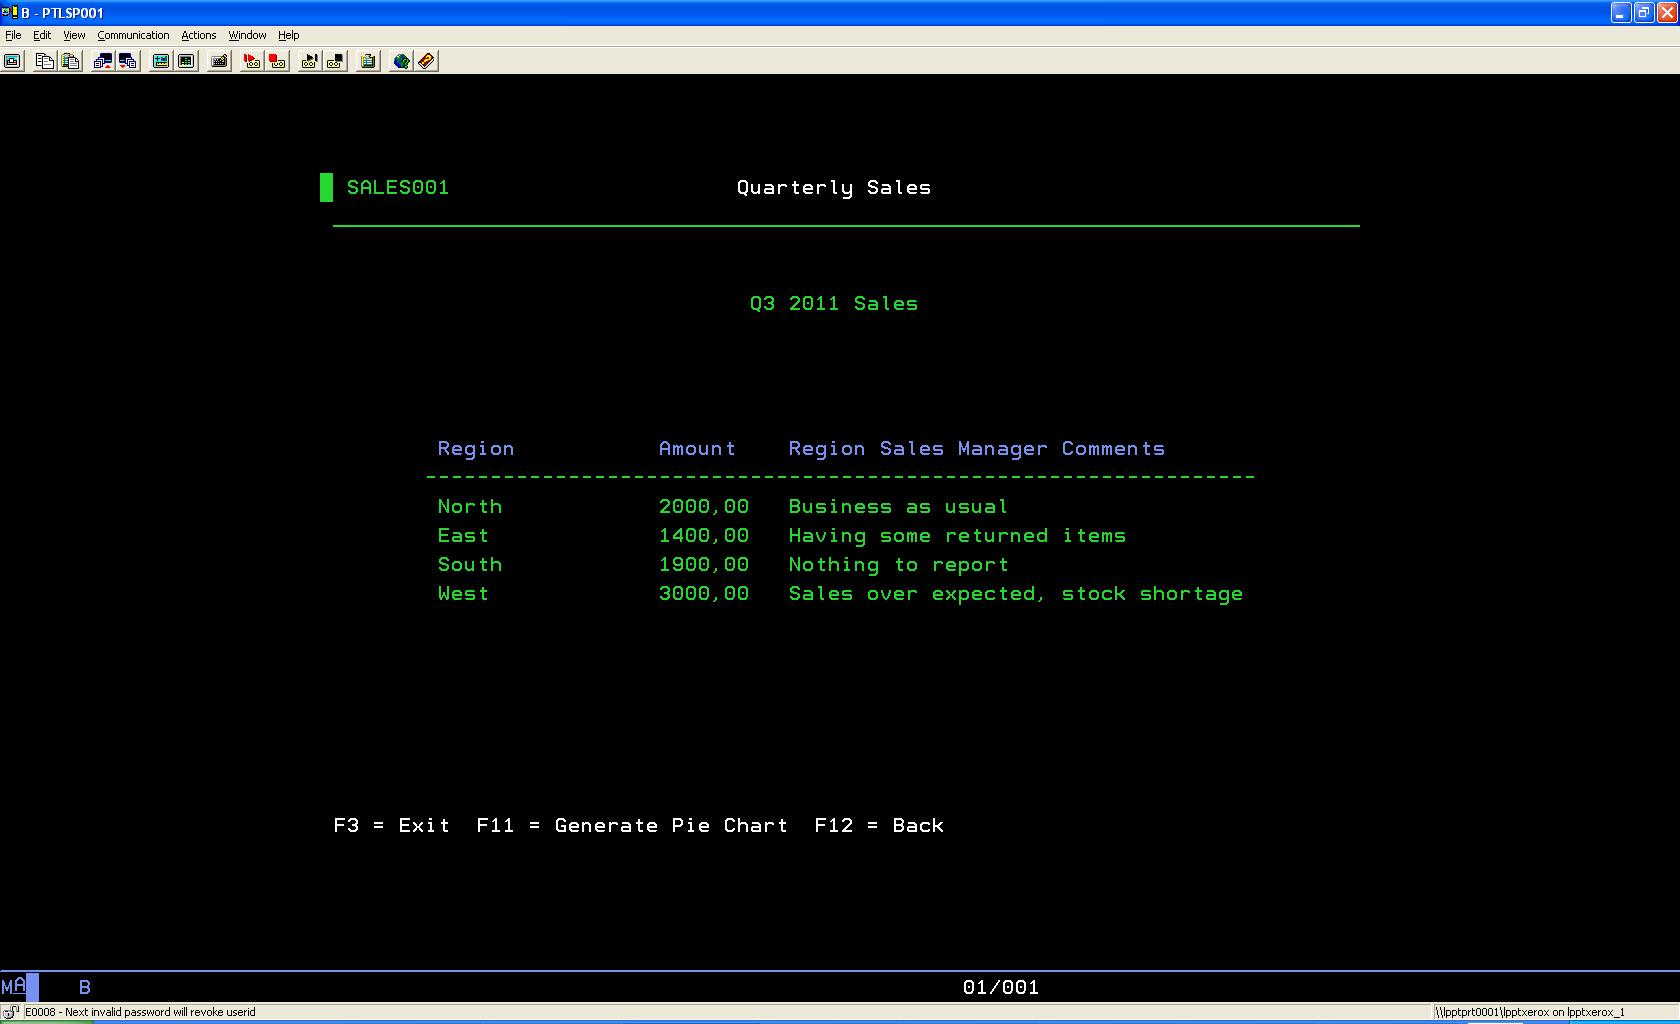
Figure 1: Here's your dreary green-screen data. (Click images to enlarge.)
…to what's shown in Figure 2…
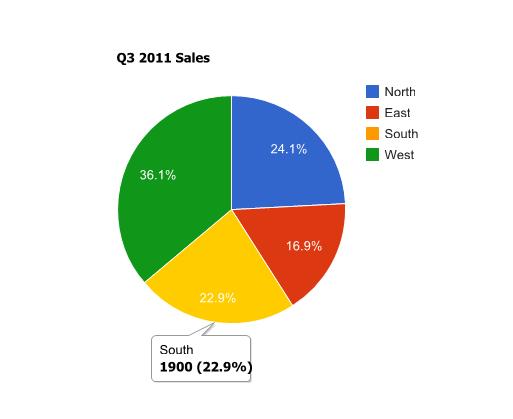
Figure 2: The same data looks a lot nicer now!
…just by pressing a function key!
First, you have to download the CGIDEV2 freeware tool. This is a very powerful tool. Be sure to read the documentation and examples provided. I got to know it as part of the MMAIL, another great tool from easy400.net, which I covered in a previous article.
I'm going to use it to generate an HTML file in a process vaguely similar to a MS Word mail merge. So let's move on to the process of generating the pie chart. I'm going to invoke a Google API by creating an HTML file with some code in it to call the API, thus generating the chart. I'll get a nice-looking, interactive pie chart, as shown in Figure 2. I advise you to read the API's documentation, because I won't explain the inner workings of the API in this TechTip.
Let's go over Google's example source code:
<html>
<head>
<script src="https://www.google.com/jsapi"></script>
<script>
google.load("visualization", "1", {packages:["corechart"]});
google.setOnLoadCallback(drawChart);
function drawChart() {
var data = new google.visualization.DataTable();
data.addColumn('string', 'Task');
data.addColumn('number', 'Hours per Day');
data.addRows(5);
data.setValue(0, 0, 'Work');
data.setValue(0, 1, 11);
data.setValue(1, 0, 'Eat');
data.setValue(1, 1, 2);
data.setValue(2, 0, 'Commute');
data.setValue(2, 1, 2);
data.setValue(3, 0, 'Watch TV');
data.setValue(3, 1, 2);
data.setValue(4, 0, 'Sleep');
data.setValue(4, 1, 7);
var chart = new google.visualization.PieChart(document.getElementById('chart_div'));
chart.draw(data, {width: 450, height: 300, title: 'My Daily Activities'});
}
</script>
</head>
<body>
<div></div>
</body>
</html>
To build a pie chart, I basically need two things: the slice title and the respective value. All those "data.setValue…" lines correspond to the pie's slices. They are going to be the dynamic part of the HTML. Of course, I also need to indicate how many slices my pie will have, so the line "data.AddRows" also needs to be dynamic. Finally, I also want to be able to change the chart's title and dimensions. This last bit is just to give you an idea of what you can customize on the "chart.draw" instruction (read the Configuration Options section of the API documentation for more details). Following CGIDEV2 methodology for HTML creation, I've created a template with three sections: "Header," which will include everything from the beginning of the HTML to the "AddRows…" line; "Row," which is the definition of each slice of the pie chart; and "Footer," for the rest of the html:
/$Header
<!DOCTYPE html PUBLIC "-//W3C//DTD XHTML 1.0 Strict//EN" "http://www.w3.org/TR/xhtml1/DTD/xhtml1-strict.dtd">
<html xmlns="http://www.w3.org/1999/xhtml">
<head>
<meta http-equiv="content-type" content="text/html; charset=utf-8"/>
<title>
/%PageTitle%/
</title>
<script src="http://www.google.com/jsapi"></script>
<script>
google.load('visualization', '1', {packages: ['corechart']});
</script>
<script>
function drawVisualization() {
// Create and populate the data table.
var data = new google.visualization.DataTable();
data.addColumn('string', 'Col1');
data.addColumn('number', 'Col2');
data.addRows(/%TotalRows%/);
/$Row
data.setValue(/%RowNbr%/, 0, '/%RowTitle%/');
data.setValue(/%RowNbr%/, 1, /%RowValue%/);
/$Footer
// Create and draw the visualization.
new google.visualization.PieChart(document.getElementById('visualization')).
draw(data, {width: /%Width%/, height: /%Height%/, title:"/%ChartTitle%/"});
}
google.setOnLoadCallback(drawVisualization);
</script>
</head>
<body style="font-family: Arial;border: 0 none;">
<div style="width: /%Width%/px; height: /%Height%/px;"></div>
</body>
</html>
Everything you see in the template that starts with /% and ends with %/ is a variable name. The lines starting with /$ mark the beginning of a new section.
In order to dynamically generate the proper HTML page with my data in real time, I created an RPG procedure called GenPieChart (see QRPGLESRC/GENCHRT member in the downloadable source code) that receives a few parameters (my data in an array; the page title; the chart's title, width, height, and output file name) and returns a string (used to pass back an error description if something goes wrong). This procedure checks the input parms in routine Init and builds the HTML file in routine Proc. Here's where all the "magic" happens. I start by indicating which template I want to use by invoking the getHtmlIfsMult CGIDEV2 function. Then, the function updhtmlVar is used to replace the /%<variable_name%/ with the data from the entry parameters in order to compose the proper HTML code required to generate the chart. The next step is writing each section to memory. Naturally, I only need to write the Header and Footer sections once, but I'll have to write a Row section for each slice of the pie, or, in other words, for each line of the P_RowDS array. Look at the source code for this particular section:
// Row Section
For W_Idx = 1 to C_MaxRows;
If P_RowDS(W_Idx).RowTitle = *Blanks;
Leave;
EndIf;
// Update the Row variables
updHtmlVar('RowNbr' : %Char(W_Idx-1));
updHtmlVar('RowTitle' : %Trim(P_RowDS(W_Idx).RowTitle));
updHtmlVar('RowValue' : %Char(P_RowDS(W_Idx).RowValue));
// Write the Row section
WrtSection('Row');
EndFor;
I'm using a For cycle, starting with 1 and ending in 20 (the value of C_MaxRows, which you can change in source member QCPYLESRC/GENCHRT_PR). I'll leave the cycle whenever the current line doesn't have a title, which indicates there's no more data in the array. Be careful with this and always clear the array before use!
Then there's a trick: because Google's API expects the values to start at index 0 instead of 1, the RowNbr variable is getting the array position minus 1. After writing each section, it's time to write the file to disk, using the WrtHtmlToStmf(%Trim(W_FileName): 819) instruction, which contains the hardcoded path /GCHARTS/OUTPUT/ and the file name from the P_FileName entry parameter.
Note that I'm using hardcoded IFS folder names. Be sure to copy the GCHARTS folder to your IFS and create a share with the same name. Otherwise, you won't be able to display the chart automatically, as shown on the included sample programs (TST_GENPIE and TSTGENPIE1). You can always change this hardcoding to something a bit more dynamic by using a data area for the Template and Output paths. I decided not to do that in order to try to keep the code as simple as possible. However, I used a data area to store the system name (DaSysName), which you'll need to update to run the sample programs.
That's it for now. The next TechTip of this series will explore the Bar Chart API and analyze a sample program in more depth. Meanwhile, you can download the source code and the GCHARTS IFS folder for this Tip here .

Rafael Victória-Pereira has more than 20 years of IBM i experience as a programmer, analyst, and manager. Over that period, he has been an active voice in the IBM i community, encouraging and helping programmers transition to ILE and free-format RPG. Rafael has written more than 100 technical articles about topics ranging from interfaces (the topic for his first book, Flexible Input, Dazzling Output with IBM i) to modern RPG and SQL in his popular RPG Academy and SQL 101 series on mcpressonline.com and in his books Evolve Your RPG Coding and SQL for IBM i: A Database Modernization Guide. Rafael writes in an easy-to-read, practical style that is highly popular with his audience of IBM technology professionals.
Rafael is the Deputy IT Director - Infrastructures and Services at the Luis Simões Group in Portugal. His areas of expertise include programming in the IBM i native languages (RPG, CL, and DB2 SQL) and in "modern" programming languages, such as Java, C#, and Python, as well as project management and consultancy.
MC Press books written by Rafael Victória-Pereira available now on the MC Press Bookstore.
 |
Evolve Your RPG Coding: Move from OPM to ILE...and Beyond Transition to modern RPG programming with this step-by-step guide through ILE and free-format RPG, SQL, and modernization techniques. List Price $79.95 Now On Sale
|
|
 |
Flexible Input, Dazzling Output with IBM i Uncover easier, more flexible ways to get data into your system, plus some methods for exporting and presenting the vital business data it contains. Now On Sale
|
|
 |
SQL for IBM i: A Database Modernization Guide Learn how to use SQL’s capabilities to modernize and enhance your IBM i database. Now On Sale
|


 More than ever, there is a demand for IT to deliver innovation. Your IBM i has been an essential part of your business operations for years. However, your organization may struggle to maintain the current system and implement new projects. The thousands of customers we've worked with and surveyed state that expectations regarding the digital footprint and vision of the company are not aligned with the current IT environment.
 TRY the one package that solves all your document design and printing challenges on all your platforms. Produce bar code labels, electronic forms, ad hoc reports, and RFID tags – without programming! MarkMagic is the only document design and print solution that combines report writing, WYSIWYG label and forms design, and conditional printing in one integrated product. Make sure your data survives when catastrophe hits. Request your trial now! Request Now.
 Forms of ransomware has been around for over 30 years, and with more and more organizations suffering attacks each year, it continues to endure. What has made ransomware such a durable threat and what is the best way to combat it? In order to prevent ransomware, organizations must first understand how it works.
 Disaster protection is vital to every business. Yet, it often consists of patched together procedures that are prone to error. From automatic backups to data encryption to media management, Robot automates the routine (yet often complex) tasks of iSeries backup and recovery, saving you time and money and making the process safer and more reliable. Automate your backups with the Robot Backup and Recovery Solution. Key features include:
 Business users want new applications now. Market and regulatory pressures require faster application updates and delivery into production. Your IBM i developers may be approaching retirement, and you see no sure way to fill their positions with experienced developers. In addition, you may be caught between maintaining your existing applications and the uncertainty of moving to something new.
 IT managers hoping to find new IBM i talent are discovering that the pool of experienced RPG programmers and operators or administrators with intimate knowledge of the operating system and the applications that run on it is small. This begs the question: How will you manage the platform that supports such a big part of your business? This guide offers strategies and software suggestions to help you plan IT staffing and resources and smooth the transition after your AS/400 talent retires. Read on to learn:
LATEST COMMENTS
MC Press Online