


Online analytical processing (OLAP) is a big buzzword these days. Many IT professionals are talking about using OLAP to analyze trends in large amounts of data and the accompanying tool set required to do this. Perhaps you’ve heard about DB2 OLAP Server for AS/400 or the OLAP Services provided with SQL Server 7.0. Sounds pretty expensive, huh? So how does the average IT guy get in on the OLAP game without spending big dollars for a new server or more software?
If you’re using Office 2000, you already have the ability to perform OLAP processing with AS/400 data by using Microsoft’s OLAP Cube Wizard (OCW). Sound too good to be true? OK, maybe this OLAP tool isn’t able to crunch terabytes of data. As you might have guessed, since this is part of Office 2000, it is a client-based OLAP engine and its usefulness is therefore restricted by data size and the client PC’s processing power. However, Microsoft’s OLAP tool is a useful tool to help developers learn OLAP terminology and functionality before moving on to a larger OLAP product. Look at this technology and learn how you might be able to use it in an AS/400 environment.
Before I continue, I am assuming that you are familiar with basic SQL, how to configure an ODBC data source to the AS/400, Excel 2000, and pivot tables. The Microsoft Query add-in for Excel should also be installed on your computer.
What Are OLAP Cubes?
OLAP cubes provide a way to view summaries of large amounts of detail data. A cube is the OLAP term for a multi-dimensional database. OLAP cubes consist of two data elements: measures and dimensions. (Note: The term data field is used by the OLAP Cube Wizard in place of the official OLAP term measure presumably to make it easier for the user to understand. The terms data field and measure are used interchangeably in this article.) Measures (data fields) are columns of data that are to be aggregated in some way: a column to be totaled, counted, or averaged. Columns in this category might include extended unit price and ship quantity. A unit price amount would not be a good candidate for a measure because it doesn’t do any good to sum a unit price unless you are sure the counted quantity is always one. In SQL terminology, think of measures as those columns contained in an aggregate function: SUM(EXT_UNIT_PRICE) or COUNT(ORDERS).
The second data element found in a cube is the dimension. Dimensions are summary-level data fields by which the measures will be summarized. Columns that fall in the dimension category would be customer name, sales quarter, ship-to region, and item type. In SQL terms, think of dimensions as those columns that are used in the GROUP BY clause: GROUP BY CUSTOMER_NAME or GROUP BY SHIP_TO_REGION.
This structure allows the user to choose one or more of the dimension combinations on the fly and then have the corresponding measure summaries displayed. Think of the OLAP cube as allowing the user to run a summary report for a given set of data (measures) under a set of predefined combinations (dimensions).
Designing a Cube
When designing your own OLAP cube, there are three things you must do:
• Identify each data field (measure) and what type of aggregate is to be performed. (The OLAP Cube Wizard only allows SUM, COUNT, MIN, or MAX.)
• Identify each dimension (summary level) for which you would like to see the measures summarized.
• Write an SQL statement or use the MS Query wizard to extract this information. (Keep in mind that the steps required to build a cube with the OLAP Cube Wizard are different from the steps required to build a cube with other products. With a true OLAP server, more work is required to build a cube correctly.)
Creating an Order Sales Cube in Excel
For this example, I exported the tables from the Northwind Traders sample database that comes with Microsoft Access and Visual Basic to the AS/400 in a library called NORTHWIND. (I changed all column names to uppercase before I did this because it makes the long field names on the AS/400 easier to work with.) The Northwind database contains sales data.
Midrange Network Expert has posted my NORTHWIND DB2/400 test library as an OS/400 Save File (SAVF) called NWINDLB400.SAVF on the Midrange Network Expert Downloadable Code Web site (www.midrangecomputing.com/ mne/code.cfm). To run the example I have listed here, upload this SAVF file to your AS/400 in a library called NORTHWIND. Then run the OS/400 Restore Library (RSTOBJ) command with the following parameters:
RSTOBJ OBJ(*ALL) SAVLIB(NORTHWIND) DEV(*SAVF) SAVF(NORTHWIND/NWINDLB400)
This will set up the database tables that I use in this article. Once you have the database set up, you can run the examples that I discuss here and build your own OLAP Cube in Excel. Doing this will help you get started using Excel OLAP-to-AS/400 connectivity so that you can begin creating your own Excel OLAP cubes with OS/400 data.
Figure 1 shows the Northwind tables and relationships you’ll be dealing with. The identified measures and dimensions appear at the bottom of Figure 1. You are going to view quantity, extended unit price, and maximum extended unit price (highest extended price) as your measures with the option to summarize these measures by any combination of your dimensions: company name, country, region, product name, supplier name, and order date. Figure 2 shows the SQL statement you’ll be using to extract this data.
OLAP cubes are displayed in Excel through pivot tables. Here is a step-by-step list of how to create the cube using the Northwind sample tables I exported to OS/400:
1. Start Excel with a blank workbook.
2. Choose Data from the Excel menu bar, and then choose PivotTable and PivotChart Report.
3. In Step 1 of the PivotTable and PivotChart wizard, choose External data source as the data that you want to analyze and then click Next. This will allow Excel to get data from an ODBC data source.
4. In Step 2 of the Pivot Table Wizard, click the Get Data button.
5. At the Choose Data Source prompt, make sure the Databases tab is selected and choose the ODBC data source for your AS/400. If you don’t want to use the query wizard, uncheck the box labeled Use the query wizard to create edit queries. For this example, clear the Use the query wizard to create edit queries check box.
6. Microsoft Query will appear and display the Add Tables dialog with a table/view list from your AS/400 data source. For this example, click the Close button. (I’ll show you how to enter the SQL statement directly.)
7. To enter the SQL statement, click View, SQL from the menu bar. Library names may be hard-coded in here if you did not store them in your DSN. Enter the SQL statements shown in Figure 2. Whether using the query wizard or entering SQL, make sure all your dimensions and measures are included in the query. Click OK when finished. If you’re presented with the message that SQL Query can’t be represented graphically, click OK again. Your query should have returned some data in the Microsoft query window.
8. Notice that any columns you renamed with the AS clause have been ignored. For this example, columns Ext_Price1 and Ext_Price2 have been renamed to 00002 and 00003. Keep this in mind as you will have to know the contents of these renamed columns. You will be able to rename these columns later in the cube wizard.
9. Choose File and then Save from the Microsoft Query menu bar to save your Microsoft Query definition. This file name ends with a .DQY extension. If for some reason you need to modify your cube, you will have to start over at this point with Microsoft Query by using this .DQY file.
10. From inside Microsoft Query, choose File then Create OLAP Cube from the menu bar. The OLAP Cube Wizard will appear. If an introduction screen is displayed, click Next.
11. In the OLAP Cube Wizard Step 1 screen, the column list from your SQL statement should appear. Choose the data fields (measures) for your cube (field name and aggregate function). You should also rename your data field names here, as shown in Figure 3, as users of the cube will reference these names. Click Next.
12. On the Cube Wizard Step 2 screen, choose the dimensions for your cube from the list of remaining columns. Drag each dimension from the left side of the window to the right side. Right-click on a dimension field to rename it. Notice in Figure 4 how the dimensions can be hierarchical. A hierarchical dimension occurs when one dimension can be rolled up into another. For example, I placed the Region field underneath Country. This is because sales can be rolled up by region into Country. Also, the OLAP Cube Wizard automatically creates a hierarchical dimension with a date field. In Figure 4, the order date was automatically assigned year, quarter, month, and day sub-dimensions. (I unchecked the day box because I didn’t want my data to be aggregated at that fine of an interval.) This feature is nice because your date data can be examined by month, quarter, or year. The lesson here is to make sure you identify where dimensions can be placed in a hierarchy
(e.g.. when one dimension logically rolls-up into another). Click Next when done with the dimension definitions.
13. The OLAP Cube Wizard Step 3 screen provides three options for saving the cube definition. See the sidebar article, “Your Options for Saving Cube Definitions” or choose Help to review the three choices given. Choose an option and click Finish. You will be prompted to save your cube definition. Cube definitions end with an .OQY extension. (If you choose to save the data in a cube file, you must put a name in the file name box. This file should end with a .CUB extension and it is where all of your aggregated data will be stored.) If you plan to publish this data for use by others, save the .OQY and .CUB files on a network drive, preferably with a Uniform Naming Convention (UNC) path—e.g., serverpathAS400NWIND.cub. The creation of a .CUB file may take awhile, depending on the amount of data. In most cases, I recommend using the default option to create a cube file.
14. This brings you back to the PivotTable Wizard, click Next. Choose a beginning cell to store your data in your Excel spreadsheet and click the Finish button.
The Cube File Contents
The OLAP cube file mainly stores summary data based on the aggregates of all possible dimension combinations for your cube definition. Therefore, the number of dimensions and the number of values in each dimension are directly proportional to the cube size. For example, if your cube has two dimensions, a customer with 500 values and items with 700 values, then the maximum number of possible preaggregations stored in the cube file would be approximately 350,000 (500 x 700). However, since every customer hasn’t purchased every item and in fact only purchases an average of three items, realistically there would be about 1500 (500 x 3) summary records to store.
Using the Cube Data in a Pivot Table
I am assuming you are familiar with pivot tables, so this section won’t be a long tutorial on them. For more information on pivot tables, see the appropriate help topics. When the PivotTable Wizard has completed, Excel should show the PivotTable tool bar and a blank pivot table as shown in Figure 5. The PivotTable toolbar should show the dimensions and data fields from your cube.
The PivotTable’s four sections are page fields, column fields, row fields, and data item fields. The data items section can only contain measures; the other sections can only contain dimension columns. Row and column sections are used for summarizing the data in a two-dimensional format. When a dimension is placed in the row section, a row is added to the table for each unique data element in that dimension. So, if the customer dimension is dragged into the row section, a row is shown for each customer. Likewise, if a dimension is dragged into the column section, a column is created for each data value in the dimension. The page section provides an additional subset function for the row and column totals.
Since a picture is worth a thousand words, look at Figure 6. In this example, the extended price measure was dropped into the data item section, the customer dimension was dropped into the row section, and the order year was placed into the column section. Finally, the country was dropped into the page section. With this setup, a customer’s sales (row) can be compared by year (columns). Further, since the country dimension is in the page section, a subset of the data can be selected by choosing a country from the list. In Figure 6, the totals are shown for all customers in Denmark. Notice that the data here is viewed in a three-dimensional format with the year dimension on the X-axis, the customer on the Y-axis, and the country on the Z-axis. Now you know why a cube is referred to as being multidimensional.
An additional feature is the ability to do the subselect—or drilldown—from a list of values in a dimension. Figure 7 shows how individual countries can be selected. Also, since the region is a sub-level of the country dimension, individual regions can be selected within a country.
Of course, it becomes possible to view summaries of your measures by almost any imaginable combination of dimensions that are available in your cube. If you’re not familiar with PivotTable, take the time to experiment with it. It doesn’t take long to realize what a versatile and powerful tool it is!
As a final note, remember to format pivot tables with options found on the PivotTable toolbar. For example, to format the extended price column as currency, use PivotTable’s option for formatting fields—don’t format the cells using Excel’s format cells option. The toolbar also offers some other formatting and sorting options, so be sure to review them.
Publish to the Web!
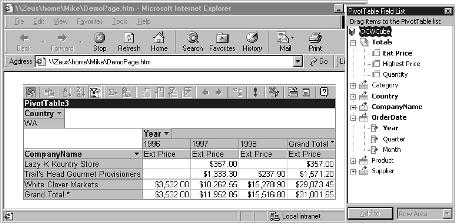
You can do more with the workbook page by adding a chart and publishing it to a Web page for users to access. To do this, make sure that your cube’s query definition (.OQY) and optional cube data file (.CUB) have been saved on a network server that is accessible to all users. To publish the spreadsheet to a Web page from Excel, choose File from the Excel menu bar, then choose Save As and select Web Page as your Save as type. Choose the Selection Sheet radio button and be sure the Add interactivity box is checked. Then click the Publish button and choose a location in which to save the Web page. For the client to use this Web page, the user has to have Internet Explorer 4.01 or higher and Office 2000 Web Components installed. Also, note that you can’t refresh the data in the cube file from the server while users are accessing it. When viewing the Web page, you’ll be delighted to see that the same functionality for rearranging the cube in Excel is available through the browser. Figure 8 shows what the published Web page will look like inside Internet Explorer 5.0.
What Are the Limitations of This Tool?
How big does the cube have to be before this client-side tool will choke? All in all, it seems to be a matter of toying with this tool and learning where the limitation lies for your particular data set. The answer depends on many factors. Besides a PC’s number- crunching power (CPU and RAM), I’ve found the biggest limitation to be dimensions that have a large number of values.
By adding some dummy data to the Northwind database, I performed one test involving almost 600,000 detail records.
I estimated the raw data to be 126 MB (calculated as data record length from the SQL statement times the number of records), but the cube file was only 122 KB. Then, I performed another test involving 350,000 records that had large dimensions. This second test cube, containing only 50 MB of raw data, actually performed much more poorly than the first test. The .CUB file size was over 13 MB. In fact, it wouldn’t even let me view the data by customer. Instead, it gave me a message stating that there weren’t enough resources on the PC! (I’m using a Pentium 233 MHz with 96 MB RAM.) What was the difference between the two cubes? The first cube had more detail data but the customer dimension, for example, had only 91 values. On the other hand, the second cube had a large customer dimension containing thousands of values. Although the first cube had more detail data to process, the number of preaggregates that had to be stored was much less than the second cube, which had a large number of dimension values.
The moral of the story here is that the size of the detail data isn’t the main culprit in limiting Excel’s ability to process OLAP cubes files, rather it is the combination of dimensions.
Performance Tips
Finally, here are a few performance tips you can use to improve your cube creation and access process:
• OLAP cube files are flat files that sit on a hard drive or network server. This means that, unlike the OLAP services provided with SQL Server 7.0, the client has to do all of the work in processing the cube. Therefore, the speedier the PC the better.
• If several users will be accessing the cube file at the same time on a network drive, keep in mind that there may be file-locking and resource-sharing issues that will reduce the speed. It may help to make the cube file read-only so users don’t have the option to update the cube data file. If the cube file isn’t too large, a batch file could be set up to copy the file to the user’s hard drive to alleviate the network overhead.
• Only specify the measures and dimensions that are absolutely critical. If a dimension isn’t used very often, put it in a separate cube or take it out altogether because every extra dimension requires more space and processing time. Don’t be dimension-happy just to please everyone, because with each new dimension comes another load of aggregate summaries.
• Keep dimensions at a high level such as customer or sales representative. Database items such as order number or invoice number are what I call low-level dimensions; these items provide summaries that are very close to the base data. As you saw, OLAP cubes have a very nice drilldown feature. The problem with this feature is that users like to start with a customer, then pick an item, and then want to see what orders these items came from. Do not allow users to do this! A low-level drilldown is not the purpose of the OLAP cube. The cube is supposed to provide high-level summarizations over large amounts of data. Remember, the larger the number of values in a dimension, the more summarizations are going to have to occur andthe cube will process more slowly. If a sales history cube with 100,000 line items is to have an invoice dimension, then, assuming that an average order has five line items, there will be 20,000 invoice aggregates. This number will expand exponentially as more dimensions are added.
• If a cube starts returning Not Enough Resources error messages, consider breaking the single cube up into multiple cubes. Say your troubled cube has ten dimensions. Break up the cube into two smaller cubes, each having five dimensions. This will greatly reduce the number of preaggregates that the cube file will have to store.
• Don’t be in a hurry to refresh the data in a large OLAP cube. Since cubes are meant to analyze large amounts of static data, cube data needs only to be updated once a week or month. Usually a single day doesn’t amount to a hill of beans. Users who need up-to-the- minute information should work with a small cube containing only the current month’s information or work with a different tool altogether.
Cubing AS/400 Data for Fun and Profit
OLAP cubes provide a convenient way to review large amounts of summarized AS/400 data, turning that data into valuable management information. The cube file technique presented here won’t be sufficient for extremely large data sets but it is sufficient to get your feet wet with OLAP before moving your OLAP processing to a different platform. Thanks to Microsoft, cubes can be viewed in common tools such as Excel 2000, Access 2000, and Web browsers. The programmer’s job of providing meaningful information from AS/400 data just became easier.
References and Related Material
Microsoft’s DB2 Universal Database for AS/400 Web site: www.as400.ibm.com/db2/db2main.htm (The AS/400’s DB2 page currently has a link to preview the DB2 OLAP Server for AS/400 product. This page contains summary information about the product’s capabilities.)
Microsoft’s OLAP services Web site: www.microsoft.com/sql/techinfo/olap.htm (This Web site has links describing OLAP services with SQL Server 7.0 and includes articles on how to successfully design an OLAP cube.)
Your Options for Saving Cube Definitions
When creating an OLAP cube using the Microsoft Query add-in for Excel, Microsoft gives you three options for how your cube definition can be saved. You should review these options carefully because your cube definition parameters will affect network performance, response time, and the ability to update your data as needed.
Option 1: Retrieving Data on Demand
This option will save the cube definition (i.e., SQL statement, data source reference) only. The data is retrieved as needed, such as when the spreadsheet is first opened. Only the data necessary for display is shown. For example, if the cube is only being summarized by country, the aggregates for the other dimensions are not retrieved until needed. Option 1 should be used for cubes that don’t change often or when disk and memory space is running low. Because the cube retrieves detail data from the server, this option will be slow for large cubes.
Option 2: Retrieving All Data at Once
As with the first option, this option stores instructions for creating the cube and creates the cube itself only when you open the report. Unlike option one, the cube retrieves all of the data for the report at one
time—when you first open the report—so that you can change what the report displays without waiting for the cube to retrieve more data. For example, if the cube is initially summarized by country, the aggregates for the country dimension and all other dimensions will be retrieved. This option should be used for cubes where users will want to repeatedly change the summary dimensions of the cube or when you do not want to allocate substantial disk space for the .CUB files. Since all of the detail data is retrieved and aggregated at once, you can change the view and display different data rapidly. However, this type of cube requires more memory and temporary disk space, and, again, the initial data retrieval will be slow for large cubes.
Option 3: Saving a Cube File
With this option, all of the detail data will be downloaded from the server, aggregated, and placed in a file on disk. This option is meant for heavily used cubes where the summaries by the different dimensions will be changed often. The benefit of this option is that the cube file can be stored on a network server where it can be accessed by many users. Since the users will be accessing an offline cube file, the server won’t be burdened with large ODBC requests. In addition, this data can be viewed while the server is down. The downsides of this option are that the creation of the cube file is longer and it may require large amounts of storage space.
—Michael Sansoterra
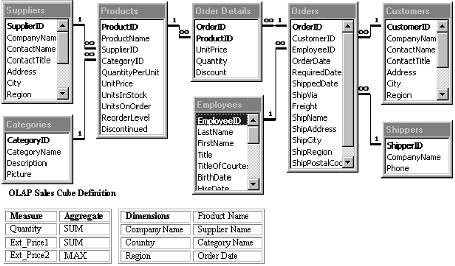
Figure 1: This diagram shows the table relationships for the Northwind Traders sample database. The measures and dimensions for the sales cube are also identified.
SELECT OD.Quantity, OD.UnitPrice*OD.Quantity ,
OD.UnitPrice*OD.Quantity ,
CS.CompanyName, CS.Country,
CS.Region, PD.ProductName,
SP.CompanyName ,
CT.CategoryName, OH.OrderDate
 FROM Northwind.OrderDtls OD
INNER JOIN Northwind.Order OH ON OH.OrderID=OD.OrderID
INNER JOIN Northwind.Products PD ON PD.ProductID=OD.ProductID
INNER JOIN Northwind.Suppliers SP ON
 SP.SupplierID=PD.SupplierID
INNER JOIN Northwind.Customers CS ON
 CS.CustomerID=OH.CustomerID
INNER JOIN Northwind.Category CT ON
CT.CategoryID = PD.CategoryID
Figure 2: This SQL statement is used to extract the measures and dimensions from the database.
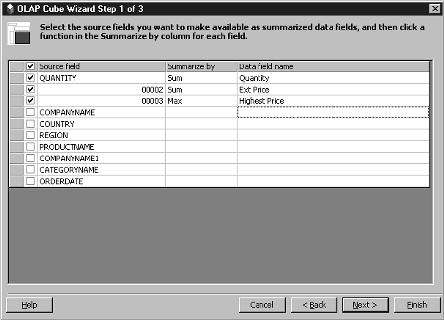
Figure 3: For each data field (measure), select the summarize (aggregate) function and give the data field a user-friendly name in Step 1 of the Cube wizard.
Figure 4: Step 2 of the Cube wizard involves selecting and naming dimensions. Notice that the Country and Order Date dimensions are hierarchical (that is they have subdimensions.)
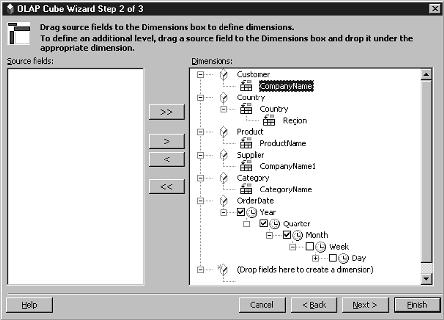
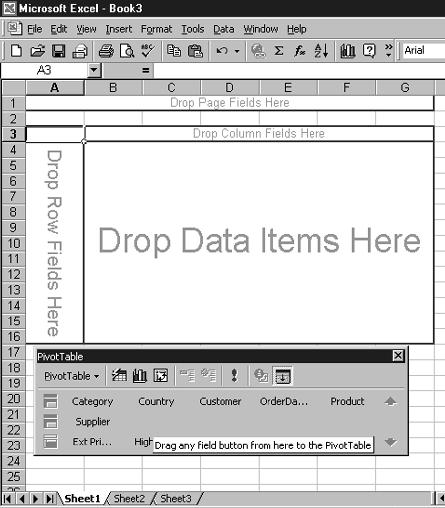
Figure 5: The pivot table contains four sections: page fields, column fields, row fields, and data item fields.
Figure 6: This pivot table shows the extended sale price summarized by date within customer. Moreover, a subset can be done at the country or region level.
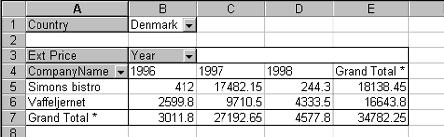
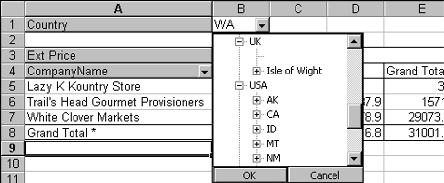
Figure 7: The drilldown-type selection box for the country dimension is used to select summaries at an individual country or region level.
Figure 8: This is the cube as it appears in Internet Explorer 5. The field list, including measures and dimensions, appears on the right.


 More than ever, there is a demand for IT to deliver innovation. Your IBM i has been an essential part of your business operations for years. However, your organization may struggle to maintain the current system and implement new projects. The thousands of customers we've worked with and surveyed state that expectations regarding the digital footprint and vision of the company are not aligned with the current IT environment.
 TRY the one package that solves all your document design and printing challenges on all your platforms. Produce bar code labels, electronic forms, ad hoc reports, and RFID tags – without programming! MarkMagic is the only document design and print solution that combines report writing, WYSIWYG label and forms design, and conditional printing in one integrated product. Make sure your data survives when catastrophe hits. Request your trial now! Request Now.
 Forms of ransomware has been around for over 30 years, and with more and more organizations suffering attacks each year, it continues to endure. What has made ransomware such a durable threat and what is the best way to combat it? In order to prevent ransomware, organizations must first understand how it works.
 Disaster protection is vital to every business. Yet, it often consists of patched together procedures that are prone to error. From automatic backups to data encryption to media management, Robot automates the routine (yet often complex) tasks of iSeries backup and recovery, saving you time and money and making the process safer and more reliable. Automate your backups with the Robot Backup and Recovery Solution. Key features include:
 Business users want new applications now. Market and regulatory pressures require faster application updates and delivery into production. Your IBM i developers may be approaching retirement, and you see no sure way to fill their positions with experienced developers. In addition, you may be caught between maintaining your existing applications and the uncertainty of moving to something new.
 IT managers hoping to find new IBM i talent are discovering that the pool of experienced RPG programmers and operators or administrators with intimate knowledge of the operating system and the applications that run on it is small. This begs the question: How will you manage the platform that supports such a big part of your business? This guide offers strategies and software suggestions to help you plan IT staffing and resources and smooth the transition after your AS/400 talent retires. Read on to learn:
LATEST COMMENTS
MC Press Online