


This article series is designed to provide you with an introduction to the basic concepts of artificial intelligence (AI), machine learning (ML), and deep learning (DL), as well as introduce you to some of the terminology that is frequently used in discussions regarding this technology. This is not a deep dive into AI, ML, and DL but rather a “dictionary” of AI, ML, and DL topics and terms.
The information provided is NOT intended to make you an AI, ML, or DL expert. Nor will it show you how to build, train, and deploy ML and DL models. Instead, it will give you a good foundation in AI, ML, and DL and help you understand some of the terminology you are likely to encounter in discussions, presentations, papers, and books on the subject.
Understanding data

Figure 1: "Data is the new oil"
In 2006, Clive Humby, a British mathematician and entrepreneur in the field of data science and customer-centric business strategies, coined the phrase “Data is the new oil”. Soon after, Michael Palmer, executive vice president of the Association of National Advertisers, amplified the point in a blog post, writing that like oil, data is “valuable, but if unrefined it cannot really be used. [Oil] has to be changed into gas, plastic, chemicals, etc. to create a valuable entity that drives profitable activity; so, data must be broken down and analysed for it to have value.”
But how do organizations deal with the massive amounts of data that’s available to them? And how can they change this valuable “crude” into an even more valuable commodity – the insight needed to make actionable decisions?
These questions are even more consequential today than they were in 2006, given the exponential increase in the amount of data being generated. According to Statista (https://www.statista.com), approximately 97 zettabytes of data was created, copied, captured, or consumed around the world in 2022. And this number is expected to grow to 181 zettabytes by 2025! Therefore, it is incumbent upon organizations to employ tools like artificial intelligence (AI), machine learning (ML), and deep learning (DL), which enable them to ingest and process all this information, and in turn, gain insights that will help them make better decisions and ultimately improve their bottom line.
In its most basic form, data is information that has been translated into some format that can be easily stored, moved, or processed. Computers represent data as binary values using patterns of just two numbers: 0 and 1. And, keeping with the categorization that is central to most computer operations, data can fall into one of three categories:
- Structured
- Unstructured
- Semi-structured
Technically, all data has structure of some sort. So, deciding which category certain data belongs to often comes down to whether that data has a pre-defined structure or is organized in a pre-defined way.
Sources:
Data, the “New Oil,” Cannot Be Used If Left Unrefined. Thankfully, AI Can Help
https://donbasile.com/2021/05/28/data-the-new-oil-cannot-be-used-if-left-unrefined-thankfully-ai-can-help/
Why Do People Still Think Data Is the New Oil?
https://datainnovation.org/2018/01/why-do-people-still-think-data-is-the-new-oil/
Structured Data
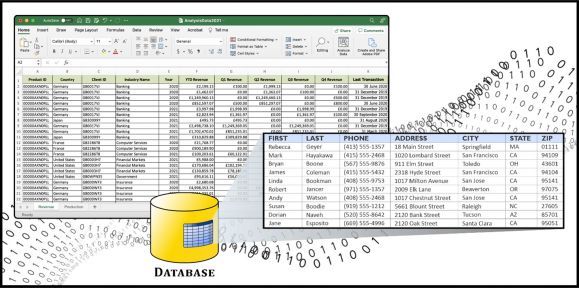
Figure 2: Structured data – data that has a clearly defined format
Structured data refers to data that has a clearly defined size and data type – commonly used data types include characters, numbers, dates, times, and groups of characters called strings. Usually, structured data is organized into some type of formatted repository (typically a spreadsheet or database), so its elements can be made addressable for more effective processing and analysis. Most experts agree that structured data accounts for about 20% of all the data that is generated.
If you look at an Excel spreadsheet, you will notice that it consists of rows (identified by numbers along the left-hand side) and columns (identified by characters across the top). A column typically represents some attribute that has a well-defined data type, and a row represents a single record that has multiple columnar values (or attributes). For instance, a record (row) that contains bank account information, might have one column that contains the account number, another column that contains the account balance, another column that contains the date the last debit or credit was made against the account, and so on. The column that contains the account number may be defined such that it only accepts a string of characters and numbers, the account balance column may only accept currency values, and the column containing information about dates that transactions were performed may only accept valid dates.
As you can see from this example, each row in a structured data set is well defined in that all column values for any given row are somewhat related. We say the row is “structured” because there is a well-defined column for every value stored in the row and each row contains the same set of columns.
Relational database management systems (RDBMSs) like IBM Db2, Oracle, Microsoft SQL Server, and so forth, store data using a similar row-column format, but at a much larger scale. Consequently, they often serve as the main repository for structured data in a company and are frequently used as the primary data source for AI, ML, and DL projects. In many cases, such projects are looking for patterns in existing rows so they can predict the value for a given column.
For example, if a table in a database contains information about the local real estate market, a single record (for a house) might contain information such as style, location, square footage, lot size, number of bedrooms, number of bathrooms, room sizes, tax appraisal value, last sale price, and so on. Using this data, an ML model could be developed that accurately predicts the sales price for a home when presented with information found in the other columns. And an application could be developed that uses this ML model to predict the optimum sale price for a new home coming on the market when all relevant information is provided.
Unstructured Data

Figure 3: Unstructured data – drawings, photographic images, audio clips, videos, etc.
Unstructured data is data that either does not have a pre-defined data model or is not organized in a pre-defined manner. Drawings, photographic images, audio clips, and videos are examples of unstructured data. That said, it’s important to note that a small amount of metadata – attributes that define the data itself – that has a defined structure may be stored with this type of data so delivery mechanisms can use it. For example, image data stored in a JPEG (Joint Photographic Experts Group)-formatted file will have some structured metadata stored with it so select applications will know how to use the data to render the image on a computer screen.
According to Gartner, somewhere around 80% of enterprise data originates in unstructured form. IDC claims that unstructured data grows at 26.8% annually compared to structured data, which only grows at 19.6%. And it’s not just the digital photos, recordings, videos, and social media postings people produce daily that is driving this trend; unstructured data is increasingly being generated by machines like laboratory equipment and medical devices, as well as software that aids in tasks like electronic design and geospatial modeling.
As businesses embrace AI, ML, and DL, unstructured data is becoming essential to their offerings and operations. Why? Because ML and DL algorithms are capable of gaining valuable insights from unstructured data that are otherwise impossible to derive.
For example, the medical industry is beginning to see ML and DL models that can use unstructured data in the form of images to help diagnose cancer and other diseases. In other areas, ML and DL models are being used to search social media for patterns that indicate a user’s sentiment (how they feel) about a particular product or service, and to create chatbots (software that conducts a conversation via audio or text to convincingly simulate how a human would behave as a conversational partner) to answer questions that traditionally would have been addressed by someone working at a help desk.
Semi-structured Data
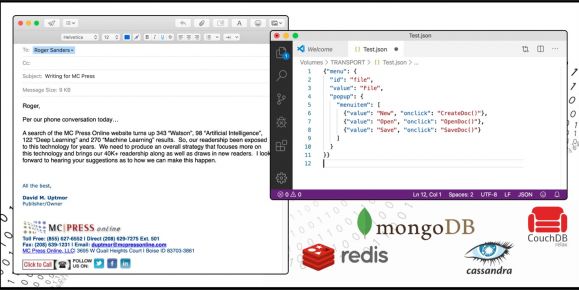
Figure 4: Semi-structured data – data with some number of organizational properties.
Semi-structured data is a form of structured data that does not adhere to the formal structure used with spreadsheets and relational databases, but nonetheless has some organizational properties like semantic tags and hierarchies, that make it easier to read and analyze. A good example of semi-structured data is Hypertext Markup Language (HTML) code, which doesn't restrict the amount of information that can be stored in a document, but still enforces a hierarchy via required semantic elements. (HTML is the standard markup language that is used for documents that are designed to be displayed in a web browser.) Other forms of semi-structured data include:
- Email messages – a method of exchanging messages between people using electronic devices.
- Comma Separated Value (CSV) files – CSV files consist of “rows” of data where each “column” value is separated by a comma and each row is separated by a carriage-return/line feed character.
- Extensible Markup Language (XML) documents – XML is a markup language that defines a set of rules for encoding documents in a format that is both human and machine readable.
- JavaScript Object Notation (JSON) objects – JSON is an open standard format that uses human readable text to transmit data objects consisting of attribute–value pairs.
- Electronic Data Interchange (EDI) documents – EDI is a process that allows one company to send information to another company electronically rather than with paper. Many business documents can be exchanged using EDI, but the two most common are purchase orders and invoices.
- Resource Description Framework (RDF) metadata – RDF is a standard model for data interchange on the Web that allows structured and semi-structured data to be mixed, exposed, and shared across different applications.
- NoSQL database data – A NoSQL database provides a mechanism for the storage and retrieval of data that is modeled in methods other than that used with relational databases. (Popular NoSQL databases include MongoDB, Redis, Apache CouchDB, and Cassandra, to name a few.)
It’s important to note that because very little data in the modern age has absolutely no structure and no metadata associated with it, data that is categorized as being unstructured could, technically, be considered semi-structured. So, there are some who argue that the distinction between unstructured and semi-structured data is moot.
Adding Dimensions to Data
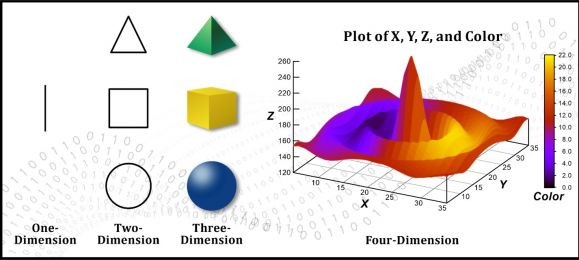
Figure 5: Data in terms of dimensions
Now that we have looked at the different types of data that’s available, let’s talk about data in terms of dimensions. It’s relatively easy to conceptualize dimensions when it comes to two-dimensional (2D) and three-dimensional (3D) objects. For example, a circle, square, or triangle drawn on a piece of paper has two dimensions – width and height. But a cube or sphere drawn on a piece of paper, along with the paper itself and practically every other object in the world has three dimensions – width, height, and depth (sometimes referred to as length or thickness).
It’s also not that difficult for humans to visualize objects in four dimensions. The four-dimensional example shown in Figure 5 begins with a three-dimensional graph that shows X, Y, and Z planes, and then adds color to create a fourth dimension. In the real world, the fourth dimension is often referred to as the time dimension. Thus, a box being thrown from one person to another has four dimensions – the width, height, and length of the box, coupled with the time it takes for the box to travel through the air.
But how do you graphically represent a fifth-dimension, sixth-dimension, or more? If you have data stored in a table that has four or more columns and you think of each column as being a different dimension, it’s not too difficult to picture what data with more than four dimensions might look like. However, trying to find patterns or correlations in all that data is difficult. And having more than four columns (dimensions) makes the problem exponentially more difficult to solve. The more dimensions you have, the more combinations of data you need to examine to find patterns amongst all the possible combinations of data available. That’s why it’s a good idea to eliminate dimensions that are not needed before you attempt to use data for AI, ML, and DL.
Stay Tuned
In the next part of this article series, we’ll explore what AI, ML, and DL are, as well as look at the building blocks of AI, ML, and DL, and explore the typical ML and DL workflow.

Roger E. Sanders is a Principal Sales Enablement & Skills Content Specialist at IBM. He has worked with Db2 (formerly DB2 for Linux, UNIX, and Windows) since it was first introduced on the IBM PC (1991) and is the author of 26 books on relational database technology (25 on Db2; one on ODBC). For 10 years he authored the “Distributed DBA” column in IBM Data Magazine, and he has written articles for publications like Certification Magazine, Database Trends and Applications, and IDUG Solutions Journal (the official magazine of the International Db2 User's Group), as well as tutorials and articles for IBM's developerWorks website. In 2019, he edited the manuscript and prepared illustrations for the book “Artificial Intelligence, Evolution and Revolution” by Steven Astorino, Mark Simmonds, and Dr. Jean-Francois Puget.
From 2008 to 2015, Roger was recognized as an IBM Champion for his contributions to the IBM Data Management community; in 2012 he was recognized as an IBM developerWorks Master Author, Level 2 (for his contributions to the IBM developerWorks community); and, in 2021 he was recognized as an IBM Redbooks Platinum Author. He lives in Fuquay Varina, North Carolina.
MC Press books written by Roger E. Sanders available now on the MC Press Bookstore.
 |
QuickStart Guide to Db2 Development with Python Discover how Python, SQL, and Db2 can successfully be used with each other. List Price $9.95 Now On Sale
|
|
 |
DB2 10.5 Fundamentals for LUW (Exam 615) Don't even think about attempting to take the DB2 Fundamentals exam without this indispensable study guide. Now On Sale
|
|
 |
DB2 10.1 Fundamentals (Exam 610) Let one of the world's leading DB2 authors and a participant in the exam development help you succeed. List Price $79.95 Now On Sale
|
|
 |
Artificial Intelligence: Evolution and Revolution Operational AI has become available to the masses, setting the wheels in motion for a worldwide AI revolution that has never been seen before. Now On Sale
|
|
 |
DB2 10.5 DBA for LUW Upgrade from DB2 10.1: Certification Study Notes Here's everything you need to know to take and pass Exam 311, complete with a practice exam and study key. List Price $21.95 Now On Sale
|
|
 |
From Idea to Print Here's everything you need to know to turn your technical knowledge and expertise into a published article or book. Now On Sale
|
|
|
DB2 9 Fundamentals (Exam 730) Use this review before taking the test to prove you've mastered the basics of DB2 9. List Price $59.95 Now On Sale
|
|
 |
DB2 9 for Linux, UNIX, and Windows Database Administration (Exam 731) Use this indispensable study guide to prepare to take, and pass, Exam 731. Now On Sale
|
|
 |
DB2 9.7 for Linux, UNIX, and Windows Database Administration (Exam 541) Get ready to take the DB2 9.7 certification exam with this handy study guide. List Price $21.95 Now On Sale
|
|
 |
DB2 9 for Linux, UNIX, and Windows Advanced Database Administration (Exam 734) Review all exam topics and take the included practice test to be sure you're ready on testing day. Now On Sale
|
|
 |
DB2 9 for Linux, UNIX, and Windows Database Administration Upgrade (Exam 736) Prep for success with the master of DB2 certification study guides! List Price $34.95 Now On Sale
|
|
 |
Data Fabric: An Intelligent Data Architecture for AI This book explains the concepts and values that a data fabric approach can deliver to both technical and business communities. Now On Sale
|
|


 More than ever, there is a demand for IT to deliver innovation. Your IBM i has been an essential part of your business operations for years. However, your organization may struggle to maintain the current system and implement new projects. The thousands of customers we've worked with and surveyed state that expectations regarding the digital footprint and vision of the company are not aligned with the current IT environment.
 TRY the one package that solves all your document design and printing challenges on all your platforms. Produce bar code labels, electronic forms, ad hoc reports, and RFID tags – without programming! MarkMagic is the only document design and print solution that combines report writing, WYSIWYG label and forms design, and conditional printing in one integrated product. Make sure your data survives when catastrophe hits. Request your trial now! Request Now.
 Forms of ransomware has been around for over 30 years, and with more and more organizations suffering attacks each year, it continues to endure. What has made ransomware such a durable threat and what is the best way to combat it? In order to prevent ransomware, organizations must first understand how it works.
 Disaster protection is vital to every business. Yet, it often consists of patched together procedures that are prone to error. From automatic backups to data encryption to media management, Robot automates the routine (yet often complex) tasks of iSeries backup and recovery, saving you time and money and making the process safer and more reliable. Automate your backups with the Robot Backup and Recovery Solution. Key features include:
 Business users want new applications now. Market and regulatory pressures require faster application updates and delivery into production. Your IBM i developers may be approaching retirement, and you see no sure way to fill their positions with experienced developers. In addition, you may be caught between maintaining your existing applications and the uncertainty of moving to something new.
 IT managers hoping to find new IBM i talent are discovering that the pool of experienced RPG programmers and operators or administrators with intimate knowledge of the operating system and the applications that run on it is small. This begs the question: How will you manage the platform that supports such a big part of your business? This guide offers strategies and software suggestions to help you plan IT staffing and resources and smooth the transition after your AS/400 talent retires. Read on to learn:
LATEST COMMENTS
MC Press Online