


The final installment of our series, Artificial Intelligence Fundamentals, covers measuring quality and understanding challenges.
If you missed them, Read Part 1, Understanding Data, Part 2: Artificial Intelligence, Machine Learning, and Deep Learning, Part 3: Data Preparation and Model Tuning, Part 4: Machine Learning Methods and Artificial Intelligence, Part 5: Deep Learning here.
Measuring the quality of results
Model accuracy is a measurement that is used to determine if a machine learning (ML) or deep learning (DL) model is capable of accurately making predictions or identifying relationships and patterns between variables in a data set, based on model input. The better a model can generalize to new, unseen data, the better the predictions and insights it produces. Companies that deploy ML and DL models in production environments rely on those models to make practical business decisions. Therefore, more accurate model outcomes result in better decision making. So, optimizing model accuracy is crucial. However, it’s important to keep in mind that there is a point of diminishing returns where the value of developing a more accurate model will not result in a corresponding profit increase. Still, data scientists should strive to create models that are as accurate as possible.
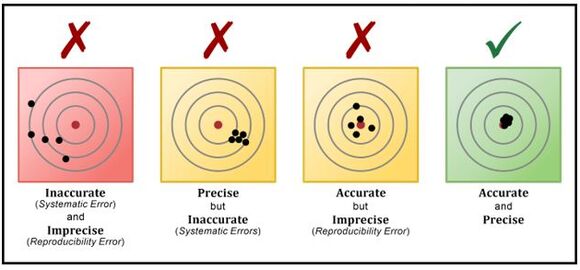
Figure 1: Model quality measurements
Most of the time, classification accuracy is used to measure the performance of a trained model. However, other types of evaluation metrics are available. And a model that delivers satisfying results when evaluated with one metric may give poor results when evaluated with another.
Metrics that are frequently used to evaluate model accuracy include:
- Classification accuracy: Classification accuracy is what we usually mean when we use the term accuracy. It is the ratio of number of correct predictions to the total number of input samples (Accuracy = Number of correct predictions / Number of predictions made). Unfortunately, this method works well only if there is an equal number of samples in each class. For example, if the training data set consists of 98% of class A samples and 2% of class B samples, then a model trained on this data can easily deliver 98% accuracy by simply predicting every training sample as belonging to class A. However, if the same model is tested with a data set that consists of 60% of class A samples and 40% of class B samples, accuracy would drop to 60%. Thus, classification accuracy can give a false sense of achieving high accuracy. And, the real problem arises, when the cost of misclassification of the minor class samples is high. (For example, the cost of failing to diagnose a rare but fatal disease is much higher than the cost of sending a healthy person to get more tests.)
- Logarithmic loss: Logarithmic loss (or Log Loss) works by penalizing false classifications. When working with Log Loss, the classifier must assign probability to each class for all the samples examined. Log Loss has no upper bound and it exists on a range of 0 to infinity – a Log Loss value nearer to 0 indicates higher accuracy, whereas a Log Loss value away from 0 indicates lower accuracy. In general, minimizing Log Loss gives greater accuracy for a classifier.
- Confusion matrix: As the name implies, confusion matrix gives a matrix as output and describes the complete performance of the model. For example, if we have a binary classification problem, some data belonging to one of two classes (YES or NO), and a model that predicts a class for a given input sample, accuracy of the matrix generated by the model can be calculated by taking an average of the values lying across the “main ” In other words, Accuracy = (True Positives + False Negatives) / Total number of samples where:
- True Positives is the number of cases in which the model predicted YES, and the actual output was YES.
- True Negatives is the number of cases in which the model predicted NO, and the actual output was NO.
- False Positives is the number of cases in which the model predicted YES, and the actual output was NO.
- And finally, False Negatives is the number of cases in which the model predicted NO, and the actual output was YES.
- Area under curve: Area under curve (AUC) is one of the most widely used metrics for evaluating binary classification problems. The AUC value of a model is equal to the probability that the model will rank a randomly chosen positive example higher than a randomly chosen negative example. AUC has a range of 0 to 1 – the greater the value, the better the model performs. As the name implies, AUC is the area under the curve of a plot of False Positive Rate versus True Positive Rate where True Positive Rate (also known as Sensitivity) corresponds to the proportion of positive data points that are correctly considered as positive, with respect to all positive data points (True Positive Rate = True Positive / (False Negative + True Positive). False Positive Rate (also known as Specificity) corresponds to the proportion of negative data points that are mistakenly considered as positive, with respect to all negative data points (False Positive Rate = False Positive / (False Positive +True Negative).
- F1 Score: F1 Score is the Harmonic Mean between Precision and Recall, where Precision is the number of correct positive results divided by the number of positive results predicted by the classifier and Recall is the number of correct positive results divided by the number of all relevant samples (that is, all samples that should have been identified as positive). It tells you how precise a classifier model is (i.e., how many instances it classifies correctly), as well as how robust it is (that is, whether it misses a significant number of instances). The range for F1 Score is 0 to 1 – the greater the F1 Score, the better the performance of the model. It’s important to note that a model with a high precision but low recall is an extremely accurate model. However, such a model is very likely to miss a large number of instances that are difficult to classify.
- Mean Absolute Error: Mean Absolute Error is the average of the difference between the Original Values and the Predicted Values. In other words, Mean Absolute Error provides a measure of how far predictions made by a model were from the actual output values. However, Mean Absolute Error does not give any indication of the direction of the error; that is, whether the model is under predicting or over predicting.
- Mean Squared Error: Mean Squared Error (MSE) is similar to Mean Absolute Error, the only difference being that MSE takes the average of the square of the difference between the Original Values and the Predicted Values. The advantage of MSE is that it is easier to compute the gradient, whereas with Mean Absolute Error, complicated linear programming tools are needed to compute the gradient. By calculating the square of the error, the effect of larger errors becomes more pronounced.
In an earlier article in this series, we saw that most data scientists divide their data (that is, historical data that contains both input attributes and known output targets) into three different data sets: a training data set, a validation data set, and a test data set. To properly evaluate the accuracy of a model, only the data in the test data set should be used. Evaluating the accuracy of a model with the same data that was used for training is not useful because this rewards models that can "remember" the training data, as opposed to testing the model’s ability to generalize to new data. Since the test data set normally consists of labeled data, it’s possible to compare the predictions returned by the model against known target values (“ground truth”) using any of the metrics just described.
The accuracy of a poorly performing model can often be improved by taking one of the following actions:
- Providing more labelled training data
- Providing higher quality training data
- Training over a larger number of iterations.
Challenges of implementing ML (and DL)
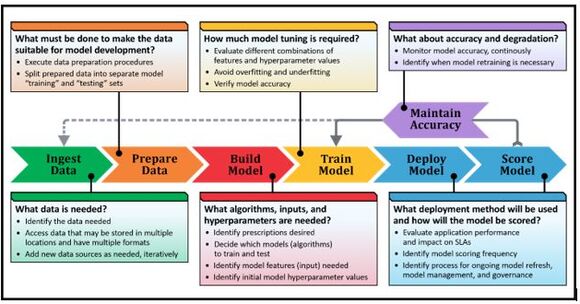
Figure 2: Challenges of implementing ML and DL models
Let’s talk a little about the challenges of the ML/DL process. As we saw in an earlier article in this series, data professionals (i.e., data scientists and data engineers) must follow an iterative set of steps to prepare data for, and then develop, train, deploy, score, and monitor an ML or DL model. Depending upon the complexity of the data or the model used, it can take months for a single model to go from idea to production. Therefore, you should start any new machine learning initiative by having a clear understanding of the problem you’re trying to solve. You also need to be able to identify the desired outcomes (or prescriptions) – that is, the insights you expect your model to find. This forces you to qualify your data and decide on a minimum prediction accuracy your trained model is expected to deliver. It also requires you to choose options that accommodate both the business need, and your organization’s technical vision.
The data needed to fuel an ML/DL environment often must be accessed, imported – typically into a database – and transformed before it can be used. This work can be challenging because data can come from anywhere and can be stored in a variety of formats. During transformation, interesting facts or features must be culled from the data used. (This is referred to as “feature engineering.”) Unfortunately, this process can be quite time consuming – as we saw earlier, studies have found that as much as 80% of the time consumed by a data science project is spent combining, consolidating, aggregating, formatting, and changing the shape of data.
Only when data preparation is complete, can the actual ML/DL process begin. This process includes choosing a set of models (algorithms) to train and test, as well as identifying which model predicts outcomes with the greatest level of accuracy. Data scientists typically take a “trial and error” approach to this part of the process – they apply each candidate algorithm to the training data set and select the algorithm that renders the best results. This too can be a time consuming, iterative process that requires a significant amount of computing resources.
Once the best model has been identified, it must be re-tested using a new subset of known, labeled data and evaluated by verifying the accuracy of the results produced (using one or more of the methods described earlier). Ideally, the model is also checked to ensure it is not “overfit” (has learned too much from the training data to make accurate predictions) or “underfit” (is too complex or too flexible). It is only when this work has been done that the trained and validated model is ready to be deployed.
When a data scientist develops an ML/DL model, their ultimate goal is (or should be) to deploy that model in a real-world, production environment. That’s the only way a model can truly be used to make practical, data-based business decisions. Model deployment refers to the method by which models are integrated into an existing production environment and it is one of the last stages in the ML/DL life cycle. Ironically, model deployment can also be one of the most difficult challenges companies face. Algorithmia, an organization that specializes in machine learning model production deployment, found that 55% of those surveyed for their 2020 State of Enterprise Machine Learning report have NOT actually put a model into production.
One reason why model deployment is so challenging is because the model itself is usually just a small component of a much larger system. This means you cannot think about model deployment in isolation. It needs to be planned at a system level, which requires coordination between data scientists, IT teams, software developers, and business professionals to ensure the model works reliably without impacting service level agreements (SLAs). Other issues that make ML model deployment hard include:
- Use of multiple programming languages: ML and DL applications often consist of elements that are written in different programming languages and those languages don’t always work well with each other. In general, Python and R are the most popular languages used to build and train ML/DL models, but models written in these languages may be ported to a language like C++ or Java to improve interoperability and/or performance. However, porting from one language to another can be difficult. Containerization technologies like Docker can help solve incompatibility and portability challenges; but automatic dependency checking, error checking, and testing can still fail because of a language barrier.
- Need for lots of compute power and graphics processing units (GPUs): Neural networks are often deep, which means that a lot of compute power is required to train and use them. The same holds true if neural networks are put in production environments because they will need to be able to process data fast, and often for many users, simultaneously. If a production environment requires a large number of GPUs, this can add another layer of cost and complexity to the deployment task.
- Lack of abstraction boundaries: Traditional software development has shown that strong abstraction boundaries – that is, the use of encapsulation and modular design – help create code in which it is easy to make isolated changes and improvements. Unfortunately, it is difficult to enforce strict abstraction boundaries for ML/DL systems. In fact, ML/DL is used in exactly those cases where the desired behavior cannot be effectively expressed in software logic.
- Scalability: At the beginning of a project, data scientists often rely on a manageable and relatively static data set for model development and training. But, when a model is moved into a production environment, it is typically exposed to much larger volumes of data. And it must be able to scale to handle this data volume, as well as meet application and user demands.
One way to deploy a model is to simply save the trained and tested model somewhere on a production machine. Consumers can then read (restore) the model file and use it with their own data set. However, this approach may be insufficient, since only individuals who have access to the production machine will be able to use the model.
In most cases, model consumers don’t have access to production environments. Thus, a more common way of making a trained and tested model available is by exposing it as a service. This is typically done in the form of a representational state transfer (REST) service, which is an architectural style and approach to communications that is often used in web services development. Web services that conform to the REST architectural style (called RESTful Web services), provide interoperability between computer systems on the Internet. And a set of functions known as RESTful application programming interfaces (APIs) enable application developers to interact with this service. RESTful APIs enable models to be used by a wider audience since they can be called from any application, running anywhere.
To use a model deployed in this manner, a developer would simply use the appropriate API to send input data to the model (which should be similar to the data used in model training), and then call another API to obtain the output produced. The output is often referred to as an inference since the model is “inferring” a result based on the input it received. It may also be called a score if the model produces a score that someone can make a decision from. It’s important to note that inferencing can take place on a different server than the one where the model being invoked was trained. In fact, inferencing can often benefit by being close to where the data that will be used by the model originates.
That said, the initial deployment of a model is not the hardest part (even though it can be one of the most challenging). It’s the ongoing system maintenance, model updates, and model auditing and monitoring where the real technical debt starts to build. Deployed models must be continuously monitored to ensure their quality doesn’t degrade over time. (Model performance can deteriorate because underlying circumstances can and do change. For instance, fraud detection models can become less accurate over time as criminals look for new ways to beat fraud detection systems.)
Source:
2020 State of Enterprise Machine Learning
https://info.algorithmia.com/hubfs/2019/Whitepapers/The-State-of-Enterprise-ML-2020/Algorithmia_2020_State_of_Enterprise_ML.pdf

Roger E. Sanders is a Principal Sales Enablement & Skills Content Specialist at IBM. He has worked with Db2 (formerly DB2 for Linux, UNIX, and Windows) since it was first introduced on the IBM PC (1991) and is the author of 26 books on relational database technology (25 on Db2; one on ODBC). For 10 years he authored the “Distributed DBA” column in IBM Data Magazine, and he has written articles for publications like Certification Magazine, Database Trends and Applications, and IDUG Solutions Journal (the official magazine of the International Db2 User's Group), as well as tutorials and articles for IBM's developerWorks website. In 2019, he edited the manuscript and prepared illustrations for the book “Artificial Intelligence, Evolution and Revolution” by Steven Astorino, Mark Simmonds, and Dr. Jean-Francois Puget.
From 2008 to 2015, Roger was recognized as an IBM Champion for his contributions to the IBM Data Management community; in 2012 he was recognized as an IBM developerWorks Master Author, Level 2 (for his contributions to the IBM developerWorks community); and, in 2021 he was recognized as an IBM Redbooks Platinum Author. He lives in Fuquay Varina, North Carolina.
MC Press books written by Roger E. Sanders available now on the MC Press Bookstore.
 |
QuickStart Guide to Db2 Development with Python Discover how Python, SQL, and Db2 can successfully be used with each other. List Price $9.95 Now On Sale
|
|
 |
DB2 10.5 Fundamentals for LUW (Exam 615) Don't even think about attempting to take the DB2 Fundamentals exam without this indispensable study guide. Now On Sale
|
|
 |
DB2 10.1 Fundamentals (Exam 610) Let one of the world's leading DB2 authors and a participant in the exam development help you succeed. List Price $79.95 Now On Sale
|
|
 |
Artificial Intelligence: Evolution and Revolution Operational AI has become available to the masses, setting the wheels in motion for a worldwide AI revolution that has never been seen before. Now On Sale
|
|
 |
DB2 10.5 DBA for LUW Upgrade from DB2 10.1: Certification Study Notes Here's everything you need to know to take and pass Exam 311, complete with a practice exam and study key. List Price $21.95 Now On Sale
|
|
 |
From Idea to Print Here's everything you need to know to turn your technical knowledge and expertise into a published article or book. Now On Sale
|
|
|
DB2 9 Fundamentals (Exam 730) Use this review before taking the test to prove you've mastered the basics of DB2 9. List Price $59.95 Now On Sale
|
|
 |
DB2 9 for Linux, UNIX, and Windows Database Administration (Exam 731) Use this indispensable study guide to prepare to take, and pass, Exam 731. Now On Sale
|
|
 |
DB2 9.7 for Linux, UNIX, and Windows Database Administration (Exam 541) Get ready to take the DB2 9.7 certification exam with this handy study guide. List Price $21.95 Now On Sale
|
|
 |
DB2 9 for Linux, UNIX, and Windows Advanced Database Administration (Exam 734) Review all exam topics and take the included practice test to be sure you're ready on testing day. Now On Sale
|
|
 |
DB2 9 for Linux, UNIX, and Windows Database Administration Upgrade (Exam 736) Prep for success with the master of DB2 certification study guides! List Price $34.95 Now On Sale
|
|
 |
Data Fabric: An Intelligent Data Architecture for AI This book explains the concepts and values that a data fabric approach can deliver to both technical and business communities. Now On Sale
|
|


 More than ever, there is a demand for IT to deliver innovation. Your IBM i has been an essential part of your business operations for years. However, your organization may struggle to maintain the current system and implement new projects. The thousands of customers we've worked with and surveyed state that expectations regarding the digital footprint and vision of the company are not aligned with the current IT environment.
 TRY the one package that solves all your document design and printing challenges on all your platforms. Produce bar code labels, electronic forms, ad hoc reports, and RFID tags – without programming! MarkMagic is the only document design and print solution that combines report writing, WYSIWYG label and forms design, and conditional printing in one integrated product. Make sure your data survives when catastrophe hits. Request your trial now! Request Now.
 Forms of ransomware has been around for over 30 years, and with more and more organizations suffering attacks each year, it continues to endure. What has made ransomware such a durable threat and what is the best way to combat it? In order to prevent ransomware, organizations must first understand how it works.
 Disaster protection is vital to every business. Yet, it often consists of patched together procedures that are prone to error. From automatic backups to data encryption to media management, Robot automates the routine (yet often complex) tasks of iSeries backup and recovery, saving you time and money and making the process safer and more reliable. Automate your backups with the Robot Backup and Recovery Solution. Key features include:
 Business users want new applications now. Market and regulatory pressures require faster application updates and delivery into production. Your IBM i developers may be approaching retirement, and you see no sure way to fill their positions with experienced developers. In addition, you may be caught between maintaining your existing applications and the uncertainty of moving to something new.
 IT managers hoping to find new IBM i talent are discovering that the pool of experienced RPG programmers and operators or administrators with intimate knowledge of the operating system and the applications that run on it is small. This begs the question: How will you manage the platform that supports such a big part of your business? This guide offers strategies and software suggestions to help you plan IT staffing and resources and smooth the transition after your AS/400 talent retires. Read on to learn:
LATEST COMMENTS
MC Press Online